Vol. 15 No. 1 January 2004
Manuela Roscher
Dresden University of Technology
Tharandt, Germany
Dag Fjeld
Swedish University of Agricultural Sciences
Umeå, Sweden
Thomas Parklund
VSV Frakt AB
Karlstad, Sweden
The authors are, respectively, Researcher, Dresden University of Technology; Lecturer, Swedish University of Agricultural Sciences; and Development Manager, VSV Frakt AB.
ABSTRACT
The use of mobile data systems (MDS) in round wood transport is increasing. The most common functions for MDS include: distribution of transport plans and orders, navigation to the forest site (GPS, GIS) and reporting of transport volumes. This paper examines the transport patterns for trucks with and without the support of MDS in central Sweden. The variables are based on data from 13 trucks with MDS and 13 without MDS. All trucks were operating within the same planning organization however the selection of trucks to be equipped with MDS support was done independent of this study. Data was collected using a random sample of 5 days per month over one year of operations.
While the number of operating days per month was similar for the two groups, other differences were observed. The daily number of separate forest destinations was 4.13 for trucks with MDS and 3.70 for those without. The daily number of separate mill destinations visited was 2.66 for trucks with MDS and 2.17 for those without. The size of the total annual operating area was 29,050 km2 for those with MDS and 18,656 km2 for those without. The main operating area constituted 35.3 % and 28.2 % of the total annual operating areas for trucks with and without MDS, respectively.
Keywords: transport destination, location, operating areas, mobile data systems, round wood, Sweden.
INTRODUCTION
Bowersox and Daugherty [1] characterize three general strategies for logistics activities. These include cost minimization, control and adaptability enhancement and value-added maximization. Skoog [12] in an earlier study of Swedish companies showed that the dominating goal for most wood supply organizations was cost reduction. Nilsson [10] shows that Swedish organizations are now developing their objectives. While all agree that cost is still the primary goal, mill service objectives are now being defined in terms of new levels of delivery precision and even responsibility for mill stock management. Fulfilling these objectives requires greater attention to system control and adaptability.
In central Sweden the geographical distribution of forests and mills is quite even, resulting in a high number of alternative supply and demand nodes within a short distance. From a mill perspective this characterizes a supply network subject to numerous potential disturbances. Present trends towards reduction in roadside and mill stocks places more emphasis on the role of transport operations to balance wood flow and mill consumption [2]. This increases the need for frequent follow-up and plan revision in transport operations.
Hulten and Bolin [4] describe a general transport system model as consisting of self-regulating subsystems. In this model each of the subsystems has the same basic process cycle of planning, execution and control (PEC). According to this model the execution process of one system (transport administrator) contains the planning, execution and control of its subsystem (fleet manager). At the same time the execution process of the subsystem (fleet manager) contains the planning, execution and control of its respective subsystem (vehicle and operator). Accordingly, each execution process is preceded and followed by an external information exchange.
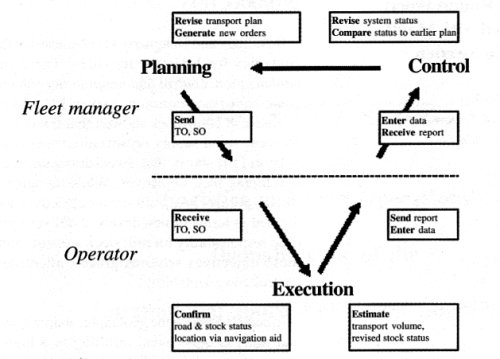
The basic information flow between fleet manager and truck operator for a single round wood transport is shown below (Figure 1). At the tactical level the main planning and control processes concern the delivery plan of volumes for the receiving mill.
Figure 1. An example of basic information flow between fleet manager and truck operator for planning, execution and control of round wood transport (TO, SO = transport and scaling orders). The dotted line marks the interface of external information exchange.
At the operational level, the sequencing of single transport assignments (e.g., shipping to an individual destination) is often dependent on vehicle routing plans for a number of trucks coordinated by the fleet manager. These plans are based on combining simple transport assignments into complex routes in order to increase backhauling within the restrictions of the delivery plan [9, 11]. The fleet manager is responsible for revising system status and transport plans once per PEC cycle. With 20 trucks making 4 deliveries per day, a daily PEC cycle can involve assignment of over 80 transport orders per day, all depending on the number of supply nodes to be visited.
In order to support the demands for the above processes Johansson [6] suggests that a complete wood flow management system should include the following modules:
The mobile data system (MDS) is that part of the operating system that can be accessed by both harvesting and transport operators. For transport operators, MDS consists of hard- and software with the following functions
Svanberg [13] made a questionnaire study of Swedish and Finnish experiences with MDS in round wood transport and concludes that its three main advantages are:
The combinations of hardware and software used in these management systems varies between countries. Typically Swedish transport companies (Sydved, Skogsåkarna, VSV Frakt) use Åkarströms mobile PCs with email and GIS/GPS navigation aid. Finnish forest companies (Metsäliito, UPM-Kymmene, StoraEnso) often have Sunit/Ponsse mobile PCs, also with email and GIS/GPS navigation aid. A number of applications have also implemented optimized vehicle routing functions [7, 9].
The three main advantages of MDS cited by Svanberg [13] were results of a questionnaire study. Two of these advantages (better planning and faster reporting) are logical consequences of the new technology. The third advantage (larger operating areas) is, however, dependent on a number of factors and has not been confirmed in an empirical study.
Aim
The aim of this paper is to examine transport patterns for trucks with and without the support of MDS. The examination concerns primarily spatial data such as the number and location of forest and mill destinations visited.
METHODS
The data was collected from a single transport company (having trucks both with and without MDS) in order to have as similar framework for comparison as possible. The company chosen for this study was VSV Frakt AB in Mid-Sweden. VSV Frakt AB is an association of independently-owned transporters with a common administration. VSV has over 150 trucks and 500 employees working with round wood transport. Their transport administration system is called TROMB (TRansport and Mobile Beordering). The system has an office application and a mobile application. The two applications are connected by a one-way network (FM-wavelength for office-to-truck) and a two-way network (MOBITEX network for both truck-to-office and office-to-truck). The office has a server distributing data via the FM network and a modem for MOBITEX data transmission. The vehicle hardware is the Åkarströms Trux 4400 PC. Navigation support is given by GPS on both 1:100,000 and 1:250,000 maps in GIS. Vehicle routing and road condition updating are done manually.
The study period for data collection was March 2000 to February 2001. Complete transport data was collected for 26 trucks; 13 with MDS and 13 without. At the time of the study VSV had 20 vehicles with MDS. The decision to install MDS in specific trucks was not influenced by this study. A common assumption for the trucks selected for MDS installation is that these they were the ones that would benefit most from this technology, therefore warranting the extra investment. Complete data for the study period was only available for 13 of these. The number of trucks studied represents over 50 % of the MDS-equipped vehicles and 10 % of those without. A mathematically rigid comparison of the two groups under the assumption of identical populations is therefore not possible. The trucks studied without MDS were selected by the company according to the criteria that they should have representative operating conditions.
Data were collected per individual truck at two different intervals. The number of operating days per month was registered for every month of one year. In order to be counted as active on a specific date, the truck had to deliver at least one load to a scaling station. The number and locations of forest and mill destinations per day were based on a sample of 5 randomly-chosen days per month (Table 1).
Table 1: The sample of spatial transport data for trucks at VSV Frakt AB.
| No. of trucks | Days /month | Days /year | Observations | ||
| Trucks w/ MDS | 13 | 5 | 60 | 780 | |
| Trucks w/o MDS | 13 | 5 | 60 | 780 | |
Data was collected via the national transport database VIOL (Wood-On-Line) which is administrated by SDC (The Forestry Data Centre). The forest location data in VIOL is given on the basis of state administrative units (county, municipality, parish, and sub-unit). UTM coordinates were also available for many but not all forest destinations. In these cases only the VIOL codes were used. All mill location data was specified with UTM coordinates.
Data calculations were done in the Access database program. The calculations and presentation of spatial data was handled via GIS ArcView software.
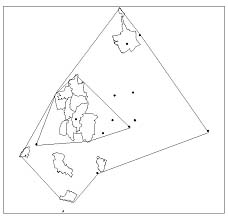
The total annual operating areas for each truck were calculated as the minimum convex polygons encompassing a whole year's operations [3]. This is the same function used to establish the outer perimeter of "home territories" in wildlife dispersal studies. Bordering points for the operation area are those forest and mill destinations that enclose the whole area. Within the annual operating area, a main operation area was also identified. The main operating area enclosed the adjacent forest destination municipalities and mills which each represented more than 5 % of all deliveries for the specific truck (Figure 2).
Differences between the two groups were tested for statistical significance with a t-test at the p<0.005 level.
Figure 2. An example showing the perimeter of the total annual operating area (outer polygon) and the main operating area (inner polygon) when calculated as minimum convex polygons. The small bordered areas are the administrative units (municipalities) containing forest destinations (loading sites). The black dots represent the exact location of mill destinations (unloading sites).
RESULTS
The average number of operating days for all the vehicles over a whole year was 19.4 days per month. An examination of the monthly averages (Table 2) shows the highest numbers was in March and the lowest number in July (summer holidays). The average was 19.47 for trucks with MDS and 19.25 for trucks without MDS, however, this difference was not statistically significant.
Table 2: The average number of operating days per month for trucks with and without MDS support.
| operating days/month | ||||||||||||
| Mar | Apr | May | Jun | Jul | Aug | Sep | Oct | Nov | Dec | Jan | Feb | |
| without MDS | 24.7 | 19.1 | 21.0 | 19.7 | 7.7 | 19.9 | 17.7 | 20.5 | 20.0 | 17.5 | 21.7 | 20.8 |
| with MDS | 23.8 | 19.3 | 23.2 | 20.9 | 6.5 | 19.5 | 20.2 | 19.7 | 21.1 | 18.6 | 21.4 | 19.6 |
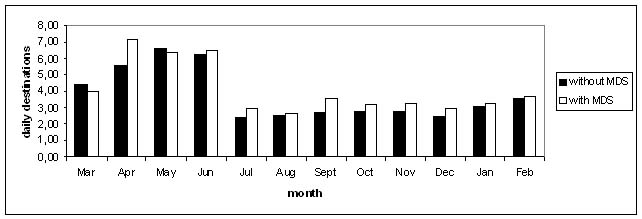
The average number of separate forest destinations per day where round wood was loaded was 4.13 and 3.70 for trucks with and without MDS support, respectively. While this difference was not found to be statistically significant, the monthly averages were higher for MDS-equipped trucks for all months except March and May (Figure 3).
Figure 3. The average number of daily forest destinations (separate loading sites) for each month for trucks with and without MDS support.

Display large image of Figure 3
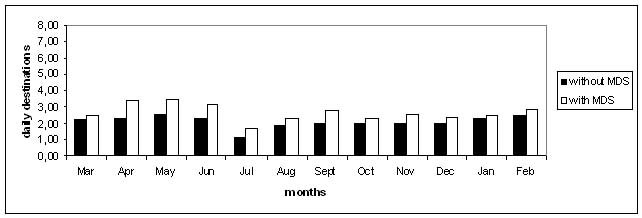
The average number of separate mill destinations (unloading points) per day was 2.66 and 2.17 for trucks with and without MDS support, respectively. This difference was found to be statistically significant. The monthly averages show that these were higher for MDS-equipped trucks in 12 of 12 months (Figure 4).
Figure 4. The average number of daily mill destinations (separate unloading sites) for each month for trucks with and without MDS support.

Display large image of Figure 4
Figure 5. The sizes of the annual operating area (km2 on the y-axis) for each of the trucks without MDS support in the study (truck id number on x-axis). The main operating area is indicated by the white portion of the bar.
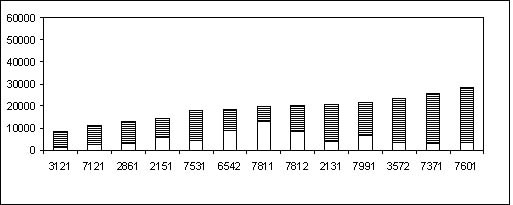
Figure 6. The sizes of the annual operating area (km2 on the y-axis) for each of the trucks with MDS support in the study (truck id number on the x-axis). The main operating area is indicated by the white portion of the bar.
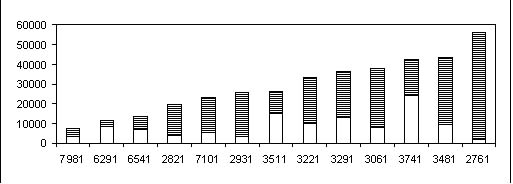
The average operating area (calculated as minimum convex polygon for the entire study period) for trucks with and without MDS was 29,050 and 18,656 km2, respectively. The main operating area represented 35.3 and 28.2 % of the total operating area for trucks with and without MDS support, respectively. The main and total operating areas for each truck type are shown in Figures 5 and 6. The differences in operating areas between trucks with and without MDS were not statistically significant when tested at the p<0.005 level. A second test at a p<0.05 level, however, showed these difference to be significant.
DISCUSSION
The study shows a considerable variation in transport patterns. This variation, however, is primarily a result of seasonal factors. The number of forest destinations visited per day, for example, is linked primarily to seasonal harvesting volumes. This study confirms that the number of forest destinations is notably higher from January to June when winter harvesting is complete and volumes become available at roadside. The composition of volumes from different sources is also an important factor. Non-industrial private forest owners (NIPF) have smaller operations where often two and up to six supply nodes must be visited to accumulate a full load. In contrast, integrated forest companies generally have large harvesting operations where whole loads can be picked up at a single node. While forest companies harvest year-round, NIPF harvesting is highest during the winter. This causes a decrease in average volume per supply node and an increase in number of forest destinations. A high proportion of NIPF deliveries for trucks without MDS would explain the higher number of forest destinations in March and May for these trucks. The same logic suggests that a low proportion of deliveries from private forest ownerships for trucks with MDS, would be most visible during the transport of winter-harvested wood.
Some other variables may be calculated in order to make the results more tangible. Converting the operating areas to equivalent circle, for example, can give us the diameter or maximum travel distance between forest and mill. For trucks without MDS the equivalent diameter for the main operating areas is 81 km (Table 3) which is quite close to the average transport distance for round wood in Sweden (75-80 km). The equivalent diameter for trucks with MDS is approximately 30 % larger (106 km). If we accept the assumption that the size of the operating areas increases with the average transport distance from forest to mill we can also infer that the trucks with MDS are delivering to mills with longer average distances and higher annual round wood consumption.
Another interesting variable is the density of loading points. The annual sum of forest destinations per 100 km2 (Table 3) shows that the concentration of visited supply nodes within the main operating area for trucks without MDS (16.3) is almost twice as high as for trucks with MDS (9.4).
Table 3: Some extra indicators of the transport patterns for trucks with and without MDS.
| without MDS | with MDS | |
| Diameter of main operating area | 81 km | 106 km |
| Annual no. forest destinations visited per 100 km2 | 16.3 | 9.4 |
These basic differences would indicate that those trucks not selected for MDS installation have their operations focused within a smaller and more familiar territory. The spatial variation in transport is therefore greater for trucks with MDS.
The observed differences in transport patterns between the two groups may have two alternative explanations. The simplest explanation is that trucks operating over larger areas have a greater need for navigation support. These trucks have a more complex planning situation, motivating the investment in MDS to improve efficiency for both operators and planning staff. An alternative explanation for the different patterns is that investment in MDS-support actually enabled a higher frequency of ordering to unfamiliar nodes. A combination of these two explanations is the most realistic.
The direct time savings given by MDS navigation to operators is estimated by Svanberg [13] to between 60 and 80 hours per year. In the case of VSV Frakt AB, however, the investment decision was motivated primarily by increased efficiency in transport administration. Nilsson [10] reports that common criticisms of the round wood transport planning environment include slow information flow and low quality data on system status. According to Hulten and Bolin [4] these characteristics are synonymous with diminished operations control.
Internet-based system are now being developed that make it possible for operators to independently download their work assignments directly to the truck. Transport and scaling orders from the revised transport plan can also be made available in the same way. Automated reporting of pick-up and execution as well as revision of road and stock status to a central database is being developed. These improvements give the potential to accelerate the cycle of PEC processes, thereby enabling quicker response to system disturbance.
CONCLUSIONS
Trucks with MDS support were found to visit a higher number of forest and mill destinations per day than trucks without. They were also found to have larger annual operating areas. While trucks without MDS had smaller operating areas, these areas had a higher density of forest destinations. Operators without MDS support were therefore concentrating operations on smaller areas where they were more familiar.
Under Swedish conditions, the most suitable investment opportunities for MDS support are trucks which already have large operating areas and complex planning situations. MDS navigation support gives these trucks the opportunity to further enlarge their operating areas. MDS information and communication functions make it easier for fleet managers to distribute new transport orders to these trucks.
AUTHOR CONTACT
Dag Fjeld can be reached by e-mail at --
Dag.Fjeld@ssko.slu.se
REFERENCES
[1] Bowersox D. and P. Daugherty 1995. Logistics paradigms. The impact of information technology. Journal of Business logistics.16(1):66-80.
[2] Carlsson, D. and M. Rönnqvist. 1999. Wood flow problems in Swedish forestry, SkogForsk Report No. 1, Uppsala. 49 pp.
[3] Heywood, I., S. Cornelius and S.Carver. 1998. An Introduction to Geographical Information Systems, Longman, USA. 279 pp.
[4] Hulten, L. and H. Bolin. 2002. Information exchange and controllability in logistics. Working paper - Transport Research Institute, Stockholm. 17 pp.
[5] Isaksson, J 2001. Generering av effektiva returflöden och kostnadsdelning i skogsindustrin [Generation of efficient backhaulage tours and cost allocation in forestry]. MSc thesis. LiTH-MAT-EX-2001-05. 44p.
[6] Johansson S 1997. Operativ styring av virkesflödet år 2000+ [Operative control of wood flow], SkogForsk Resultat 12, Uppsala. 4 pp.
[7] Karanta, I., O. Jokinen, T. Mikkola, J. Savola and C.Bounsaythip. 2000. Requirements for a vehicle routing and scheduling system in timber transport. In: Sjöström, K. [Ed]. 2000. Logistics in the forest sector. Timber Logistics Club. Helsinki.pp: 235-251.
[8] Lehtonen, J.-M. 1999. Supply chain development in process industry. Acta Polytechnica Scandinavica IM No. 4. 89 pp.
[9] Linnainmaa, S, J. Savola, and O. Jokinen. 1994. EPO A knowledge base system for wood procurement management. In: Aikin, J. and H. Shrobe (Eds.) Proceedings from the 7th Annual Conference on Artificial Intelligence, Montreal (1995). pp. 107-113.
[10] Nilsson, B. (in press). An analysis of information flow and functionality requirements in Swedish round wood transport. MSc thesis, Swedish University of Agricultural Sciences, Inst. F. Skogsskötsel, Umeå.
[11] Palmgren, M. 2001. An approach to log truck scheduling. In: Palmgren, M. and M. Rönnqvist [Eds.]. Logistik och optimering inom skogsindustrin. [Logistics and optimization in the Forest Industry] Workshop Åre 11-14 mars 2001. LiTH-MAT-R-2001-16: pp. 95-106.
[12] Skoog, E. 2000. Leveransprecision och ledtider - två nyckeltall för styrning av virkesflödet [Delivery precision and lead times for control of wood flow]. MSc thesis. Swedish University of Agricultural Sciences, Inst. f. skoglig resurshushållning och geomatik, Umeå. Arbetsrapport nr. 72, 2000. 97 pp.
[13] Svanberg, P. 2000. Nyttan av fordonsdatorer för kommunikation och navigering vid rundvirkestransporter [Advantages of mobile PCs for roundwood transport]. MSc thesis, Swedish University of Agricultural Sciences. Inst. f. skogsskötsel, Umeå Studentuppsatser nr 33, 2000. 41 pp.