 (1)
(1)Vol. 15 No. 1 January 2004
Juho Rantala
Finnish Forest Research Institute
Suonenjoki, Finland
The author is a Researcher at the Suonenjoki Research Station, Finnish Forest Research Institute.
ABSTRACT
In this paper, the applicability of linear programming (LP) in management of seedling transportation was compared to that of mixed integer programming (MIP). In the LP model, presented in an earlier paper, a linear objective function was used as a surrogate for the actual objective function, which is intrinsically nonlinear. In the LP model, transportation costs were determined per seedling, whereas in the MIP model they were based on vehicle loads. When the number of transported seedlings within a certain period decreased, for instance, due to planting through the growth period, the computational accuracy of the LP model was clearly lower than that of the MIP model. Despite that, differences in allocation of orders between these two models were small. Thus, in the actual business situation of Finnish nursery companies, standard LP seems to be an adequate tool for management of seedling transportation. From the standpoint of cost-efficient seedling business, planting through the growth period increased optimal transportation costs markedly. In addition to the seedling business, these results can be utilized in other types of business dealing with analogous transportation problems.
Keywords: nursery, transportation optimization, mixed integer programming, linear programming, Finland.
INTRODUCTION
In Finland the forest nursery business has undergone huge changes during the last decade, and nursery companies are presently getting used to a new business situation. Companies have been privatized, domestic competition has increased and the seedling business has become more international. In addition, changes in legislation concerning the seedling trade have changed the role of middlemen, for instance, forest owners' associations (FOAs), making them more responsible to the end-users for the quality of seedlings. Therefore, the middlemen are at present more clearly the real customers of nursery companies. Therefore, in this study, the word "customer" refers to middlemen. At the same time, the number of nursery units has decreased, which has emphasized the importance of transportation as a part of the seedling business. In the future, general use of planting through the growth period (PTGP) might change customers' requirements, in particular, for seedling delivery activities. One possibility for nursery companies to respond to customers' requirements, and at the same time operate more cost-effectively, is to develop more advanced systems of transportation management.
According to recent studies, costs for seedling transportation could be lowered markedly by utilization of mathematical programming [10]. To study the effects of centralized transportation planning on transportation costs, Rantala et al. [10] applied standard linear programming (LP). In the LP model, transportation costs were calculated per seedling and based on the assumption of full vehicle loads. The advantages of LP are, for instance, short and fairly predictable solution times. LP as a method has proved to be practical especially as a tool for strategic and tactical level planning of transportation [9]. Nevertheless, for the problem examined in the earlier paper by Rantala et al. [10], it is likely that the accuracy of LP will deteriorate when the total number of transported seedlings is small compared to the capacities of the transportation vehicles. This is due to the fact that a linear objective function was used in the formulation as a surrogate for the actual objective function, which is intrinsically nonlinear because it involves both fixed and variable costs. When the applicability of different optimization methods to the optimization of seedling transportation was prefigured, a few aspects were considered, in particular, how long the transportation distances will be, what the transportation costs of fractional vehicle loads are compared to those of full loads and what are the sizes of seedling orders in proportion to the capacities of transportation vehicles. Here, to evaluate the applicability of LP by constructing an actual model for management of seedling transportation, integer programming (IP) is introduced. In the field of forest technology, IP has previously been used, for instance, in modeling the optimal use of log-stacking lift trucks at wood terminals [4]. Mikkonen [8] introduced mixed integer programming (MIP), an adaptation of IP, as a tool for choosing harvesting systems.
Mathematical optimization problems, which include integer restrictions, are usually difficult to solve and require a huge computing capacity and much time. With IP models, formulation is crucial in determining whether the problem is solvable, and what the solution time will be[6, 11]. Other important factors affecting solvability of the MIP problem and time required for finding the optimal solution are the type of software used and the options applied in simplifying and thereby accelerating the solution procedure [1]. Usually success in MIP relies on the use of specialized MIP software rather than generalized IP software. IP models can be classified according to the types of variables; in pure integer programming, all variables are restricted to integer values; and in a MIP formulation, certain variables are integers, whereas the rest are allowed to be continuous. Another classification criterion is the number of integer values allowed for single variables; binary (0/1) restrictions are used to indicate whether something happens or not, whereas general integer restrictions allow all integer values that are in a feasible solution area [11]. The MIP model introduced in this study included only general form integer restrictions. There are two general approaches for solving IPs: "cutting plane" methods and the "branch-and-bound" (B&B) method. The B&B has thus far proven to be the most reliable; and most commercial IP codes use it, but aided by some cutting plane features. In the most general terms, B&B is a form of intelligent enumeration [3, 11].
From the standpoint of cost-efficiency, one of the most important prerequisites for mechanized planting is good utilization rate of planting machines. This necessitates planting through the growth period (PTGP), which in Finnish growing conditions means about a half-year time frame. According to recent studies, biological preconditions for PTGP exist; and seedlings planted during the growth period have succeeded even better than seedlings planted traditionally before the growth period [7]. The most important effect caused by longer planting period on seedling transportation is that whole orders of seedlings cannot be delivered to customers at the same time. Including a time factor in transportation planning models is characteristic for dynamic LP (DLP) applications [2]. Nevertheless, modes of business, also in seedling production, have gone step by step towards customer-oriented supply chain management. Typically, in a customer-oriented business, seedling orders should be delivered to customers (middlemen) during the predetermined time period to enable the customers' success in the further delivery of seedlings and in the organization of planting work. For that reason, transportation periods are assumed to be independent of each other; in this paper, seedling delivery is not modeled as a dynamic problem.
The aim of this study was to ascertain the applicability of LP and MIP methods for planning of seedling transportation in various business situations. The dimensions of the production strategies of a nursery company are included in terms of the number of nursery units and by dividing transportation into different numbers of time periods. Therefore, the effects of PTGP on transportation costs are also quantified.
MATERIALS AND METHODS
This study was made with the spatial and numerical data used by Rantala et al. [10]. The geographical material consisted of the main marketing area of a Finnish nursery company (ca. 96,000 km2). The company produced five different types of seedlings in five nursery units; all seedling types were produced in every nursery unit. The total number of seedlings included in analyses was 23,850,000, which was about 80% of the company's production. The transportation network connecting these 5 nurseries with their 51 customers consisted of a database of the Finnish main roads. In addition to these five units owned by the company studied, seven nursery units owned by competing nursery companies were located in the area. Customers located closer than 30 km to any of these 12 nurseries were supposed to pick up their seedlings themselves rather than having them delivered. Thus, all 51 customers included in analyses were located farther than 30 km from any nursery unit. Spatial data were managed by a geographical information system (GIS).
In experiments where transportation was divided into a certain number of periods, the rule of home-territory was used. The home-territory was a circular area of 100 km radius around each nursery unit of the company studied. Customers located in the home-territories (30 - 100 km from each nursery) were included in the analyses, so that each nursery always transported seedlings that ended up in its home-territory. The total number of customers located in the home-territories was 19, from which 3 were concurrently located in the home-territories of two nursery units. Seedling orders of these three customers were allocated optimally between the nurseries in whose home-territories they were located. The reason for the rule of home-territory was twofold; firstly, it imitated practice by allowing customers located near nurseries to do business with familiar nursery personnel; and secondly, it speeded up calculation of the MIP model.
Based on their good cost-efficiency in long-distance seedling transportation, the vehicles studied were a truck with a trailer and a pick-up truck [10]. The transportation capacity of each load of a truck with a trailer was 2.5 times more than the corresponding capacity of a pick-up truck. Terminal cost for a truck with a trailer was 1.95 times, fixed cost 4.38 times and variable cost 1.19 times higher than the corresponding costs for a pick-up truck. Terminal cost represents the cost of activities related to loading seedlings for transportation in the nurseries and unloading them at the intermediate storage places. Fixed costs, on the other hand, are the non-variable costs of ownership for the transportation vehicles. A variable cost is the constant cost-coefficient for a certain distance unit transported by a certain vehicle.
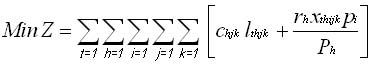
To compare the applicability of MIP and LP to optimization of seedling transportation in various business situations, the MIP model was built. The LP model studied is presented in more detail in [10]. The main difference between the models was that in the LP model the optimal transportation cost was a multiple of the theoretical cost per seedling, whereas in the MIP model the cost-effects of fractional vehicle loads were taken into account by adding integer restrictions for the number of vehicle loads transported. In addition, in the MIP model the terminal costs were assumed to increase linearly as a function of the used transportation capacity, which can be seen in the latter part of the objective function (Eq. 1). The first part of the objective function calculates transportation costs for transporting an empty vehicle load on a certain transportation route. Actually, the LP model [10] is a special case of this MIP model; in the LP model the ratio between the sum of the space requirement for all seedlings in a certain vehicle load and the commensurate transportation capacity of the vehicle always equals 1. The MIP model was formulated as follows:
Objective function - minimize the total variable and fixed costs of all vehicle loads plus the sum of terminal costs associated with all vehicle loads (Eq. 1),
(1)
Subject to,
Non-negativity of continuous variables (Eq. 2)
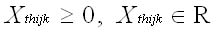 (2)
(2)
Non-negativity of discrete (integer) variables (Eq. 3)
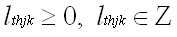 (3)
(3)
Total commensurate vehicle capacity must at least equal the space required by all seedlings transported (Eq. 4),
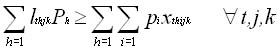 (4)
(4)
Total quantity of seedlings delivered must equal total seedling demand (Eq. 5),
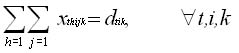 (5)
(5)
The total quantity of seedlings delivered must not exceed the total number of seedlings produced (Eq. 6),
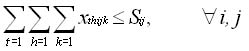 (6)
(6)
Where,
t refers to the transportation period
h refers to the transportation vehicle
i refers to the seedling type
j refers to the nursery unit
k refers to the customer
Z = total transportation costs of the nursery company
chjk = full-load transportation cost without terminal
cost from nursery j to customer k by vehicle h
lthjk = number of loads transported from nursery j
to customer k by vehicle h during transportation period t
Ph = commensurate transportation capacity for
vehicle h
pi = space requirement coefficient for seedling type i
xthijk = number of seedling type i transported from
nursery j to customer k during transportation period t
by vehicle h
rh = full-load terminal cost for vehicle h
dtik = demand for seedling type i by customer k
during transportation period t
Sij = production capacity of seedling type i in
nursery unit j
fh = fixed cost per load for vehicle h
sjk = distance from nursery j to customer k
vh = variable costs per unit of distance for vehicle h
Transportation cost chjk consisted of fixed fh and variable vh costs (Eq. 7).
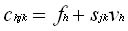 (7)
(7)
While the distance sjk between nursery unit j and customer k was less than 100 km, customer k was assigned to nursery unit j according to the rule of home-territory. In this situation all seedlings to customer k were supplied by nursery unit j. Mostly for reasons of computational heaviness, the production-capacity restriction (Eq. 6) is not included in the MIP solutions, except for those dealing with the effects of linearization. When the production-capacity restriction (Eq. 6) was ignored, the production capacity of each nursery was determined by the total demand assigned to that nursery unit in the optimal solution.
The accuracy of the LP model deteriorates whenever the optimal solution includes such a number of seedlings for a certain transportation route that cannot fit exactly into full vehicle loads. While the number of transportation routes remains constant, a decrease in the total number of seedlings delivered will decrease the average number of seedlings transported per transportation route. The smaller the number of seedlings transported per transportation route is, the larger the relative difference in the unit cost per seedling between the LP and MIP models can be. These effects can be illustrated by examining the worst possible solution for the MIP model: Let the number of seedlings transported to m customers be N. The average number of transported vehicle loads per transportation route is denoted by a, and L is the transportation capacity for vehicle h. At first, N can be determined as follows (Eq. 8):
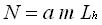 (8)
(8)
The worst solution for the MIP model will be achieved by transporting one seedling to m-1 customers and the rest of the seedlings to customer k. The Ceiling function rounds a number up to the nearest integer. Taking Eq. 8 into account, the highest transportation unit cost uhjk can be stated as follows (Eq. 9):
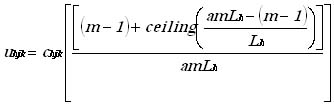 (9)
(9)
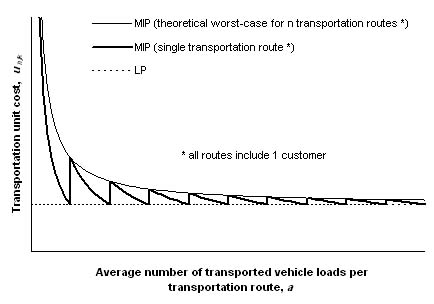
Determination of the transportation unit costs of the MIP model according to Eq. 9 is presented in Figure 1, which also illustrates the principal difference between the LP and MIP models. In both models, the terminal unit costs were the same for all seedling types.
Figure 1. Principal unit cost functions for the LP and MIP models for a single transportation route and the theoretical worst solution function for n transportation routes optimized with the MIP model.
It can be assumed that planting through the growth period (PTGP) will become more general in the future. In such a situation, transportation of seedlings would have to be divided into a certain number of periods. Here, optimization experiments were carried out to quantify the effects of PTGP on the transportation costs of a nursery company. In these experiments, seedlings were transported in 1, 3 and 5 periods in the business situations of 1, 3 and 5 nursery units. Transportation was divided into 5 periods only in the case of 3 nursery units. Criteria for allocating transportation among different periods, which reflects a possible situation in the near future, were based on recent studies [5, 7] and on the opinions of professional seedling producers. In the three-period model solution, between 16% and 53% of the total number of seedlings were transported per period, whereas in the five-period model solution between 8% and 39% of all seedlings were transported per period (Table 1).
Table 1: Proportion of seedlings transported per period, expressed as a percentage of total annual seedling orders, in the one-period, three-period and five-period model solutions.
| Number of transportation periods | Period 1 | Period 2 | Period 3 | Period 4 | Period 5 |
| 1 | 100 | - | - | - | - |
| 3 | 53 | 31 | 16 | - | |
| 5 | 39 | 21 | 19 | 13 | 8 |
All computations were performed with a What's Best! Industrial optimization solver [12] in a PC with 260 MB RAM and Pentium III processor running under Windows 2000 operating system.
RESULTS
Effects of linearization
The process of converting a nonlinear expression to a linear expression is called linearization. The actual MIP model was used to quantify the effect of linearization on the accuracy of the LP model results in the business situation of three identical nursery units. Choosing the situation of three nursery units was based on the actual decision of the company studied to focus their main invests in the future on these three units instead of on the current five units. First, all transportations were optimized with the LP model. These optimal seedling shipments from nurseries to customers were picked up from the solution of the LP model and set into the MIP model as delivery restrictions. Thus the seedling shipments delivered were the same in both models, and the solutions could be compared merely from the standpoint of authenticity of transportation costs. The only optimization carried out at this stage with the MIP model was the allocation of seedling shipments between different vehicle types. As a consequence of linearization of the objective function in the LP model, total transportation costs calculated with the MIP model, later used as an index value, were 4.1% higher than the corresponding costs of the LP model (Table 2).
Table 2: Effect of linearization on transportation costs in the LP model solution compared to those calculated with the MIP model with and without the home-territory restriction.
| Nursery unit j | 1 | 2 | 3 | Total | |
| LP model | 35.6 | 33.8 | 26.5 | 95.9 | Index |
| MIP model | 36.8 | 35.1 | 28.1 | 100.0 | Index |
| Total cost difference | -3.2 | -3.9 | -5.5 | -4.1 | % |
| LP (home-territories included) | 33.6 | 34.2 | 29.7 | 97.4 | Index |
| MIP (home-territories included) | 34.7 | 35.6 | 32.0 | 102.3 | Index |
| Total cost difference | -3.2 | -4.0 | -7.2 | -4.7 | % |
Experiments dealing with the effect of planting through the growth period (PTGP) on transportation costs of the nursery company, presented later, included the home-territory restriction. The effect of linearization on transportation costs in the LP model solution when the home-territory restriction was included is presented at the bottom of the Table 2.
Owing to longer total transportation distance, and due to relatively smaller terminal costs in the total transportation costs, the home-territory restriction increased the difference between the LP and MIP models slightly. The effect of the home-territory restriction on transportation costs of a single nursery unit depended mostly on its geographical location in relation to the destinations of the seedling orders. In this case, more customers were located in the home-territory of nursery 1 (7) than in the home-territories of nurseries 2 (4) and 3 (2). Thus, the transportation costs of nursery 1 decreased due to its central location, and the transportation costs of nurseries 2 and 3 increased (Table 3). The increase in transportation costs and also the difference between the LP and MIP models were greatest in the case of nursery 3 due to its outlying location.
Table 3:Effect of the home-territory restriction on transportation costs of a single nursery unit and on the total costs of the nursery company in the LP and MIP model solutions.
| Nursery unit j | 1 | 2 | 3 | Total | |
| LP model | -5.72 | 1.17 | 11.91 | 1.58 | % |
| MIP model | -5.69 | 1.24 | 13.94 | 2.25 | % |
The home-territory restriction reduced computing time considerably and, in some cases, was even crucial from the standpoint of solvability of the MIP model. For instance, optimization of seedling transportation in the production strategy of three nursery units with the MIP model took 10 h 41 min 5 sec without the home-territory restriction and 7 h 58 min 25 sec when home-territories were included. Due to their computational heaviness, each of the MIP model experiments was split into a few parts. The experiments were split by dividing customers into smaller groups and solving the transportation of one group at a time. Thus, restrictions on production capacities of nursery units could not be controlled during computation of the MIP model; and after the experiments presented above, these restrictions were excluded from both models.
Differences in optimal solutions of the models
At this stage, seedling transportation of the company studied was optimized with the LP and MIP models and the solutions were compared to each other. These experiments were done with the home-territory restriction but without the restriction on production capacities of nursery units. The effects of the home-territory restriction on solutions of the LP model naturally disappeared when the nursery-capacity restrictions were removed; optimal transportation performance of the LP model was based on the shortest possible total transportation distance of the nursery company. The main result of the comparison between the solutions of the models was that differences in allocation of orders among nursery units occurred only in the case of the current 5 nursery units. In the production strategies of fewer nursery units, the optimal solution was exactly the same in both models. Still, the effect of the number of nursery units on transportation costs, and on the cost difference between the solutions of the models was analyzed (Table 4).
Table 4:Effect of the number of nursery units on total transportation costs and on the cost differences between the LP and MIP models when home-territory restriction was included. Comparison values are denoted by "-".
| Number of nursery units | Optimization method | Cost difference (%) | *Cost index |
| 1 | LP | -3.86 | 105.7 |
| 1 | MIP | - | 109.9 |
| 3 | LP | -3.02 | 91.2 |
| 3 | MIP | - | 94.1 |
| 5 | LP | -2.72 | 83.4 |
| 5 | MIP | - | 85.7 |
* Index scale is the same as in Table 2.
As would be expected, transportation costs increased when the number of nursery units decreased. The differences in transportation costs between the solutions of the LP and MIP models were 2.72 - 3.86%, depending on the number of nurseries. The difference increased when the number of nurseries decreased. Two reasons for this were the relatively smaller proportion of terminal costs in the total transportation costs and longer transportation distance also for fractional vehicle loads in the production strategies with fewer nurseries. In this context, the relative difference between the models was also evaluated from the standpoint of optimal allocation of transportation among different vehicles. With this material, all transportation in the LP model solution was carried out by a truck with a trailer. To study the effects of vehicle allocation on transportation costs and on cost difference between the models, an experiment where all seedlings were transported by a truck with a trailer was also carried out with the MIP model. This experiment showed that, without taking into account the possibility to deliver smaller seedling shipments by pick-up truck, the relative difference in costs between the model solutions would be about 2% higher. Restrictions on the production capacities of nurseries were excluded from Table 4 but were included in Table 2. Thus, the effect of a restriction on production capacity can also be estimated. It is obvious that the total transportation cost is higher whenever any restriction on the production capacities comes true.
In this case, the restrictions on production capacities raised the total cost optimum by 6.8% when the LP model was used and 8.7% when the MIP model was applied.
In this context, weakening of the accuracy of optimal transportation costs in the LP model solution due to smaller number of seedlings included in optimization was studied by comparing it to the solutions of the actual MIP model. These experiments were carried out in the business situation of three nursery units. As can be seen in Table 5, the accuracy of the LP model clearly deteriorated when the number of seedlings included in optimization decreased. The cost-effect of dividing transportation into a different number of periods, due to PTGP, for instance, is presented in more detail in the next section.
Table 5: Effect of the number of seedlings included in optimization on accuracy of the optimal transportation costs in the LP model solution.
| Number of transported seedlings | LP (*cost index) | MIP (*cost index) | LP compared to MIP(%) |
| 23,850,000 | 91.2 | 94.1 | -3.02 % |
| 12,640,500 | 47.8 | 51.3 | -6.97 % |
| 7,393,500 | 29.2 | 33.5 | -12.93 % |
| 3,816,000 | 14.3 | 18.9 | -24.42 % |
* Index scale is the same as in Tables 2 and 4.
Cost effects of planting through the growth period
To explore the effects of PTGP on transportation costs, seven experiments were done with the MIP model. In these experiments, seedling orders were divided into transportation periods (Table 1) and optimized in various production strategies. Due to the computational heaviness of the MIP model, five-period model was solved only in the case of three nursery units. Total transportation costs in different business situations are presented in Table 6.
Table 6: Effects of the numbers of nurseries and transportation periods on transportation costs of the nursery company. Comparison values are denoted by "-".
| Number of nursery units | Number of transportation periods | Cost difference (%) | *Cost index | ||
| 1 | 1 | - | 109.9 | ||
| 1 | 3 | 11.77 | 122.9 | ||
| 3 | 1 | - | 94.1 | ||
| 3 | 3 | 10.30 | 103.8 | ||
| 3 | 5 | 19.26 | 112.2 | ||
| 5 | 1 | - | 85.7 | ||
| 5 | 3 | 9.15 | 93.6 | ||
* Index scale is the same as in Tables 2, 4 and 5.
Compared to the one-period model, the three-period model raised transportation costs by 9.2 - 11.8%, depending on the number of nursery units. The increase was slightly smaller in situations where the number of nurseries was larger. Correspondingly, the total transportation costs of the five-period model, which was applied only to the production strategy of three nursery units, were 19.3% higher than the total costs of the one-period model. The MIP model solutions included an optimal allocation of transportation between a truck with a trailer and a pick-up truck. The effects of different production strategies and number of transportation periods on the optimal utilization of these vehicles are presented in Table 7.
Table 7: Effects of the numbers of nurseries and transportation periods on allocation of transportation between a truck with a trailer and a pick-up truck.
| Number of nursery units | Number of transportation periods | Truck with a trailer | Pick-up truck |
| 1 | 1 | 96.02 % | 3.98 % |
| 1 | 3 | 86.95 % | 13.05 % |
| 3 | 1 | 95.70 % | 4.30 % |
| 3 | 3 | 84.06 % | 15.94 % |
| 3 | 5 | 77.01 % | 22.99 % |
| 5 | 1 | 94.13 % | 5.87 % |
| 5 | 3 | 78.36 % | 21.64 % |
As can be seen in Table 7, the proportion of seedlings transported by pick-up truck increased slightly when the number of nursery units increased. This was mostly due to shorter transportation distances between the nurseries and their customers. The optimal proportion of pick-up truck transportation increased more markedly when the number of transportation periods increased. This was mainly caused by the smaller number of seedlings transported per route. These effects were studied in more detail in the production situation of three nursery units (Table 8). In this case, transportation by pick-up truck increased drastically when the proportion of seedlings transported made up less than 10% of the total orders. In general, the smaller the number of seedlings transported, the higher were the costs and the larger was the proportion of seedlings transported by pick-up truck (Table 8, Figure 2).
Table 8: Effect of the number of seedlings transported within each single transportation period on periodic transportation costs and on optimal allocation of transportation between a truck with a trailer and a pick-up truck in the production strategy of three nursery units.
| Period | Number of transported seedlings | Proportion of total seedlings orders | Truck with a trailer | Pick-up truck | *Unit cost index |
| 1/1 | 23,850,000 | 100 % | 95.70 | 4.30 | 100.0 |
| 1/3 | 12,640,500 | 53 % | 89.65 | 10.35 | 101.7 |
| 2/3 | 7,393,500 | 31 % | 79.39 | 20.61 | 115.4 |
| 3/3 | 3,816,000 | 16 % | 73.93 | 26.07 | 130.2 |
| Total 1-3/3 | 23,850,000 | 100 % | 84.06 | 15.94 | 110.3 |
| 1/5 | 9,301,500 | 39 % | 85.2 | 14.8 | 102.9 |
| 2/5 | 5,008,500 | 21 % | 77.19 | 22.81 | 116.3 |
| 3/5 | 4,531,500 | 19 % | 74.11 | 25.89 | 121.6 |
| 4/5 | 3,100,500 | 13 % | 72.53 | 27.47 | 139.9 |
| 5/5 | 1,908,000 | 8 % | 52.00 | 48.00 | 165.1 |
| Total 1-5/5 | 23,850,000 | 100 % | 77.01 | 22.99 | 119.3 |
* Index is not comparable to previous indexes.
Figure 2. Effects of number of seedlings transported within a single transportation period on transportation unit costs.
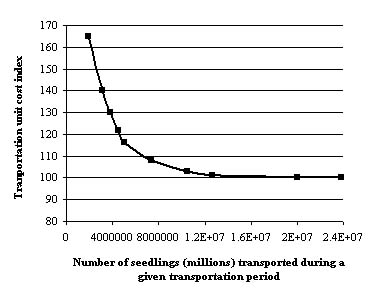
From Figure 2 it can be seen that as the number of seedlings transported during a certain period decreased, transportation unit costs increased exponentially. The increase in transportation unit costs seems to be very slight until the number of transported seedlings decreases to less than 12,000,000; from then on, the increase in costs is strongly accelerated. Transporting 3,100,500 seedlings (8% of the total annual demand), for instance, was about 1.4 times more expensive than transporting whole orders (23,850,000) during the same period. Naturally, the increase in costs varied among individual customer orders. Thus, Table 8 and Figure 2 are based on average-cost values of the material used in this study.
DISCUSSION
In the MIP model, the unused transportation capacity of each load decreased the total transportation costs in accordance with lower terminal costs. This assumption was based on the views of nursery managers, truck drivers and the author's observations of vehicle loading and unloading. In general, the terminal costs for full-vehicle loads were about one third of all transportation costs. In theory, due to less total time required for vehicle operation per load, fixed costs should also become slightly lower when the number of seedlings per load decreases. Nevertheless, that decrease in fixed costs is rather theoretical and here it was ignored. Therefore the fixed costs of vehicles were considered to be constant.The relative difference in transportation costs between the solutions of LP and MIP models was slightly larger when the number of nurseries decreased. This was mainly due to longer transportation distances in the production strategies with fewer nurseries. On the other hand, of the total transportation costs the proportion of terminal costs was relatively smaller; and furthermore, transportation costs for seedlings transported in fractional vehicle loads may considerably increase the average unit cost for transportation. In practice, an important advantage of using the MIP model instead of the LP model might be the MIP model's ability to help operator avoid fractional loads that include only a few seedlings.
Despite the slightly greater difference between the LP and MIP model solutions in terms of transportation costs, the accuracy of the LP model improved when the number of nurseries decreased. In practice, the real advantage of MIP compared to LP appears when the optimal allocation of seedling orders among nurseries differs between the models. In the production strategy of five nursery units, which is the current strategy of the company studied, there were some differences in allocation of orders between two of the five nursery units, whereas the rest parts of the optimal solutions were the same. Altogether, these differences were not very great. From the standpoint of order allocation, in the production strategy of three nursery units, the minimum cost solutions of the models compared were exactly the same. Thus, the solutions would also be the same in cases of less than three nursery units. Therefore, it seems that the current geographical density of the Finnish nursery units owned by the same large-scale company is close to the limit from which (to more sparsely located nurseries) no additional value can be reached by applying MIP to management of seedling transportation instead of LP. Taking into account the fact that in Finland development seems to be going towards larger and more sparsely located nursery units, LP seems to be the most workable method for management of seedling transportation. In a theoretical situation, where the same company would own more nurseries in the area studied, the density of nurseries might be high enough to obtain a real advantage from utilization of the MIP model rather than the LP model.
With the PC and optimization solver used here, the LP model computed markedly faster than the MIP model did. While computing time for LP was only a few seconds, MIP took hours, even though the problems were computed in parts. In addition, splitting the calculation of the MIP model into parts made it impossible to control certain restrictions during calculation. For that reason, after evaluation of the effects of linearization on the differences in transportation costs between the LP and MIP model solutions, restrictions on production capacity were omitted from both models. Thus, other results described the situation where the optimal seedling shipments were not restricted by production capacities. Therefore, all nurseries were thought to be able to respond to seedling demand in accordance with optimized transportation plan. In practice, not all seedling production could be included in transportation optimization, and sufficient numbers of seedlings would be left as a buffer storage for orders coming after optimization and transported outside of the optimized transportation plan. Another reason for excluding a certain part of the seedlings from the optimization could be the nursery company's wish to carry out internal transactions between nursery units. The latter reason, in particular, might increase total transportation costs but could be reasonable, for instance, from the standpoint of production cost-effectiveness.
According to this study, the LP model introduced by Rantala et al. [10] is an appropriate tool for planning seedling transportation. The main prerequisite for successful use of the LP model is a relatively large number of seedlings transported within the same time period. In this study, the greatest weakness of the MIP model was the huge time required to obtain a solution. The need for solution time rose exponentially as the number of integer variables increased. The computational difficulty of MIPs is well known. Here it should be noted that the software [12] used was not specialized for solving MIP problems. In general, solution times for MIPs are more reasonable when specialized software, with an appropriate combination of features simplifying the solution procedure, is applied [1]. The procedure can be simplified, for instance, by accepting a tolerance of variation from the true integer optimal solution. Nevertheless, any simplification was not used in this study. With the PC environment used in this study, the MIP model seems to be an appropriate tool for smaller, operative level, optimization problems such as seedling transportation of a single nursery unit or a single transportation period. In addition, the MIP model can be applied successfully to optimization problems where the feasible solution area is carefully restricted, such as allocation of optimal seedling shipments in the LP model solution among different transportation vehicles. Altogether, the size of the MIP problem should not be expanded too much in practical use.
In context of exploring the effects of PTGP on transportation costs with the MIP model, the dynamics of transportation periods was included only in terms of restrictions related to periodical seedling demand; the model itself was not dynamic. The reason for this was the assumption of customer-oriented management of supply chain by the nursery company. Taking into account the whole delivery chain, including intermediate storage places to planting areas, an important quality factor affecting customer satisfaction is just-on-time delivery of seedlings. This means that delivery schedules for each transportation period are predetermined according to customers' requirements. In the seedling business, timing is crucial, in particular from the standpoints of keeping up good quality of seedlings during delivery and successful organization of the planting work. Transportation periods were assumed to be independent of each other, implying that the period in which seedling shipments occur has no effect on transportation costs. In practice, failures occurring in previous transportation periods could naturally affect the number of seedlings included in transportation optimization of subsequent periods.
The crucial factor in terms of transportation costs (Table 8, Figure 2) and accuracy of the LP model (Table 5) was the number of seedlings transported within a certain time period. Cost effects caused by PTGP on transportation costs were studied with the MIP model because of the low accuracy of the LP model in transportation problems with relatively small numbers of seedlings in proportion to the capacities of the transportation vehicles. Compared to results from one-period model, transportation costs were about 10% higher when seedlings were transported during three time periods and about 20% higher when transportation was divided among five periods. Mathematical modeling of seedling transportation is not currently used in Finnish nurseries. Thus, these results are still rather theoretical and hardly correspond to the practical effects of PTGP on transportation costs. Nevertheless, it can be assumed that the increase in transportation costs caused by PTGP would be even larger without careful planning of transportation. The number of transportation periods needed depends mainly on the organization of intermediate storage for seedlings. In the case of centralized storage, three transportation periods might be enough; but in the current situation with unclear organization and fuzzy responsibilities, at least five periods might be needed to guarantee good quality of seedlings. PTGP, and in particular, mechanized planting, involves many logistical challenges but also possibilities. For instance, an entrepreneur working with a planting machine could take care of centralized intermediate storage of seedlings, which would make it possible to cut out some existing but unnecessary logistical stages.
Neither the LP nor the MIP model takes into account the routing possibilities of customer locations. Nevertheless, the numbers of seedlings transported between nurseries and intermediate storage places are rarely smaller than a vehicle load. In theory, the last seedlings of different orders could be combined into the same vehicle load and routed optimally. In practice, larger intermediate storage places, also used in this study, are so far away from each other that routing might not be more cost-effective than single transportation to every intermediate storage place. Further, in this paper, seedling delivery from intermediate storage places to regeneration areas was not included in optimization experiments; intermediate storage place is a natural interface between the operations managed by a nursery company and its customers.
AUTHOR CONTACT
Mr. Rantala can be reached by e-mail at --
juho.rantala@metla.fi
REFERENCES
[1] Bixby, R. E., M. Fenelon, Z. Gu, E. Rothberg and R. Wunderling. 2000. MIP: Theory and Practice - Closing the Gap. In: M. J. D. Powell and S. Scholtes (eds.). System Modelling and Optimization: Methods, Theory and Applications. Kluwer. 31 pp.
[2] Dykstra, D. P. 1984. Mathematical Programming for Natural Resource Management. McGraw-Hill Inc., New York. 318 pp.
[3] Hartley, R. 1985. Linear and Nonlinear Programming. Ellis Horwood Ltd., Chichester. 221 pp.
[4] Heinämäki, J. 1991. The Optimal Use of Log Stacking Lift Trucks at Wood Terminals. University of Helsinki, Department of Logging and Utilization of Forest Products, Research Papers 54. 114 pp.
[5] Helenius, P., J. Luoranen, R. Rikala and K. Leinonen. 2002. Effect of drought on growth and mortality of actively growing Norway spruce container seedlings planted in summer. Scandinavian Journal of Forest Research 17 (3): 218 - 224.
[6] Hillier, F.S. and G.J. Lieberman. 1974. Operations Research. Holden-Day, Inc., 800 pp.
[7] Luoranen, J. 2000. Control of Growth and Frost Hardening of Silver Birch Container Seedlings: Growth Retardants, Short Day Treatment and Summer Planting. The Finnish Forest Research Institute, Research Papers 777. 167 pp.
[8] Mikkonen, E. 1983. The Usefulness of Some Techniques of the Mathematical Programming as a Tool for the Choice of Timber Harvesting System. Acta Forestalia Fennica 183. 110 pp.
[9] Palander, T. 1998. Tactical Models of Wood-Procurement Teams for Geographically Decentralized Group Decision-Making. D.Sc. (Agr. And For.) Thesis. University of Joensuu, Faculty of Forestry. 49 pp.
[10] Rantala, J., N. Kiljunen and P. Harstela. 2003. Effect of Seedling Production and Long-distance Transportation Planning Strategies on Transportation Costs of a Nursery Company. International Journal of Forest Engineering 14(2): 65 - 73.
[11] Schrage, L. 1997. Optimization Modeling with Lindo. Thomson Publishing Inc. 470 pp.
[12] What's Best Manual. 2000. Lindo Systems, Inc. Chicago. 297 pp.