Vol. 15 No. 1 January 2004
Woodam Chung
University of Montana
Montana, USA
John Sessions
Oregon State University
Oregon, USA
Hans R. Heinimann
Swiss Federal Institute of Technology Zurich
Zurich, Switzerland
The authors are, respectively, Assistant Professor, Department of Forest Management, University of Montana; Professor, Department of Forest Engineering, Oregon State University; and Professor, Department of Forest and Wood Sciences, Swiss Federal Institute of Technology Zurich.
ABSTRACT
This paper describes a method for optimizing cable logging layouts using a heuristic network algorithm. A timber harvest unit layout is formulated as a network problem. Each grid cell containing timber volume to be harvested is identified as an individual entry node of the network. Mill locations or proposed timber exit locations are identified as destinations. Each origin will then be connected to one of the destinations through alternative links representing alternative cable corridors, harvesting equipment, landing locations, and truck road segments. A heuristic algorithm for network programming is used to solve the cost minimization network problem. A computerized model has been developed to implement the method. Logging feasibility and cost analysis modules are included in the model in order to evaluate the logging feasibility of alternative cable corridors and estimate yarding and transportation costs. The model was successfully applied to a harvest planning area to generate harvesting plans. This case study indicates that the planning method is best used for pre-planning since modeling assumptions with respect to tail spar availability and unconstrained road alignments may require modification of the plan before implementation.
Keywords: Forest operation planning, cable logging, forest road, modeling, optimization, network programming.
INTRODUCTION
Designing a timber harvest unit layout is one of the challenging tasks in forest operation planning. The task requires planners to identify logging equipment, landing sites, logging corridors, road locations, and hauling routes. Decisions on timber harvest operation planning are based on various considerations. These include terrain conditions, log location, timber volume, economic efficiency, and physical feasibility of the logging systems available. Furthermore, increased environmental concerns have brought additional considerations and requirements into harvest operation planning [15].
Traditionally, engineers have designed timber harvest layouts manually using topographic maps and simple functions of Geographic Information Systems (GIS). Although several computer programs have been developed to help engineers with road layout and payload analysis [10, 17], the task is still time consuming [9] and the increased environmental concerns make the operation planning processes more complicated. Identifying not only economically and environmentally "feasible" but also "good" timber harvest layouts becomes a challenging task. Systematic tools are essential for better and more efficient harvesting operation plans. Well-designed plans not only increase economic efficiency of forest operations, but perhaps more importantly, they also enhance work safety.
With the purpose of assisting planners in designing timber harvest layouts, various automated methods have been introduced. Dykstra [4, 5] developed a method to assist in the design of timber harvest cutting units and the assignment of logging equipment using a facilities location theory. PLANS (Preliminary Logging Analysis System), which was developed by the USDA Forest Service [18], has been used for developing timber harvest and road network plans based on large-scale topographic maps. PLANEX [7, 8] is able to generate an approximately optimal allocation of equipment and road network based on a heuristic algorithm. However, none of the above methods provide a complete analytic tool which is able to conduct ground profile analysis while simultaneously optimizing landing and road locations.
The method described in this paper will combine a cable logging equipment assignment problem with a road location problem and optimize both problems simultaneously, while incorporating modern computer software languages, Geographic Information Systems (GIS), and heuristic optimization techniques that have become available during the last two decades. The method evaluates alternative cable logging layouts based on the feasibility of the logging system and estimation of logging costs. A heuristic network algorithm is used as a solution technique. The method is implemented in a preliminary computerized model that is called CPLAN. The ultimate goal of this model is to assist forest planners in designing cable logging units by providing "feasible and good" alternative plans.
MODELING PROCEDURES
Developing an automated method for forest operational planning involves comprehensive modeling procedures. These procedures include evaluating logging feasibility through payload and ground profile analysis, estimating logging and transportation costs, formulating the cost minimization problem, solving the problem, and interpreting the solution. Each procedure is briefly introduced in this paper. Full descriptions have been documented by Chung [2].
Logging Feasibility Analysis
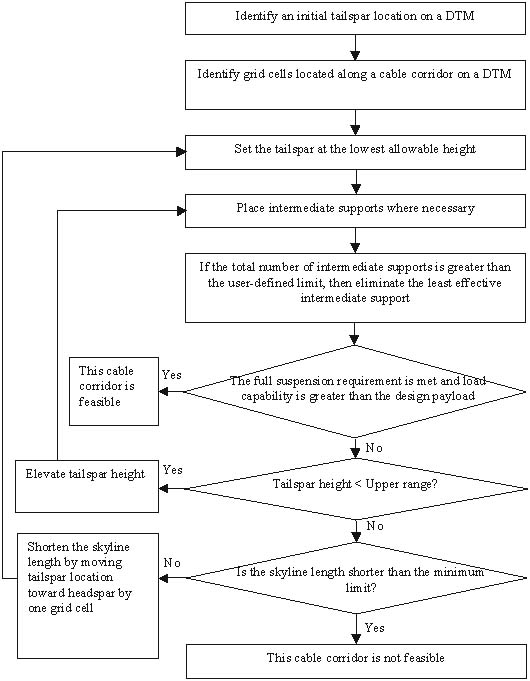
In this method, users specify alternative landing locations and a computer algorithm developed for this analysis projects 36 cable corridors at 10-degree intervals from each alternative landing. The algorithm then evaluates each of the projected cable corridors for its logging feasibility and searches for a feasible cable corridor configuration (Figure 1). Two evaluation criteria are used: the user-defined minimum payload per yarding cycle and the full suspension requirement over the riparian management areas. Each of the cable corridors has to meet both requirements in order to become a physically feasible candidate. A digital terrain model (DTM) is used to provide the topographic information along cable corridor profiles and a GIS stream coverage is used to identify riparian management areas where full suspension is required.
The computer algorithm determines the initial tailspar location of each cable corridor on a DTM using the maximum external yarding distance of the specified cable logging system with the assumption that adequate tailspar is available anywhere. The algorithm identifies the grid cells that are located along each cable corridor on the DTM. Each of these cable corridors is then evaluated for its logging feasibility for a specified cable yarding system and a specified ground profile. Currently the analysis is limited to standing skyline systems. The algorithm applies the Phase I procedure suggested by Brown and Sessions [1] to identify the maximum log load that can be carried along a given ground profile by a standing skyline system. The algorithm automatically places intermediate supports on convex terrain in order to ensure the minimum clearance of the skyline from the ground. The algorithm also allows the planners to input the available range of tailspar heights and searches for the minimum height satisfying the minimum payload per yarding cycle, which is referred to as the design payload in this paper.
Full suspension is often required over riparian management areas to protect vegetation and minimize disturbance to beds and banks of streams [12, 14]. If specified, the algorithm checks the log clearance when cable corridors cross the riparian management areas. Thus, if a cable corridor cannot produce enough payload per yarding cycle or satisfy the full suspension requirement, the current cable corridor configuration becomes infeasible and the algorithm searches for a new tailspar location along the corridor that satisfies both the minimum payload and full suspension requirements within the permissible tailspar heights and the allowed number of intermediate supports.
Cost Analysis
Cable logging and transportation costs are estimated in order to evaluate alternative timber paths. Logging and transportation costs are classified into two cost factors: variable and fixed costs. Variable cost is a function of timber volume, while fixed cost is a one-time cost regardless of timber volume. In this analysis, variable costs include felling, yarding, loading, and hauling costs, while fixed costs include road and landing construction, yarding equipment move-in, and cable corridor setup costs.
In order to estimate the yarding cost of a single turn of logs over a cable corridor, the location of the log pickup point and timber volume for a turn must be identified. This analysis requires a GIS layer that contains information on the volume and locations of individual trees to be harvested. For cases where only area-based timber volume data are available, a load building simulator has been developed to determine timber parcel locations, and log volume and pickup point for each parcel. The simulator starts by creating a GIS raster consisting of grid cells that contain harvestable timber volume data represented by each grid cell. It then sorts grid cells by volume in descending order. If the volume in a grid cell is greater than the user-defined design payload, the load building process is not necessary and the cell is assumed to be an individual timber parcel with the center of the grid cell set as the log pickup point. However, if a grid cell contains less volume than the user-defined design payload for a single turn, the simulator searches for logs in the adjacent grid cells and combines them. These combined cells then form an individual timber parcel and the log pickup point is assumed to be the center of the grid cell that contains the largest volume. Once all log parcel locations and the corresponding timber harvest volume at each parcel is identified, the number of turns from each parcel is determined based on the timber volume and the load capability of each of the eligible cable corridors that are reachable from the log pickup point.
Figure 1. The algorithm to determine the logging feasibility of a proposed cable corridor.
The yarding cycle time is estimated for a turn of logs from each log pickup point to each of the eligible candidate landings that can reach the log pickup point through the feasible cable corridors. The yarding cycle time is divided into 6 time components: outhaul, lateral outhaul, hook, lateral inhaul, inhaul, and unhook [6]. Each time component is independently estimated based on timber volume, yarding distance, and user-defined information such as lateral yarding speed, average outhaul speed, and average hook and unhook time per unit volume. This information can be input or changed based on the users' field experiences or existing time studies conducted on similar sites and stand conditions.
Finally, total yarding cost for a single turn of logs is estimated by applying the yarding system hourly cost to the yarding cycle time. The hourly cost of each yarding system includes machine owning and operating, and labor costs. Fixed costs for yarding operations are also estimated in this analysis. These include landing construction, yarding system move-in, initial yarder setup, and cable corridor setup costs.
Total transportation costs include road building and hauling costs. These are analyzed separately from the yarding costs in this analysis. Different road construction costs are applied to each of road segments as a function of ground slope and the user-defined unit costs. In this study, a road segment is defined as a link connecting two consecutive grid cells on a DTM. Road construction cost increases as ground slope increases due to an assumption that building a road on steep ground requires more earthwork and thus higher costs. Road cost also increases when a road crosses a stream. In this analysis, road construction costs are estimated using the construction cost per unit distance and the user-defined penalty factors. The road cost per unit distance is determined exogenously based on the road design standards and the user-defined penalty factors are applied to the unit cost in order to reflect the cost increase of building roads on steep ground or stream buffers. Hauling cost over each road segment is assumed to be proportional to timber volume and hauling distance. Hauling cost for unit volume per unit distance is determined exogenously by the user.
Problem Formulation
In order to examine all possible paths from each log pickup point to the destination, an entire network that implicitly considers all alternative timber paths needs to be built. Each log pickup point is identified as an individual entry node of the network. Mill locations or specified timber exit locations are identified as single or multiple destinations of the network. Each origin must then be connected to one of the destinations through alternative paths representing alternative cable corridors, harvesting equipment, landing locations, and road segments. Each path consists of a series of links representing logging activities and incurred variable costs (i.e. yarding and hauling costs) and fixed costs (i.e. landing and road construction costs) corresponding to each activity.
Figure 2 illustrates an example of a path from a log pickup point to the mill via one of the appropriate landings. Each link in the figure represents variable and fixed costs associated with corresponding harvesting activity. The path starts from the log location and moves to a landing over a cable corridor using a yarding system.
Figure 2. An example of a path from a log pickup point to the mill. Each link represents corresponding logging activity with variable and fixed costs for the activity.
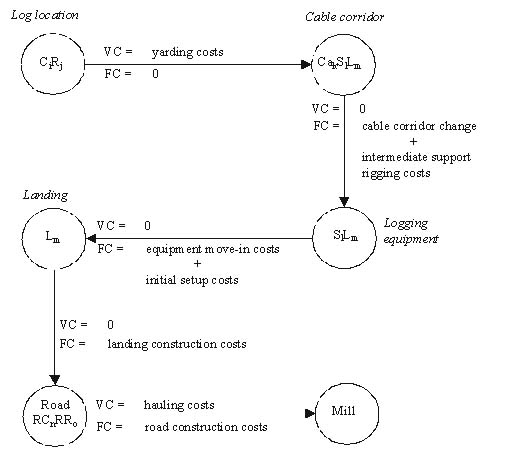
Nomenclature:
VC = variable costs over the link
FC = fixed costs over the link
CiRj = node name representing a log pickup point located in column i and row j on a DTM
CakSlLm
= node name representing cable corridor
k associated with yarding equipment
l located in landing m
SlLm = node name representing logging equipment l located in landing m
Lm = node name representing landing m
RCnRRo = node name representing a road segment located in column n and row o on the DTM
When a cable corridor is newly emplaced, a setup cost is added which includes intermediate support rigging costs if necessary. Equipment move-in cost and initial yarder setup cost is added to the total yarding cost whenever a yarding system is introduced to a landing. Establishing a new landing also triggers its construction costs.
Alternative road segments are generated on a DTM and play a role as links in an entire network. Eight links from each grid cell are developed to connect the grid cell with its neighbor cells (Figure 3). Each link represents corresponding hauling and road construction costs estimated by the cost analysis module based on the user-defined average cost and topographic conditions. If the ground slope between two consecutive grid cells exceeds the maximum road grade which is specified by the user, the link between the two grid cells is considered infeasible and excluded from the network.
Figure 3. Developing eight links representing road segments which connect a grid cell to its neighbor cells on a DTM.
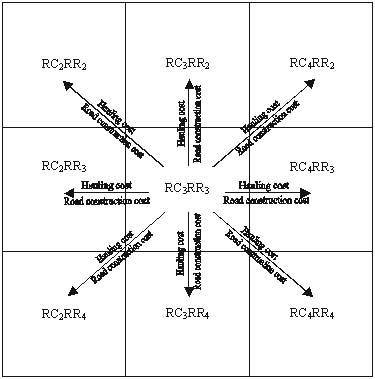
RCiRRj = node name representing a grid cell located in column i and row j on a DTM
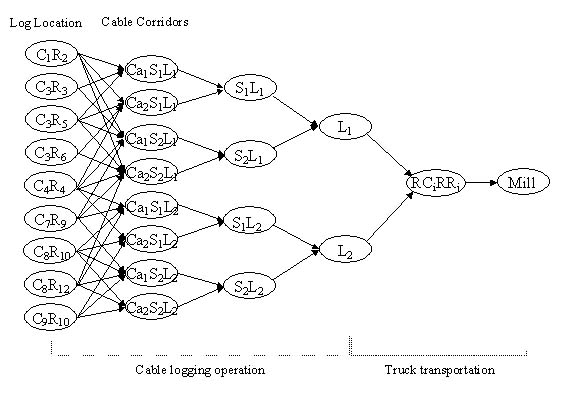
The possible candidate paths from each log location to the destination via alternative cable corridors, landings, and road segments form an entire network (Figure 4). Once the network is established, a "feasible" and "good" path from each log location to the destination can be found by solving the cost minimization network problem.
Figure 4. A network showing alternative paths from log pickup points to the mill (see Figure 2 for variable definitions).
Problem Solution Techniques
Once the networks for cable logging operations and truck transportation are set up, a network programming technique solves the cost minimization network problem. It finds the least cost path from each log pickup point to one of the destinations, while simultaneously selecting cable corridor, cable equipment, landing location, and road segments in the path. In this study, the heuristic network algorithm developed by Sessions [16] is used as a solution technique. The algorithm calculates the minimum cost network by using a shortest path algorithm to solve the variable cost problem similar to that proposed by Dijkstra [3]. The process begins with sorting the grid cells by timber volume (Figure 5), and then solving the shortest path problem without considering the fixed costs (FC). The sum of the volumes, Voli, that went over each link are accumulated so that at the end of the first iteration the sum of all volumes, ΣVoli, over each link are available. The variable costs for each link, VCi, are then recalculated using Eq. 1. The volume over all links is then reset to zero and the next iteration starts using the new set of variable costs. This process continues until the same solution is repeated for two consecutive iterations. To diversify the search, a negative value is substituted for each positive variable cost link not in the solution, such that VCi < 0 for all links with Voli = 0. The solution procedure is then repeated until the solution re-stabilizes. Each time a link with a negative value is used, its value returns to its original value. This process rapidly eliminates the substituted negative values while providing an additional opportunity to consider alternative paths. The algorithm also randomly re-sorts timber sources at each iteration as another solution diversifying technique. Initial paths usually rely on the first timber source entered into the algorithm. Changing the priority of timber sources may develop different paths and thus diverse solution spaces can be investigated.
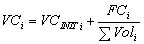
where,
VCi : Variable cost for link
i
VCINITi : Initial variable cost for link
i
FCi : Fixed cost for link
i
Voli : Volume transported on link
i
Figure 5. Flowchart for the heuristic network algorithm developed by Sessions (1985).
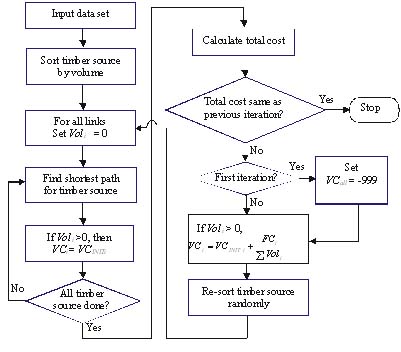
Since cable logging layout and road location problems engage many entry nodes (timber parcels) and links (road segments), they usually produce large network problems. To increase the efficiency of problem solving and keep the problem size solvable, the large network is decomposed into two sub-parts. One is the cable logging operation (from stump to landing) and the other is truck transportation (from landing to mill). First, the cable logging operation part of the network is solved in order to select cable corridors, cable systems, and landing locations (Figure 6). Next, total timber volume arriving at each landing is calculated based on the solution, and sent to the truck transportation part as entry volume into the road network. After truck transportation routes are optimized, road and transportation costs related to each landing are sent back to the cable logging operation part and added to the fixed and variable costs for each landing in the network. If more than one landing shares the same road links, the road costs on the links are divided into each landing proportional to the volume transported over the links. Finally, the optimization algorithm returns to the cable logging network with updated link costs and resolves the network problem.
Figure 6. A feedback mechanism between two separated network problems.
A number of iterations of this process are required to get to a steady state where the results from each part remain the same as the previous iteration and the algorithm stops. Depending on the problem, the iterations of this process might not converge to a steady state but cycle. Setting stopping criteria such as limiting the number of iterations would be necessary to terminate the algorithm in a reasonable amount of time. The best solution among all of the solutions found over the iterative process is stored and becomes the final solution.
APPLICATIONS OF THE METHOD
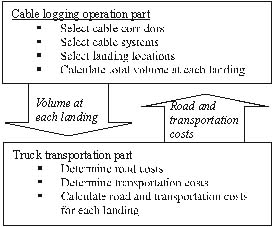
This method has been implemented in a computerized model (CPLAN), written in Microsoft Visual C++. In order to demonstrate the method, CPLAN was applied to a harvest planning area in the McDonald-Dunn Oregon State University (OSU) Research Forest. The size of the area is 93 hectares with a projected harvest of 8,064 m3 through a thinning treatment. GIS data in raster format (10m x 10m grid cell size) provided information on unit boundary, timber volume to be harvested, and the locations of existing roads and riparian zones (Figure 7). A DTM was developed from Light Detection And Ranging (LIDAR) data [11] to provide topographic information. In a network assembled by the model, each timber parcel location was identified as an entry node and the destinations of the network were set as any grid cells that represent existing road locations.
Figure 7. Existing roads and 15-meter stream buffers (each side of stream) shown in the DTM.
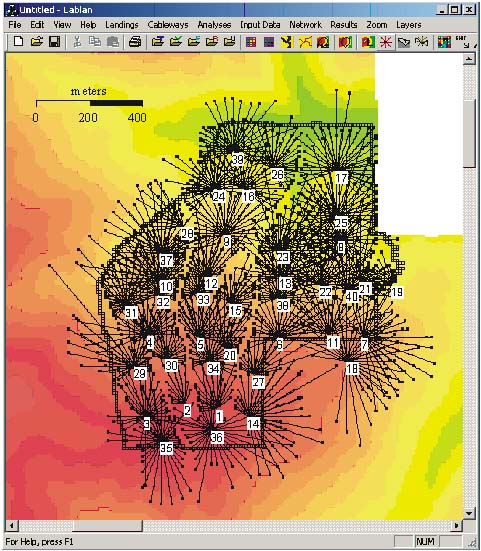
A total of 40 candidate landings were manually selected based on topography over the planning area. Two different cable yarders were examined at each landing (Table 1). Assuming that adequate tailspar is available at any point in the study area, the model projected thirty-six cable corridor alternatives at 10-degree intervals for each yarder at each landing. In total, 2,880 cable corridors were evaluated over the planning area. Among them, the model recognized 1,497 feasible candidate cable corridors through the payload analysis while considering terrain conditions and riparian management areas (Figure 8). The load building simulator in the model identified 1,926 timber parcels and log pickup points by grouping adjacent grid cells in the timber volume layer so that the design payload for one trip of the carriage was obtained.
Table 1: Two cable yarders examined in the application.
| Madill-6150 | Koller K-300 | ||
| Maximum external yarding distance | 600 m | 300 m | |
| Maximum lateral yarding distance | 50 m | 30 m | |
| Tower height | 15 m | 7 m | |
| Skyline | Maximum allowable tension | 117.6 kN(12,000 kgf) | 49.0 kN(5,000 kgf) |
| Mainline | Maximum allowable tension | 60.8 kN(6,200 kgf) | 21.6 kN(2,200 kgf |
| Design payload for one turn | 24.5 kN (2,500 kgf) | 9.8 kN (1,000 kgf) | |
Figure 8. Feasible cable corridor alternatives found by the logging feasibility analysis.
The model developed two cost minimization network problems. A total of 110,187 links and 1,926 timber parcels (entry nodes) were included in the network problem for cable logging paths. In the network for solving the road location problem, a total of 104,014 links were built to connect 13,522 grid cells included in the planning area and its surrounding area where existing roads are located. There are 498 grid cells on the existing roads that are used as the actual destinations in the network.
The two network problems were solved using the heuristic network algorithm. The solution time was 6.3 hours with a 2.4GHz Pentium Xeon desktop computer. The solution resulted in 19 landings and 139 cable corridors which were selected from 40 candidate landings and 1,497 feasible cable corridors in order to harvest 8,064 m3 of logs from 1,926 timber parcels (Figure 9). As few as 2 and as many as 12 cable corridors were located at a landing. A total of 3.2 kilometers of new roads were proposed to access the selected landings (Figure 10).
Figure 9. Landings and cable corridors selected by the heuristic network algorithm.
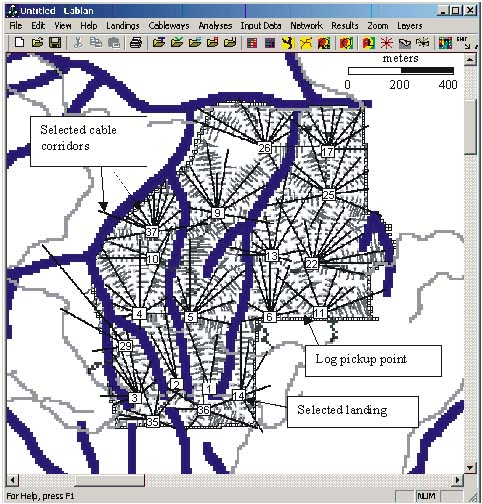
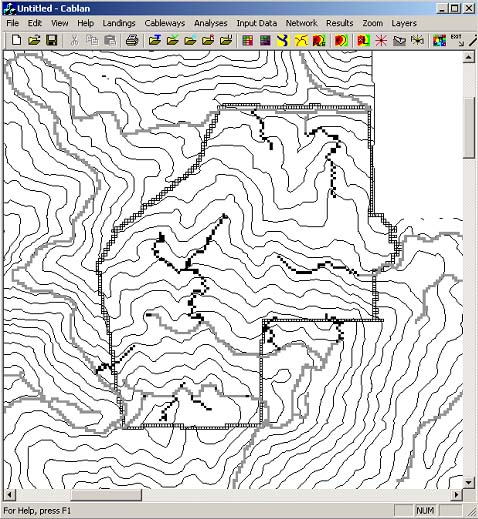
Figure 10. Selected landings and new access road locations shown with 15-meter interval contour lines.
As a portion of the computer output for the solution, total estimated yarding and transportation costs for timber harvest in the planning area was $421,500 ($52/m3) including felling cost (Table 2). Yarding costs consist of yarding and loading equipment ownership costs, operating costs as variable costs, and landing construction, equipment move-in, and cable corridor setup costs as fixed costs. Transportation costs include new road construction costs as fixed costs and hauling costs over the new roads as variable costs. The hauling costs were insignificant in this application since the timber exit locations were set as any points on existing roads and most selected landings were close to existing roads. Percentages of yarding costs, transportation costs, and felling costs to the total estimated harvesting costs are 63%, 30%, and 7%, respectively. Truck time during loading or unloading is not included in this analysis. Compared with the past average thinning costs of $35/m3 ($200/mbf) in the OSU Research Forests from 1998 to 2001 [13], the yarding costs of $36/m3, including felling costs from this model, seem to be a reasonable estimate, although the direct comparisons are limited since included cost influencing factors, as well as study sites, may be different.
Table 2: Total cost estimation for the solution.
| Costs | Yarding costs | Transportation costs |
| Variable costs | $129,230 | $190 |
| Fixed costs | $136,210 | $127,650 |
| Sub total | $265,440 ($33 /m3) | $127,840 ($16 / m3) |
| Felling cost | ||
| Total harvesting costs | ||
DISCUSSION AND CONCLUSIONS
The method presented in this paper applies a heuristic network algorithm to solve a cable logging and transportation planning problem. Combined with a GIS, the method helps forest planners evaluate a large number of alternative paths in extracting logs from the stump to the mill using cable logging and truck transportation. The logging feasibility and cost analysis modules included in the method provide physically and environmentally feasible alternative timber paths.
The method was incorporated into a computerized model and applied to a harvest planning area. Although the verification of the solution was limited, the application showed that the heuristic network algorithm was able to provide a useful preliminary layout for the cable logging area. Several limitations of the current method were also discovered during the application.
First of all, the results of this method should be considered as a "preplan" for cable logging operations in a specific area. Since the solutions are determined solely by the logging feasibility and economic analyses, they might not be the best choices from practical perspectives. For example, tail spars that are located in riparian zones or skyline corridors that cross roads or other landings might be problematic in practice. Assuming adequate tail spars are available anywhere is also less realistic since tail spar locations often become a limiting factor in locating a skyline corridor in actual cable logging operations.
Second, the roads proposed by the method provide "approximate" road locations rather than "exact" locations. Since the method determines road locations based on a raster grid map and the alignment of roads is not constrained in the method, the proposed roads may include many sharp turns that are inherently produced by connecting a grid cell to one of its adjacent cells. Most of these sharp turns are not feasible for actual road layout and the actual road should be relocated with considerations made to the physical feasibility of the road alignment.
Third, a lack of suitable data for the analysis is another problem faced in implementing this method. Certainly low quality data would not produce useful and satisfactory solutions. The users should understand the quality and the limitations of the input data and appropriately interpret the outputs.
The method and the computerized model should be further tested and verified. The outputs from the model could be compared with a paper cable logging plan produced with a conventional manual method for the same area. The efficiency of the method in terms of time required to develop a cable logging layout could also be compared with that of the conventional method.
Further studies aimed at improving the current method should be conducted based on the verifications of the method. Incorporating more expert knowledge for practical issues will be a key in the development of a computer-based planning tool that will be widely accepted. For example, future model extensions will consider additional GIS information on unstable and fragile soils and the availability of tree spars and anchors. The physical feasibility of the road alignments should be considered in the further development of this method. Future model extensions will also benefit from high accurate spatial data available with advanced GIS technologies. For example, the availability of a DTM derived from LIDAR data undoubtedly contributed to the strength of the computerized plan. The increasing availability of LIDAR data makes the computerized approach more and more viable and correspondingly, the availability of decision support tools such as this tool that can use the higher quality terrain data contribute to the usefulness and justification for the increased data quality.
Hopefully, with the further improvements mentioned, the method and the computerized model developed in this study can provide forest planners with an efficient analytic tool that contributes to better cable logging layouts that reduce the costs and environmental impacts of timber harvesting.
AUTHOR CONTACT
Prof. Chung can be reached by e-mail at --
REFERENCES
[1] Brown, C. and J. Sessions. 1996. The standing skyline: a maximum log load solution procedure. Forest Science 42(2): 220-227.
[2] Chung, W. 2002. Optimization of cable logging layout using a heuristic algorithm for network programming. PhD dissertation, Oregon State University. Corvallis, OR. 206pp.
[3] Dijkstra, E.W. 1959. A note on two problems in connection with graphs, Numerische Mathematik 1: 269-271.
[4] Dykstra, D.P., 1976. Timber Harvest Layout by Mathematical and Heuristic Programming. PhD dissertation. Oregon State University. Corvallis, OR. 299pp.
[5] Dykstra, D.P. and J.L. Riggs. 1977. An application of Facilities Location Theory to the design of forest harvesting areas. AIIE Transactions. 9(3): 270-277.
[6] Edwards, R.M. 1992. Logging planning, felling, and yarding costs in five alternative skyline group selection harvest. Master of Forestry paper, Oregon State University, Corvallis, OR. 213pp.
[7] Epstein, R., R. Morales, J. Seron, and A. Weintraub. 1999. Use of OR Systems in the Chilean Forest Industries. Interfaces. 29(1): 7-29.
[8] Epstein, R., J. Sessions, B. Sessions, P. Sapunar, E. Nieto, F. Bustamante, and H. Musante. 2001. PLANEX: A system to identify landing locations and access. In Proc. of the International Mountain Logging and 11th Pacific Northwest Skyline Symp. P. Schiess and F. Krogstad [Eds.]. December 10-12. Seattle, WA.
[9] Kellogg, L.D., G.V. Milota, and B. Stringham. 1998. Logging planning and layout costs for thinning: experience from the Willamette young stand project. Forest Research Laboratory, Oregon State University, Corvallis, OR. 20pp.
[10] Jarmer, C. and J. Sessions. 1992. Logger-PC for improved logging planning. In Proceedings of Planning and Implementing Future Forest Operations, International Mountain Logging and 8th Pacific Northwest Skyline Symposium, Schiess, P. and J. Sessions [Eds.], December 14-16, 1992. Bellevue, WA.
[11] Kraus, K. and N. Pfeifer. 1998. Determination of terrain models in wooded areas with airborne laser scanner data. J. of Photogrammetry and Remote Sensing 53: 193-203.
[12] Logan, R. 2001. Water quality BMPs for Montana forests. Montana State University Extension Service Publication EB158, Missoula, MT. 58pp.
[13] MGT of America, Inc. 2002. OSU College Forests Management Review: Final Report. Oregon State University. Corvallis, OR. 174pp.
[14] Oregon Department of Forestry. 2000. Forest Practice Administrative Rules and Forest Practices Act. Chapter 629. Forest Practices Administration. 78pp.
[15] Rummer, B., J. Baumgras and J. McNeel. 1997. Forest operations for ecosystem management. In: Role of wood production in ecosystem management. Proceedings of the IUFRO All Div. 5 Conference. FPL-GTR-100. Forest Products Laboratory, USDA Forest Service. p. 46-52.
[16] Sessions, J. 1985. A heuristic algorithm for the solution of the variable and fixed cost transportation. In Proceedings of the 1985 Symposium on Systems Analysis in Forest Resources, Dress, P.E. and R.C. Field [Eds.], December 9-11, 1985. Athens, GA.
[17] Softree Technical Systems Inc. 2000. Location Module. Softree Technical Systems Inc, West Vancouver, B.C. 84pp.
[18] Twito, R.H., S.E. Reutebuch, E. Stephen, R.J. McGaughey, and C.N. Mann. 1987. Preliminary logging analysis system (PLANS): overview. .U.S. Dept. Ag., For. Serv. Pacific Northwest Res. Station, Gen.Tech. Rep. PNW-GTR-199.; 24pp.