Vol. 15 No. 2, March 2004
Heikki Ovaskainen
University of Joensuu
Finland
Jori Uusitalo
University of Joensuu
Finland
Kari Väätäinen
Finnish Forest Research Institute
Finland
The authors are, respectively, Researcher at the Faculty of Forestry, University of Joensuu, Professor at the Faculty of Forestry at the University of Joensuu and Researcher at the Joensuu Research Center of the Finnish Forest Research Institute.
ABSTRACT
Productivity levels between harvester operators have been noted to vary significantly, by up to 40% in similar stands. It is believed that differences originate from the operators cutting techniques, motoric skills, planning of work, experience, felling order of removable trees, decision processes at the working location, machine properties and the surrounding environment. The objective of this study is to examine and compare six harvester operators and to detect those features of working technique that improve and rationalise the work. Consequently, improving the basic working technique can raise average productivity. The harvester operators' work was examined by using the normal stopwatch study method and the operators' working technique was registered for each handled tree. Working technique observations were adjoined to stopwatch the study time units as a large matrix after data collection.
Results indicate that unnecessary stem movements in the felling phase should be avoided. The stem should be processed close to the stump so that the positioning-to-cut distance to next removable tree is short. This reduced positioning-to-cut time for the next felling. In processing, a productive operator can operate without big delays and the variations in processing times for same stem sizes are small. Furthermore, the productive operator avoids reversing when he is doing normal harvesting work.
Keywords: single-grip harvester, working technique, first thinning, cut-to-length method, work-study, Finland
INTRODUCTION
The modern cut-to-length (CTL) method usually involves two machines: a harvester and a forwarder. A modern single-grip harvester consists of carrier, boom, harvester head and advanced CAN -based measuring and control systems that monitors, measures and controls tree processing. Despite extensive development to make them user friendly, harvesters are rather complex and along with the high cost of the machine, have impacted on its popularity in many parts of the world.
The productivity of harvesters is intensively studied in the Nordic countries [2, 3, 4, 5, 7, 13, 16, 21, and 23] and also to some extent in North America [11, 14, 15, 17, 19, and 20]. The principal aim of these studies has mainly been to investigate the main factors affecting harvesting productivity, in order to establish the basis for cost calculations and work expenses. The logical results of these studies reveal that harvesting productivity increases with increasing stem size. Modern harvesters are so effective that it takes only slightly more time to process a mature tree compared to a small sized tree. This inevitably leads to an increase in productivity as stem size is increased. However, the relationship is not linear. In addition to tree size, the productivity of harvesters has been noticed to increase with enhanced harvesting intensity, the number of trees harvested and the number of trees removed [5, 13, and 23]. Other factors than the properties of standing trees that affect the productivity include ground structure, (slope, surface structure, ground strength) machine properties and human factors.
Beside tree size, the characteristics of the operator may be regarded as the most important factor related to harvester productivity [23]. The crucial effect of the worker on the productivity of forest work is a well-known fact and the work of a harvester operator is not an exception. Significant differences have been noted between the productivity levels of operators, up to 40% in similar stands [12 and 21]. Factors, that cause these differences, are unknown. Various researchers can only provide estimates. Due to the marked differences between the productivity of forest workers, forest work scientists have applied several methods to make work-study results more comparable. The classic scientific work method, performance rating, is not widely accepted among forest work scientists. Nordic researchers have especially favored the principle of the comparative time study in order to make results more comparable [9, 10, and 22]. Gullberg [8] suggests a new variable, "adaptation" that could be used in order to reduce the operator's effect in comparative experimental studies. Another approach is to use a simulation technique that links different work phases together and usually takes the variation of work performance in the analysis into account [1, 5 and 24].
Despite the fact that the differences in productivity between different workers are significant, there are rather few studies focusing on this area. Tufts [20] presents a detailed model for time consumption of a single tree but provides no explanation for the significance of working technique on productivity nor time consumption since the model is based on the works study of one operator. The factors that explain time consumption of a single tree include volume, distance from the harvester to the tree, number of pieces processed, boom rotation from centerline and merchantable length of the stem. Sirén [23] compared the work of four operators in thinnings in central Finland. He reports that operators used different working methods resulting in marked differences in time consumption of several work elements but did not find clear reasons to explain the differences. Detailed analyses revealed that the amount of carrier and boom movements does not explain the variation between the operators. It can thus be hypothesized that differences in productivity are due to the speed of movements and processing and the "quality" of carrier and boom movements.
The origins of this study come from the needs to improve the harvester operators' education. Teachers at forest schools are well aware of the marked differences between experienced operators and students but they do not agree on the most effective way of operating. It has been noticed that some experienced operators have a certain kind of unexplained ability to operate the machine in an optimal way. This skill includes not only the physical part but also the mental part of the work - ability to do the right things in the right order and in an ideal way. This kind of approach to human behavior is receiving more attention in many areas of science and is generally called tacit knowledge [18]. Furthermore the motor-sensory and cognitive work of the operator must be taken into account [6].
It can be assumed that the productivity differences of harvester operators originate from the cutting technique, motoric skills, work planning, experience, selecting order of removable trees, machine properties, surrounding environment and decision processes at the working location. The aim of this study is to investigate the affect of different working techniques of 6 operators on the harvester operators' work performance in first thinnings. The differences between the operators' working techniques were analysed in detail for each harvester work phase and the motives and effects of the used techniques employed are presented. Also, the general features of the different working techniques are described.
MATERIAL AND METHODS
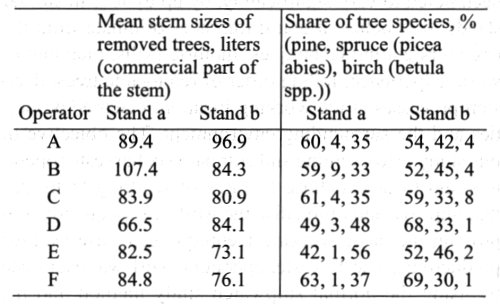
In the fall of 2002, the work of six professional harvester operators' was researched in two different kinds of Scots pine (Pinus sylvestris) dominated thinning stands located in Northern-Carelia in Eastern-Finland (Table 1). Stands were selected so that tree stand variation within the stands was minimized and circumstances were very similar for all operators. Mean diameters at breast height of the study stands were 13.2 cm and 12.7 cm and mean heights 14.4 meters and 14.6 meters, respectively. Both stands were thinned according to the standard thinning instructions from basal areas of 22.0 and 19.8 m2/ha to 14.0 and 13.2 m2/ha. The initial number of stems in stand a and b was 1 232 and 1 071 stems/hectare, respectively. The total mean stem volume of the commercial portion of the removed stems was 82 dm3.
Table 1. Characteristics of the removed trees by operators and stands.
One important factor affecting the harvester operators' work is the terrain. The experiment areas of the stands were chosen so that the terrain variation was minimal and thus only had a slight impact on the operators' decision making in the experiments. Stands, which include slopes or swamps, were outlined herewith. During the experiments the ground was covered by a 20 cm snow layer and the falling snow from trees slightly affected visibility.
The operators were selected from different logging contractors. Demands set for the operators were that they were familiar with Timberjack's harvesters and they had experience with the new Timbermatic 300 measuring and control system. In addition, they also needed to be professionals in harvesting work.
In both stands each operator cut three experiment areas during one day. The time of the experiment was set to be 60 minutes of effective work in stand A and 45 minutes in stand B. The operators were allowed to freely choose the location of the strip road as they do in their normal work. Trees were not marked prior to harvest, so the harvester operator was responsible for selecting stems to be removed. There was at least a 30 minutes break between the experiments.
All the operators used the same harvester (Timberjack 1070 C) and they familiarized themselves with the harvester, boom and other properties of the machine about one hour prior to the first experiment. Bucking instruction file (APT) was the same for all operators but the operators were allowed to set some desired log lengths into certain length buttons. They were also allowed to adjust the boom movements and the feeding speeds according to their preferences. The overall aim of the harvesting session in the experiment was that the operator could achieve the same kind of work performance as he does in his every day work.
Stopwatch study and work technique observation
The work-study consisted of two separate studies that were carried out simultaneously by two researchers: a stopwatch study and a work technique observation. The stopwatch study was made using the basic work phase observation method. Work phases were divided into 5 stages: moving, positioning-to-cut, felling, processing (delimbing and crosscutting), and non-productive time (Table 2). In this study, some work phases were divided into even more detailed units. Moving was observed when the harvester tracks started moving and ended when the harvester stopped moving to perform some other task. The moving was divided into driving forward and reversing. Positioning-to-cut time started when the boom started to swing toward a tree and ended when the harvester head rested on a tree. The felling work phase started when the felling cut began and ended when the feeding and crosscutting work phase was launched. Felling was divided into two categories: normal felling and felling with moving of stem over 3 meters. Processing consisted of delimbing and crosscutting. The processing phase ended when the operator started to do the next work phase. In processing, trees with two or more tops were divided into time units by each top section of the stem. Non-productive time consisted clearing, steering in the boom, piling of logs, moving tops and branches and short delays, which were caused by the operator. Steer-in the boom occurred when the operator steered the harvester head to the front of the machine before the moving phase. Total effective working time included all previous listed work phases and all delays and breakdowns caused by machine or its data system were excluded.
Table 2. Stop watch-study and work technique observation divided into detailed units.
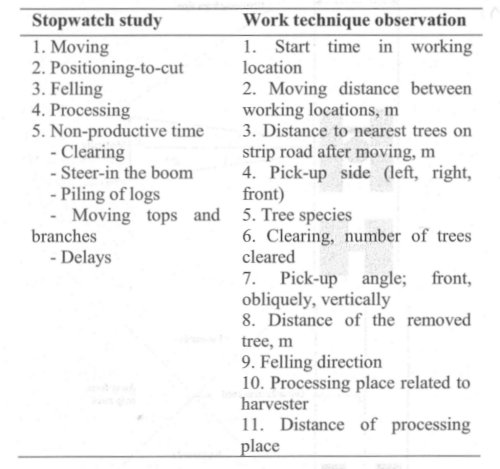
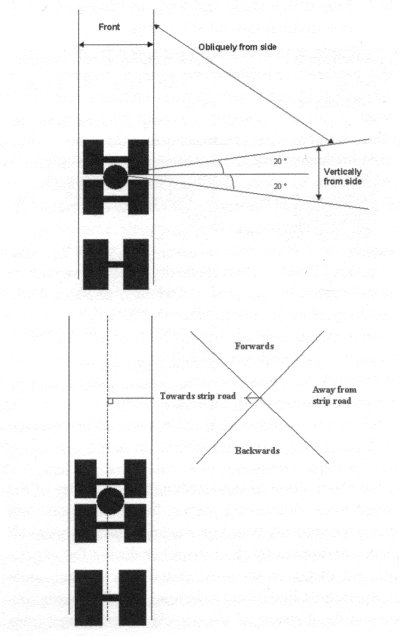
In the observation of work technique, distances of the removed trees, processing places, boom directions and machine movements based on visual estimates, were all observed and noted by the researcher during the experiments. All distances were estimated at a vertical angle from the middle line of the strip road except moving distance and the distance of the wheels to the nearest trees on the strip road, which were estimated along the strip road. Moving distances smaller than 0.5 meters were not marked down. In this case tree pick-up angle was divided into three categories: front (means strip road), obliquely from side (0-70°, does not include strip road) and vertically from side (70-110°) (Figure 1). Felling direction included four classes: away from the strip road, towards the strip road, backwards and forwards parallel to the strip road. If the harvester operator cleared small trees before a merchandised tree, the number of clearings was marked down. The processing place was divided mainly into two cases: processing besides the strip road and processing on the stand side. In the first case branches and top were left on the strip road and logs were fed away from the strip road. In the second case crosscutting was done on the stand side and feeding direction of the logs was toward the strip road. Top and branches were left on the stand side. Distance of the processing place from the middle line of the strip road was also estimated.
Figure 1. Pick-up angles and felling directions.
The automatic data logger PlusCan (manufactured by Plustech Ltd) was also attached to the harvester, which monitored CAN-bases of the harvester. The device collected detailed process data of the work phases and information about processed stems. In this paper only the stem volumes collected by this data logger are presented.
The data of the whole work technique was recorded using a Psion hand held computer. Work technique observations were adjoined by stopwatch study time units for each handled tree as a large matrix after data collection. Also the volumes of the stems were added.
Selected values indicating the productivity of an operator were presented to show the productivity differences among operators and distinguish a productive harvester operator. Productivity values were calculated separately for both stands, whereas results of the working technique observations were calculated using the entire material. Because of the imperceptible differences in operator's working techniques in both stands, the observed values of working techniques were adjoined.
RESULTS
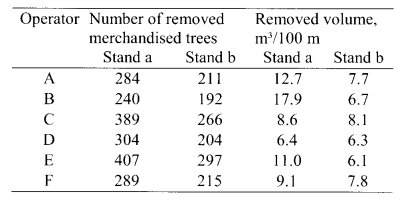
Differences in productivity among operators can be seen in Table 3. The number of removed merchandised trees varied significantly between the operators in one stand. Operators C and E removed roughly 70 % more stems than operator B in stand a during the same time frame. Operator E was the most productive in stand b. He removed 54.7 % more stems than the operator B. Operator B's removal of m3/100 meters was larger compared to the others mainly because the stem size was bigger than the average in stand a (see Table 1). This has partly diminished his number of removed stems compared to the other operators. Tree size varied between the experiments within the stand although the experiments were attempted to be located in similar places.
Table 3. Number of removed merchandised trees and removed volume. Calculation of a value m3/100 meters based on the reach of the boom 10 m, operator's total driving distance and the total accumulation of the cubic meters during the operator's experiments.
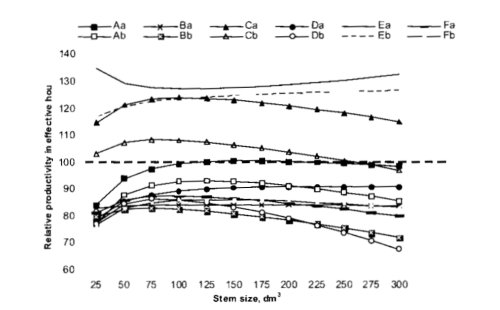
In Figure 2, the operators' relative productiveness per effective hour in a function of stem size in both thinning stands are shown. Large differences in productiveness between the operators can be seen; reaching from 40 % to 55 % in the same stand depending on stem size. Furthermore, productivity differences increase with increasing stem size. In stand a every drivers' productivity was between 2 % to 18 % higher than in stand b. However, regardless of the stem size, the most productive operator, operator E, could retain almost the same productivity level in stand b as in stand a. Besides the stem size, the harvester operator and stand structure seems to also have an effect on productivity. Stand structure affects the productivity, but according to Figure 2, the operator and his work functions have a larger effect on productivity than the stand structure itself.
Figure 2. The operators' relative productiveness in thinning stands a and b. Productivity curves are based on the model y = a + bx + cx2, where y is the productivity in m3/effective hour and x is the stem size. R2 values vary from 0.81 to 0.94. In the figure, the operators' curves are related to the total productivity curve calculated of the joined data. Numbers of trees are presented in Table 3.
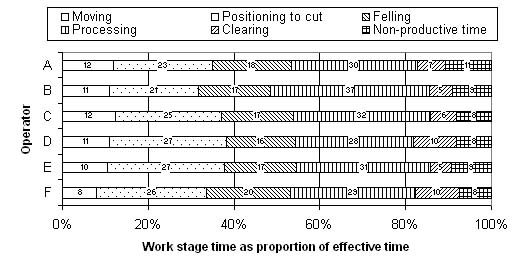
The summary of the statistics of the work phase times illustrates the operators' time consumption in each work phase (Figure 3). The relational difference among operators was biggest in the clearing work phase. Some operators made a very thorough clearing and removed all retarded trees. Clearing time is here separated from the non-productive time. However, the figure does not illustrate whether the operator has processed a large number of stems or has been slow in all those work phases. The total time consumed is almost the same for all operators although the amount of removed stems and removal is different.
Figure 3. Structure of effective work time by main work stages and operator.
MOVING
Total moving time was divided into driving ahead and reversing (Table 4). The most productive operator, E, reversed only 6.7 % of total moving time; while operator B reversed 18.9 %. Operators C and E moved the most and their number of working locations was the largest. Operator E's moving speed was also the highest. However, the operators did not differ significantly in average driving distance between working locations or in number of removed trees in one working location.
Table 4. Differences and similarities in the moving work phase.
| Operator | Total distance moved, m | Driving ahead/reversing, share-% | Number of working locations | Average driving distance, m | Trees removed in one location | Speed, meters/minute |
| A | 470 | 82.5 / 17.5 | 133 | 3.5 | 3.5 | 12.7 |
| B | 387 | 81.1 / 18.9 | 118 | 3.3 | 3.3 | 11.3 |
| C | 693 | 86.9 / 13.1 | 167 | 4.1 | 3.8 | 17.5 |
| D | 629 | 89.3 / 10.7 | 153 | 4.1 | 3.3 | 17.7 |
| E | 693 | 93.3 / 6.7 | 192 | 3.6 | 3.5 | 21.5 |
| F | 520 | 86.5 / 13.5 | 149 | 3.5 | 3.3 | 20.0 |
POSITIONING-TO-CUT
Operator C had the smallest average positioning-to-cut time, 7.34 seconds (Table 5). Operator E's average positioning-to-cut time was 0.12 seconds more than C's. The largest positioning-to-cut time was needed by operator D, 10.49 seconds. Numerous factors explain the average positioning-to-cut time because the operator has to take into account many things in positioning-to-cut phase. For example, the operator might plan the work during the positioning-to-cut phase or he steers the boom carefully to the tree avoiding damaging the remaining trees or he quickly selects the nearest removable tree to process after the previous one.
Table 5. Total and average positioning-to-cut distance and average positioning-to-cut time.
| Operator | Sum of positioning-to-cut distance, m | Average positioning-to-cut distance, m | Average positioning-to-cut time, s |
| A | 1843.10 | 4.01 | 9.24 |
| B | 1702.00 | 4.26 | 9.60 |
| C | 2580.80 | 4.05 | 7.34 |
| D | 2041.80 | 4.03 | 10.49 |
| E | 2475.80 | 3.73 | 7.46 |
| F | 2200.90 | 4.45 | 10.26 |
Operator E had the smallest positioning-to-cut distance, which can be explained by the working technique where as many trees as possible were processed at one standing side by one positioning-to-cut movement. Therefore, the operator chose a boom route to stand side between trees so that he could process many removable trees from one side with minimum boom movements. Herewith, the processing of the stem occurred close to the stump.
FELLING
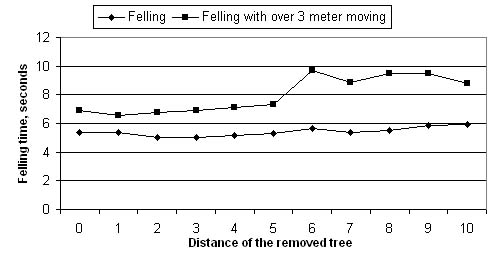
The felling phase was separated into two methods. Normally, the operators moved the stem on the ground or moved the stem in the upright position to the processing place. For this reason, felling with moving took more time than the pure felling and processing near the stump (Figure 4). Presumably, the distance of the removed tree did not have an influence on the felling time, but in felling with over 3 meters of movement, the time increased by approximately 2 seconds, when the distance of removed tree from the strip road exceeded 5 meters. Stems, felled with over 3 meter moving, accounted for 35.1 % of the total felling amount.
Figure 4. Average felling time for removed trees with different distances from the strip road.
The most productive operators, C and E moved roughly 10% of the removed trees to other side of the strip road (Table 6). They processed trees mainly on the felling side near the stump so that the feeding direction was toward the strip road. For this reason, their average moving distance of the stems was approximately 1.5 meters less than the others were. Thereby, they could avoid unnecessary stem movement.
Table 6. Share of stems moved over the strip road in felling and average moving distance from stump to processing place.
| Operator | Stems moved over the road, % | Stems processed on the felling side, % | Average moving distance from stump to processing place, m |
| A | 34.3 | 65.7 | 3.91 |
| B | 28.1 | 71.9 | 3.48 |
| C | 9.6 | 90.4 | 1.84 |
| D | 14.8 | 85.2 | 2.33 |
| E | 12.5 | 87.5 | 2.02 |
| F | 31.6 | 68.4 | 3.48 |
The operators' felling directions were divided into different felling sections (Figure 5). In large distances of 8-10 meters most of the trees were felled away from the strip road; almost all operators felled over 80 % of the stems to this direction. More variation can be seen in felling directions among the operators on strip road in 0-3 meters. For example, operator A felled the trees forward and operator F felled almost 90 % of the trees away from strip road in this class. Variation in different felling directions diminished when the distance of the removable tree increased from the strip road. Only a few stems were felled backwards.
PROCESSING
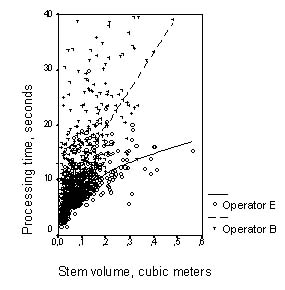
The scatter diagram of processing times as a function of stem volume describes the harvester operators' level of processing speed and reliability (Figure 6). Productive operators' dispersion is small and the slope curve rises slowly. A productive operator can process the stem rapidly, without longer pauses. The stem volume correlates well with the processing time. In the case of large dispersion, other factors may explain better processing time than the stem volume itself. Also the most productive operator's average processing time was the smallest.
All the operators processed trees mostly on the left side of the strip road (Table 7). The most productive operators avoided unnecessary movements of the stem and for this reason they processed almost half of the removed trees on the stand side. Thereby the sheltering limb and top mat for the roots of remaining trees was not present. The average distance of the processing place beside the strip road was 2.8 meters and on the stand side 6.0 meters among the operators'. The operators' average processing times did not differ between different processing places.
Table 7. Shares of processing places.
| Operator | On the right in stand | On the left in stand |
On the right side of the strip road | On the left side of the strip road |
| A | 6.5 | 8.7 | 32.8 | 52.0 |
| B | 11.5 | 23.7 | 22.0 | 42.8 |
| C | 25.6 | 24.3 | 15.5 | 34.6 |
| D | 19.1 | 24.5 | 11.8 | 44.6 |
| E | 21.5 | 26.2 | 14.2 | 38.1 |
| F | 13.5 | 16.2 | 24.6 | 45.7 |
The technique of handling trees with two or more tops was quite different between the operators. All operators made a cut over the topping point, after they had more than one branch in harvester head. Some operators dropped all branches to the ground and picked and processed them individually. The second technique was to feed the branches back and forth simultaneously opening the delimbing knifes until only one branch was left in the harvester head. The third technique was to open delimbing knives a little so that the other branches would fall off leaving one branch in the harvester head.
NON-PRODUCTIVE TIME
Non-productive time included all other work phase times other than moving, positioning-to-cut, felling, and processing (Table 8). While clearing, some operators cleared more non-commercial trees than it was necessary and the others only what was necessary. For example, operator F cleared twice as much as operator E.
Table 8. Non-productive time divided into smaller work elements.
| Operator | Clearing, %-unit | Placing, %-unit |
Steer-in the boom, %-unit | Pause time, %-unit | Total, % (share of total effective time) |
| A | 6.5 | 2.5 | 3.6 | 4.6 | 17.2 |
| B | 5.3 | 1.3 | 4.2 | 3.6 | 14.4 |
| C | 6.1 | 1.0 | 6.0 | 1.1 | 14.2 |
| D | 9.9 | 0.02 | 5.7 | 2.4 | 18.1 |
| E | 4.8 | 0.4 | 7.5 | 1.5 | 14.2 |
| F | 10.1 | 0.4 | 4.8 | 2.4 | 17.7 |
The placing work phase included placing the tops on the strip road, moving of branches to the strip road and piling of separate logs. Operator A moved branches and tops to the strip road after processing. Before moving, operators usually steered the boom to the front of the machine. During a pause visible movements were not detected at either the machine or the boom.
Figure 5. Away from the strip road, towards the strip road and forwards felling shares in different distance classes grouped by operator.
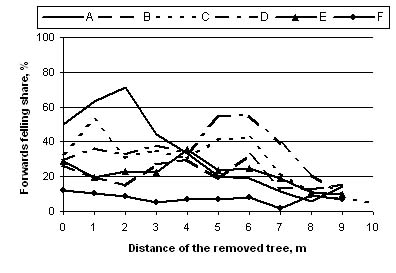
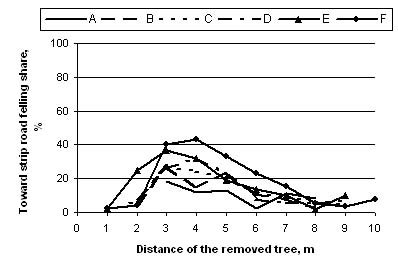
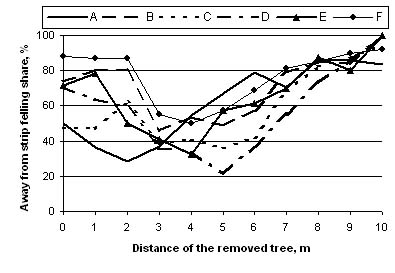
Figure 6. Operators' E and B processing times as a function of stem volume.
DISCUSSION
The features of the operator's working technique did not differ significantly between the study stands and therefore the data of the two stands were joined in the same matrix. The combination of the data of the two study stands, enabled the analysis of the larger data material and to get more reliable results herewith.
The material can be considered good compared to earlier studies. Harvesting conditions (such as terrain, stand and tree characteristics and weather conditions) in experiments were rather similar among operators and therefore the comparability of the operators was good. All operators studied were professionals with several years work experience. There were, however, slight differences in regards to how much experience each operator had in working in thinnings. The study operators were driving with the same machine and they all had long experience in working with similar machines. There should be no reason why our results could not be valid in similar CTL thinning conditions.
The most productive operator planned the work so that the reversed distance was minimized. This way the driving of the same distance twice was avoided. Furthermore, his average moving distance between working locations was not the biggest so it might be better to move rather short distances than larger ones. By using short moving distances the observation and planning of the new working location concentrates on a smaller area. This facilitates the planning of work in a way that a smaller number of factors have to be considered.
The positioning-to-cut distance to the next removable tree should be short. This diminishes positioning-to-cut time and unnecessary boom movements. The operator should try to operate as many trees as possible from one side before moving to operate on the other side of the strip road.
The results also indicate that unnecessary stem movement in the felling phase should be avoided. The stem should be processed close the stump so that the positioning-to-cut distance to next removable tree is short. If the operator moves the stem over the strip road, it is reasonable to take the next tree from this side. However, the data does not explain the reason for moving the stem. In some cases the removable tree got stuck with its top in other standing trees and the best way to dislodge the tree was to move the stem. Also, if the stems are processed mostly on the stand side the limbs and tops are not creating a sheltering mat on the strip road. Our results about positioning-to-cut movements and movements while felling are in accordance with the earlier findings of Tufts [20] and Sirén [23] who found that both distance from harvester to tree and pick-up angles have a clear affect on time consumption. We have, however, found distinct evidence that a harvester operator can enhance the productivity by processing the stems close to the stump.
The most productive operator can process the stems without significant delays and the variation in processing times with the same stem sizes is small. A high feeding speed of the stem speeds up the processing, and delimbing goes through without interruptions. The operator, however, must not forget the quality of the logs and optimum crosscutting of the stem.
The harvester is an expensive machine and for this reason all non-productive time should be minimized and concentration should be focused on productive work. For example, the operator should only clear saplings if necessitated to ensure good working conditions. In non-productive time, the pause time is often when the operator plans the next work phase. If the plan is good, delay times are minimized and the harvester work flows forward steadily. A productive operator does not need to stop and think about the next work phase; he can plan while working.
Harvesting work is only one part of the thinning operation. Another important part of the harvester work is forwarding of logs from stand to roadside. The harvester operator must remember this when processing the stems and in choosing log pile locations. Also, all silvicultural aspects must be considered and the thinning done according to thinning instructions.
This research attempts to investigate the main features of the harvester work. However, the work technique is only one factor that influences the productivity of the harvester. The environment of the harvester work is always changing and in every case the work technique must be adapted again. The operator's capability to plan and apply his motoric skills is emphasized in different situations.
ACKNOWLEDGEMENTS
The Forest-machine Training Centre of Eastern Finland, the Tampere University of Technology, the University of Joensuu and the Finnish Forest Research Institute have started "The Development Project of Forest-machine Simulator Based Studying (ProForSim)" lasting for four years, which aims to make tacit knowledge more visible in harvester work and to develop curriculum, appropriate studying methods and contents of the Forest Simulator Based Studying. Also forest machine manufactures Timberjack, Ponsse and Valmet are actively participating, as well as the Northern Carelian Polytechnic and Municipality of Valtimo. The authors gratefully acknowledge the support of previous listed organizations as well as European Social Fund and all those persons who participated in one way or another to construct this paper.
AUTHOR CONTACT
Mr. Ovaskainen can be contacted by email at --
heikki.ovaskainen@joensuu.fi
REFERENCES
[1] Aedo-Ortiz, D.M., E.D. Olsen and L.D. Kellog, 1997. Simulating a harvester-forwarder softwood thinning: a software evaluation. For. Prod. Jour. 47(5):36-41.
[2] Brunberg, T. 1991. Underlag för produktionsnormer för beståndsgående engreppsskördare i gallring - em litteraturstudie. [Productivity norms for stand-operating single-grip harvesters in thinning - a study of the literature]. The Forestry Research Institute of Sweden, Uppsala. Redogörelse 3. 23 pp. (in Swedish).
[3] Brunberg, T. 1997. Underlag för produktionsnorm för engreppsskördare I gallring. [Basic productivity norms for single-grip harvesters in thinning]. The Forestry Research Institute of Sweden, Uppsala. Redogörelse 8. 18 pp. (in Swedish).
[4] Brunberg, T., A. Thelin, and S. Westerling, 1989. Underlag för produktionsnormer för engreppsskördare i gallring. [Basic data for productivity standards for single-grip harvesters in thinning]. The Forestry Research Institute of Sweden, Uppsala. Redogörelse 3. 25 pp. (in Swedish).
[5] Eliasson, L. 1998. Analyses of single-grip harvester productivity. Doctoral thesis. Swedish University of Agricultural Sciences. Department of Operational Efficiency. Umeå. 24 pp. + 4 separate articles.
[6] Gellerstedt, S. 2002. Operation of the single-grip harvester: motor-sensory and gognitive work. Int. J. For. Eng. 13(2):35-47.
[7] Glöde, D. 1999. Single- and Double-Grip Harvesters - Productive Measurements in Final Cutting of Shelterwood. J. For. Eng. 10(2):63-74.
[8] Gullberg, T. 1995.Evaluating operator-machine interactions in comparative time studies. J. For. Eng. 7(1):51-61.
[9] Harstela, P. 1988. Principle of comparative time studies in mechanized forest work. Scand. J. For. Res. 3:253-257.
[10] Harstela, P. 1991. Work studies in forestry. Silva Carelica 18. 41 pp.
[11] Kellog, L.D. and P. Bettinger, 1994. Thinning productivity and cost for mechanized cut-to-length system in the Northwest Pacific coast region of the USA. J. For. Eng. 5(2):43-52.
[12] Kariniemi, A. 2003. Metsäkonetyön kuva - Ajattelun ja suunnittelun merkitys. In: Kehittyvä puuhuolto 2003 - seminaarijulkaisu. [Description of forest machine work - meaning of consideration and planning]. Käpylä Print Oy, Helsinki. pp. 13-22. (in Finnish).
[13] Kuitto, P.J., S. Keskinen, J. Lindroos, T. Oijala, J. Rajamäki, T. Räsänen and J. Terävä, 1994. Puutavaran koneellinen hakkuu ja metsäkuljetus. [Mechanized cutting and forest haulage]. Metsätehon tiedotus 410. 38 pp. (in Finnish)
[14] Landford, B.J. and B.J. Stokes, 1995. Comparison of two thinning systems. Part I. Stand and site impacts. For. Prod. J. 45(5):74-79.
[15] Landford, B.J. and B.J. Stokes, 1996. Comparison of two thinning systems. Part II. Productivity and costs. For. Prod. J. 46(11/12):47-53.
[16] Lageson, H. 1997. Effects of thinning type on the harvester productivity and on the residual stand. J. For. Eng. 8(2):7-14.
[17] McNeel, J.F. and D. Rutherford, 1994. Modelling harvester-forwarder system performance in a selection harvest. J. For. Eng. 6(1):7-14.
[18] Nonaka, I. and H. Takeuchi, 1995. The knowledge-Creating Company. Oxford University Press. 1995. New York.
[19] Tufts, R.A. and R.W. Brinker, 1993. Productivity of a Scandinavian cut-to-length system while second thinning pine plantations. For. Prod. J. 43(11-12):24-32.
[20] Tufts, R.A. 1997. Productivity and cost of the Ponsse 15-series, cut-to-length harvesting system in southern pine plantations. For. Prod. J. 47(10):39-46.
[21] Ryynänen, S. and E. Rönkkö, 2001. Harvennu-sharvestereiden tuottavuus ja kustannukset. [Productivity and expences associated with thinning harvesters]. Helsinki. Työtehoseuran julkaisuja 381. 67 pp. (in Finnish).
[22] Samset, I. 1990. Some observations on time and performance studies in forestry. Comm. Norw. For. Res. Inst. 43.5:80.
[23] Sirén, M. 1998. Hakkuukonetyö, sen korjuujälki ja puustovaurioiden ennustaminen. [One-grip harvester operation, it's silvicultural result and possibilities to predict tree damage]. Doctoral thesis. Finnish Forest Research Insitute. Research papers 694. 179 pp. (in Finnish).
[24] Wang, J. and W.D. Greene, 1999. An interactive System for modeling stands harvests and machines. J. For. Eng. 10(19):81-99.