Vol. 14. No. 1 January 2003
Anton Bergdahl
Korsnäs, AB
Anders Örtendahl
StoraEnso,AB
Dag Fjeld
Swedish University of Agricultural Sciences
Sweden
The authors are, respectively, Transport Pla nner, Korsnäs AB, Transport Planner, StoraEnso, AB, and University Lecturer, Swedish University of Agricultural Sciences.
ABSTRACT
This study quantifies the economic effect of optimizing roundwood destinations in North Sweden. The effect of planning horizon and delivery precision on costs and revenues are also quantified. The results show that the effect of optimizing roundwood destination varies with the specific application. When minimizing transport costs for a forest company, the transport output (t-km) was reduced by 8-9%. The reductions of transport costs in this case were often in the range of 4-5% (two-week planning horizons). Longer planning periods gave slightly greater cost reductions. Increased net revenues of roundwood sales by an independent forest owner organization were in the area of 1-4% (two-week planning horizons). In this case, however, transport output was often increased by the optimization. Reduced demands to delivery precision made it possible to achieve greater increases in net revenue. Shorter planning horizons had fewer active supply nodes. This situation requires greater spatial variation in procurement areas in order to fill the demand restrictions per period. Only 15-20% of the annual procurement volume per sawmill came from supply nodes where the mill acted as monopsonist.
Keywords: transport output, net revenue, optimization, planning horizon, delivery precision, forest, roundwood.
INTRODUCTION
Forestry transport work in the Nordic countries has undergone considerable changes during the last 50 years. The increasing density of the forest road network has resulted in steadily decreasing extraction distances. At the same time the structural changes in forest products industries have led to a reduction in the number of roundwood destinations, and the average transport distances from forest to mill have therefore increased [6]. The reduction of transport costs has become an important goal in wood procurement activities. Since the importance of transport costs puts restrictions on the number of potential roundwood buyers, theoretical models of perfect competition are not realistic to apply. So while the forest products industries are price takers on the output market, they are often monopsonistic on the input market [12].
Between 45 and 50 million tonnes of roundwood are transported annually by trucks in Sweden. The average distance for these shipments is approximately 80 km, resulting in an annual transport output of approximately 3,500 million t-km [1]. The high number of possible transport combinations makes it difficult to achieve an economically optimal transport organization without the help of computerized decision support tools. These tools include two classes of optimization functions: destination and routing. An optimal destination aims to minimize the loaded transport distance from forest to mill while an optimal routing aims to increase capacity utilization by minimizing the unloaded distance from mill back to forest. In some cases destination and routing functions may also be combined so that the destination of roundwood takes into account important backhaul routes.
Destination of roundwood may be solved as a network model with the application of the classic transport algorithm and linear programming [4, 14]. Routing of timber trucks, however, demands the comparison of a great number of possible combinations and for this reason requires mathematical techniques creating smaller sub-problems by the use of heuristics [10]. While algorithms for general vehicle routing problems have been in use for many years, timber transport represents a special case where the number of restrictions to be filled are large [8]. These have often been applied in research contexts [3, 11]. Examples of successful implementation are also found such as ASICAM in Chile [5, 13] and EPO in Finland [9].
The degree to which these optimization functions have been implemented varies. A major barrier to operational implementation is the amount of daily input required to properly satisfy the optimization restrictions. A key question for further investment in and development of such systems is therefore the economic potential when compared to the existing solutions, something which is affected by both organizational conditions and the system functions. With increasing pressure to reduce mill inventories, however, wood supply is required to become more flexible in order to meet demand fluctuations. At present, typical planning horizons are 2 to 4 weeks for destination and 1 to 2 weeks for routing. Contract periods are therefore becoming shorter and requirements for delivery precision higher. The effects of these trends on the economic potential of transport planning systems are not yet known.
The roundwood production intensity is lower in North Sweden than the rest of the country due to a lower productivity of forest land. This implies that forest products mills require larger procurement areas in this region for the same volume requirement. Most mills are located on the coast, corresponding well with the location of the most productive forest areas. Less productive forests are located inland towards the higher altitudes of the mountains. The uneven distribution of supply and destination nodes reduces the opportunities for backhauling, and thereby the potential for cost savings through improved routing, compared to other parts of Sweden. Additionally, the high concentration of saw- and pulp mills along the coast results in numerous alternative delivery nodes. Together, this makes optimum destination a suitable subject when studying the economic potential of improved transport planning.
Wood supply in North Sweden can be studied from two organizational perspectives. The first is that of the large forest companies (60% of the forest area) with long-term wood supply responsibilities to major mills. The second is that of non-industrial private forest owners associations (40% of the forest area) who act as independent organizations purchasing roundwood from their members and selling to mills on short-term contracts.
Goals
The goal of this study is to quantify the economic potential for optimizing roundwood destination in North Sweden, and the effects of planning horizon and delivery precision thereupon.
METHODS
The goals were fulfilled by comparing actual transport done during selected periods to re-optimized flows of the same supply and demand volumes. The study was performed from two organizational perspectives. The first was that of the forest companies responsible for long-term wood supply of precise volumes to major mills. For this case, the classic transportation problem formulation was applied, targeting at transport cost minimization. The influence of planning horizon was quantified in this context. The second case adapts the transportation problem to forest owners associations. In this case the objective function maximized net revenue for the forest owner's association of the roundwood trade between forests owners and forest products industries. The influence of delivery precision on maximum net revenue was quantified in this context.
Input matrices of historical supply and demand volumes in both cases were collected from Sweden's central database for wood trade and transport (VIOL: Virke-on-line) at the Forestry Data Centre (SDC: Skogsbrukets datacentral). The corresponding matrices of transport distances were collected from the Forestry Viapoint database for North Sweden. This database contains most distances from major road intersections (viapoints) to mills. Where these distances were missing they were supplemented with calculated values from the digital road databases of the Swedish National Survey. These were calculated using the ArcView function Shortest Network Path (SNP). All linear programming was done in the Microsoft Excel spreadsheet with the Premium Solver Platform v3.5.
Case 1 - The forest company
The Forest company case was done with Holmen Forest AB, based in Örnsköldsvik. The study was delimited to the spruce and pine sawlog deliveries for 2000 from Holmen holdings within the counties of Västerbotten and Ångermanland. The total volume of sawlogs transported from these areas during the study period was approx 130,000 m3. This volume was delivered to 24 sawmills.
In order to quantify the effect of planning horizon, data on one year's supply of sawlogs was aggregated in three different ways, each using a different planning horizon. Data on pine and spruce deliveries were kept separate. This resulted in three different levels of aggregation of the data:
- Planning horizon 1 week: 52 sets of one-week periods,
- Planning horizon 2 weeks: 26 sets of two-week periods,
- Planning horizon 4 weeks: 13 sets of four-week periods.
Optimization was done for each data set and separately for pine and spruce. For each optimization the optimized flow was compared to the actual flow in order to calculate the potential effect on transport output and costs. For each optimization, the geographic x- and y- coordinate of each harvesting operation and the road intersection (viapoint position) closest to each harvesting operation was collected. Each distance from mill to viapoint (3201 combinations) was then supplemented with the straight-line distance from the viapoint to the harvesting operation. The straight-line distance was multiplied by a wander factor of 1.62 [2].
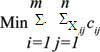
The calculations were solved according to the linear programming formulation of the classic transport problem (e.g. [4, 14]) as shown below.
such that
ΣΧij <= S i i = 1,…,m (1)
ΣΧij >= Dj j = 1,…, n (2)
Χij >= 0, œ" i, j (3)
where the variable Χij represents the volume of roundwood to be transported from harvesting operation i to mill j and cij represents the transport cost per unit volume for the corresponding loaded distance. The number of harvesting operations is m and the number of mills is n. Constraint (1) specifies that the total volume transported from harvesting operation i to mill j may not exceed the available supply (Si) at harvesting operation i for the given period. Constraint (2) specifies that the volume transported from harvesting operation i to mill j must be equal or greater than demand (Dj) at mill j for the given period. Constraint (3) specifies that transport volumes must be non-negative.
For each harvesting operation, the volume and optimal destination for that operation were assigned to the closest viapoint. This created a spatial data set for the network of supply nodes. Based in this network the ArcView program Spatial Movement Analysis was used to mark the smallest convex polygon encompassing all relevant nodes within each sawmill's optimal supply area.
Case 2 - The forest owner association
This case was done with Norra Skogsägarna, a forest owner association based in Umeå. The study was delimited to spruce and spruce-pine pulpwood deliveries with Norra's purchase areas, which are primarily within Västerbotten and Ångermanland counties. In order to quantify the effect of delivery precision, the data for a two-week period of pulpwood deliveries was extracted from 1999, 2000, and 2001. The first two weeks of February were used because this period normally offers the most stable harvesting and transport conditions, making the comparison less susceptible to variation caused by exogenous factors such as climate. The volume of pulpwood transport during these periods was approximately 60,000 m3.
Because of the organizational context of the forest owner organization the optimization input and constraints differ from the forest company case. Because of the larger number and smaller volume of harvesting operations, these were aggregated to the level of the forest districts (29). In order to calculate average distances for the input matrix, the distances from each mill (11) to each of the district viapoints (583) was used (6413 combinations). With an operating area of approximately 64,700 km2, each of these viapoints represents an average area of 111 km2.
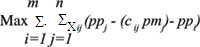
The model maximizing net revenues of roundwood sales to the forest owner association can be written as follows:
such that
ΣΧij <= S i i = 1,…,m (1)
ΣΧij >= Dj ± DP*Dj j = 1,…, n (2)
Χij >= 0, œ i, j (3)
pmj = 0,1
There is an important difference in the model formulation for the forest owner association case and the forest company case. Maximization of the net revenue from a delivery, Χij, from forest owner i to customer j is done by taking the difference between price paid to the forest owner (ppi), and the price received from the customers (ppj). Since prices for wood in contracts may be at roadside or at mill site, a 0-1 variable is included in the model (pmj). This variable takes the value of 0 when the wood is priced at the roadside and the mill is responsible for transport costs. The variable has the value of 1 when the wood is priced at mill site and the association is responsible for transport costs. This ensures that when the price is based on delivery at road side (pmj = 0), the transport cost function from wood transported from forest district i to customer j (cij) is not taken into account. When the prices are based on delivery at mill site, (pmj = 1), the transportation costs are included in maximization of net revenue. The prices paid to forest owners (ppi) is reduced with increasing transport distance to the nearest mill according to an agreed norm. Prices paid by the pulp mill, on the other hand, are determined through negotiations for each delivery contract specifying the prices for roundwood, and the delivery location. As for the previous model, volumes transported to mills cannot exceed actual supply (Si) and the volume delivered mill site j must be at least as large as that specified in the delivery plan (dj).
Furthermore, there is also an important difference in the rigidity of delivery constraints. The cut-to-length system in North Sweden is oriented to bucking sawlogs to order (for specific mill orders) or to value (for maximum log value). Because of this, pulpwood is an unspecified by-product which is possible to deliver to a number of different customers. Deviations in supply from the delivery plans (DP = delivery precision defined as % deviation from the agreed volume) may therefore be compensated for by purchase from other suppliers. It is therefore possible to relax the second constraint (2).
In this case, three scenarios were compared.
These include:
- the actual transport output
- the optimized transport output, assuming
strict adherence to the delivery plan
(Dj ± 0%)
- the optimized transport output, allowing 10 %
deviation from the delivery plan (Dj ± 10%)
RESULTS
Case 1 - The forest company
The sum of actual transport output for pine and spruce sawlogs during the study period was 8,084,453 and 3,630,059 t-km, respectively. After the optimal destination of two-week horizons, the transport output was 7,451,291 and 3,285,108 t-km for pine and spruce, respectively. Hence, the destination of wood proposed by the optimization model represents a 8-9% reduction in transport output. The average transport distance for the actual work for pine and spruce was 91 and 63 km, respectively. The corresponding average transport distances after optimization (using two week horizons) were 84 and 57 km, respectively.
On average (all three horizons), the optimization models showed a potential to reduce transport costs by 5.3%. The potential reduction was largest for the longest planning horizons (Figure 1). The relative cost reduction was larger for spruce sawlogs than pine.
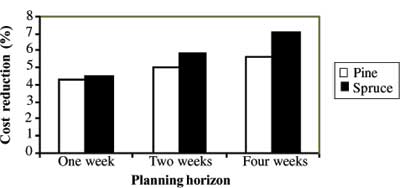
Figure 1. The potential reduction of transport costs through optimal destination of sawlogs for varying planning horizons and tree species. Based on one year of wood supply from Örnsköldsvik and Lycksele regions of Holmen Skog.
The average number of active supply and destination nodes were highest for the data sets with longest planning horizon (Table 1). The number of active supply nodes per data set was greatest for pine sawlogs, the number of active destination nodes was greatest for spruce sawlogs.
Table 1. The average number of active supply nodes (harvesting operations) and destination nodes (mills) per planning horizon and species. Based on one year of wood supply from Örnsköldsvik and Lycksele regions of Holmen Skog.
| Planning horizon |
||||||
| One week | Two weeks | Four weeks |
||||
| Pine | Spruce | Pine | Spruce | Pine | Spruce | |
| Supply nodes | 37.4 | 33.8 | 65.1 | 49.5 | 81.8 | 75.7 |
| Destination nodes | 11.1 | 13.8 | 12.8 | 15.8 | 13.7 | 18.1 |
Linear regression was used to quantify the relationship between the number of transport combinations (operations and mills) and the relative transport cost reduction. According to the coefficients calculated by the analysis, the number of alternative mills in the optimization problem was the main determining factor for cost reduction (below).
RCR = 0.523 + 0.02982 (SN) + 0.21698 (DN)
n = 141 optimizations
R2 = 0.26 p < 0.001
RCR = relative transport cost reduction in percent
SN = number of supply nodes (harvesting operations)
in the optimization
DN = number of destination nodes (mills) in
the optimization
The optimal supply areas for one year of two-week optimizations were mapped according to minimum convex polygon encompassing the x- and y- coordinates of the relevant viapoints. A map of all mills per species involved so much overlapping that it was difficult to see the individual supply area. Even when the number of mills was reduced to the five largest per species, this mapping showed considerable overlapping of procurement areas (Figure 2).
An inspection of the individual supply nodes (viapoints) in the two week data set showed that, optimally, most nodes supplied multiple demand nodes throughout the year as periodic demand varied. Only 21.5% and 14.6% of annual procurement volumes, for pine and spruce mills, respectively came from supply nodes which were always destined for that particular mill.
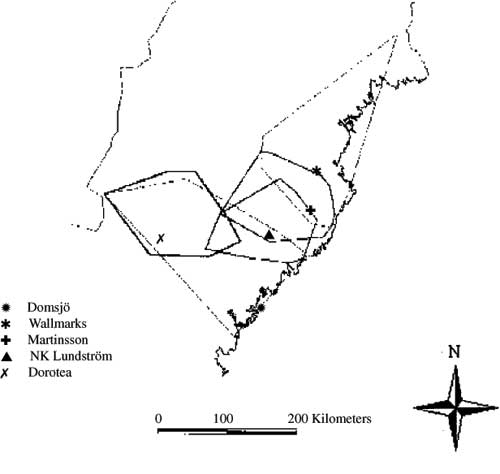
Figure 2. The optimized procurement areas of the 5 largest pine sawmills in the study. Based on minimum convex polygons encompassing peripheral two-week supply nodes for one year of wood supply from Örnsköldsvik and Lycksele regions of Holmen Skog.
Case 2 - The forest owner association
The effect of optimization of pulpwood destination on net revenue varied with the level of delivery precision demanded. For a strict adherence to the delivery plan (0% deviation), optimization resulted in an average increase of net revenue of 2.2%. Allowing a 10% deviation in the optimization model resulted in an average increase of net revenue of 6.4%. The relative net revenue for the actual trade and optimized trade for each individual year are shown in Table 2.
Table 2. A comparison of relative net revenue for pulpwood trade on the Forest Owners Associations net revenue (%) between actual and optimized trade and transport. Three two-week periods with varying deviation (0, 10%) from the delivery plan for Norra forest owner association.
| Relative net revenue (%) |
|||
| Actual transport | OPT: Dj ± 0% | OPT: Dj ± 10% | |
| 1999 | 100 | 104.1 | 106.9 |
| 2000 | 100 | 101.1 | 106.9 |
| 2001 | 100 | 101.4 | 105.4 |
The changes in pulpwood destination for the two optimization alternatives have direct consequences for transport output. While a classic minimization of transport cost results in a 9.5% reduction of total transport output, the maximization of net revenue resulted in a 20-22% increase in total transport output (Table 3).
Table 3. The transport output per two-week period for actual transport and two alternatives of optimal destination according to net revenue (Dj ± 0%, Dj ± 10%). The transport output for the classic transport formulation of minimum transport costs (min. cost with Dj ± 10%) is also included. Norra Forest Owner Association.
| Transport output (t-km) |
||||
| Study year | Actual transport | OPT: Dj ± 0% | OPT: Dj ± 10% | OPT / Min. cost Dj ± 10% |
| 1999 | 2058720 | 2951924 | 2662454 | 1714711 |
| 2000 | 1270985 | 1244209 | 1547109 | 1199444 |
| 2001 | 1500229 | 1506871 | 1531090 | 1463129 |
DISCUSSION
This study indicates that for the distribution of supply and demand nodes typical for North Sweden, there is a considerable potential to reduce transport output. The economic effect of this potential, however, varies with the assumptions of the application. On average, the calculated value for reduced transport output was 8-9% in both studies when minimizing transport costs. The resulting reductions of transport costs (two-week planning horizons) were typically in the range of 4-5%. Increased net revenues for the forest owners association in these cases (two-week planning horizons) were in the area of 1-4%.
The methods used to calculate the potential economic effect are quite simple and have certain limitations. In this study, historical patterns of roundwood trade and transport were "re-planned" to attain a more efficient flow. These results, however, may not be directly transferable to future transport. This is because transport work is influenced by real-life conditions such as: daily variation in road bearing capacity, the progressive filling of transport quotas and unexpected increases in demand. These variations in operational conditions are difficult to predict. The methods used in this paper may therefore overestimate the economic potential because the operational conditions influencing transport have not been included as restrictions in the optimization models.
Case 1 - The forest company
In the results of the forest company case the economic potential of destination decreased with a shorter planning horizon. The explanation for this decrease is logical; the fewer the number of alternative destinations, the lower the potential for finding better alternatives through optimization. The data sets with one-week planning horizons include a lower number of mills receiving roundwood than four-week horizons. The number of alternative mills for delivery was also smaller for pine than spruce. At the same time, the number of harvesting operations was greatest for pine. However, the slope of regression coefficients showed that it was the number of mills, not the number of harvesting operations that had the greatest influence on the economic potential
A particularly important result of this study is the geographical overlapping of the optimal procurement areas. Traditionally, forest companies have had long destination horizons for sawlogs (four weeks or longer) because of the different customers' specifications of length and diameter distributions. However, the optimization of the data set for shorter planning horizons clearly shows a low proportion of supply nodes in a monopsony situation. In this context the transition from monopsony to oligopsony and perfect market conditions can be quantified by the use of factor market share (the percent of available input factor being purchased by a particular manufacturer). Haartveit and Fjeld [7] show some examples for the development of this variable. While it is expected that the factor market share increases towards the center of the procurement area, in very few cases does a true monopsony condition exist. There are a number of possible reasons for the large degree of overlapping of procurement areas. The most logical would be varying demands and prices from the sawmills. Demand variations are translated through price gaming into procurement volumes; resulting in growing and shrinking procurement areas over time. However, these studies are based on actual transported volumes, which because of the unknown inventory levels at each mill, cannot be equated to actual roundwood demand volumes. As well, supply volumes within the same procurement area vary with seasonal climatic conditions. The varying proximity to the coast, for example results in an even influence on supply volumes from the different areas. This again leads to a shift of procurement focus between areas. In general, the shorter planning horizons have fewer alternative supply nodes. This then requires greater spatial variations in procurement areas in order to fill the demand restrictions per period.
Case 2 - The forest owner association
The forest owner association case showed that optimizing destination in a wood trade perspective also yielded a considerable economic potential, however with different consequences for transport output. Unexpectedly, the pricing mechanisms of the wood trade resulted in an increase in transport output for the maximization of net revenue. Presumably, this is a result of the optimization assigning slightly longer transport distances where the mill pays for transport. A closer examination of a sample of these, however, showed no shipments of doubtful efficiency.
In those cases where restrictions for delivery precision were relaxed (changing allowable deviations from delivery plan from ± 0% to ± 10%) the potential economic effect was larger for all three years. This can be explained by two factors. First, relaxing delivery precision decreases the need to compensate extreme supply variations with accordingly drastic variation in procurement areas. Second, a check of all three years showed a slight but permanent re-assignment of volumes with long transport distances to closer mills.
The result that increased transport output yielded an increased net revenue is a condition which should be examined in more detail under varying contexts. For this reason some supplemental modeling (1999 data) was done in order to test this. A longer horizon (eight weeks) was applied in hope of a more stable result [15]. In this case, the transport output increased by only 1 % for the two net revenue maximizations, and decreased by 6% for the transport cost minimization. The most interesting aspect here, however, was the variation in economic potential. The increase in net revenue after optimization for high delivery precision (Dj ± 0%) was 2.2 and 8% for two- and eight-week periods, respectively. The increase in net revenue after optimization for reduced delivery precision (Dj ± 10%), however, was 6.4 and 9% for two and eight week periods, respectively. When deliveries have high precision, the extra effect of a greater number of alternative combinations resulting from a longer planning period was clearly important. However, while the reduced delivery precision created a situation with some additional flexibility for the forest owner association, the extra effect of a longer period is decreased.
Implementation aspects
Even with coastal location of the studied region, the cases indicate a high economic potential for optimized destination. The current logistics trends (shorter planning horizons and higher delivery precision) aimed at reducing inventory costs, however, also reduces some of the flexibility that optimization tools rely on for improvement of transport costs.
The development need for such decision support tools is increasing because of the pressure to reduce inventory and transport costs in wood procurement. The transition of wood procurement strategies from simple cost- minimization to adaptability and control enhancement requires greater overview and precision. Development of a generalized transport planning package has not yet succeeded. Specific goals and conditions vary between regions and organizations and the demand for customized planning tools is therefore high.
The probability for successful implementation increases with the stability of operational conditions and the simplicity of the planning function. Under stable conditions relatively advanced tools will function well. While under changing conditions, the number of restrictions and real-time operational data increases. Destination planning is the simplest of decision support tools. Requirements concerning both computational capacity and operational data are limited. Earlier, the limiting factor to the configuration and implementation of such tools was the necessary expert competence. Now, however, the development of more user friendly tools such as the Microsoft Excel-based Solver function, makes it possible for non-specialists to feel comfortable with spreadsheet modeling and develop organization-specific applications. For groups with responsibility for roundwood purchase and sale over large geographic areas the applications have proven useful for support during price negotiations.
ACKNOWLEDGEMENTS
The studies were financed by both Holmen Skog and Norra Skogsägarna. The authors thank particularly Sören Petterson of Holmen Skog and Patrik Jonsson of Norra Skogsägarna for for inspiration, help and advice in the study.
AUTHOR CONTACT
Dr. Fjeld can be reached by e-mail at --
Dag.Fjeld@ssko.slu.se
LITERATURE CITED
[1] Anon. 2000. Statistical yearbook of forestry 2000. National Board of Forestry, Jönköping 2000. 19 pp.
[2] Bergdahl, A. 2002. Optimal destination of saw timber in northern Sweden - important factors for potential cost reduction. MSc. Thesis No. 53 Swedish Univ.of Agri. Sci. Dept. of Silviculture, Div. for Forest Technology. 43 pp.
[3] Carlsson, D. and M. Rönnqvist. 1998. Tactical planning of forestry transportation with respect to backhauling. LiTH-MAT-R-1998-13. 19 pp.
[4] Dykstra, D. 1992. Mathematical programming for natural resource management. McGraw-Hill Inc. New York.
[5] Epstein, R., R. Morales, J. Serón and A. Weintraub. 1999. Use of OR Systems in the Chilean Forest Industries. Interfaces 29(1): 7-29.
[6] Fohlin, Å. and M. Silver 1997. Quantitative models for sawmill location. Luleå Tekniska Universitet, Institutionen för Industiell ekonomi och samhållvetenskap. Licensiate Thesis 1997:42. 115 pp.
[7] Haartveit, E. and D. Fjeld 2000. Interregional variations in transport net geometry - an analysis of wood procurement areas for norwegian sawmills. In: Sjöström, K. [Ed.] Logistics in the forest sector. Timber Logistics Club, Helsinki 2000. Pp. 165-188.
[8] Karanta, I., O. Jokinen, T. Mikkola, J. Savola and C. Bounsaythip. 2000. Requirements for a vehicle routing and scheduling system in timber transport. In: Sjöström, K. [Ed.] 2000. Logistics in the forest sector. Timber Logistics Club. Helsinki (2000). Pp. 235-251.
[9] Linnainmaa, S, J. Savola, O. Jokinen. 1994. EPO A knowledge base system for wood procurement management. 7th Annual Conf. on Artificial Intelligence, Montreal, August 21-23, 1995. Pp. 107-113.
[10] Palmgren, M 2001. An approach to log truck scheduling. In: M. Palmgren and M. Rönnqvist [Eds]. Logistik och optimering inom skogsindustrin. [Logistics and optimization in forest industries]. Workshop. Åre, Sweden. 11-14 March, 2001. LiTH-MAT-R-2001-16: 95-106.
[11] Rönnqvist, M. and D. Ryan. 1995. Solving truck dispatch problems in real time. Proc. 31st Annual Conf. of the Op. Res. Soc. of New Zealand. Wellington, NZ August 31-September 1, 1995. Pp. 165-172.
[12] Trömberg, E. and B. Solberg 1998. A comparative analysis of structures in European roundwood and forest products markets. In: Solberg, B. and A. Moiseyev [Eds.]. 1998. Analyzing structural changes in roundwood and forest products markets in Europe. Eur. For. Inst. Proc. No. 26, (1998). Pp. 73-104.
[13] Weintraub, A., R. Epsteinj, R. Morales, J. Seròn and J.A Traverso. 1996. A truck scheduling system improved efficiency in the forest industries. Interfaces 26:1-12.
[14] Winston, W L 1995. Introduction to mathematical programming: applications and algorithms. Duxbury Press, Belmont.
[15] Örtendahl, A 2001. An analysis of pulpwood transactions with the NETRA transport optimisation program. MSc. Thesis No. 50, Swedish Agric. Uni. Dept. of Silviculture, Div. for Forest Technology. 35 pp.