
Vol. 14. No. 1 January 2003
Hamish Marshall
GlenMurphy
Oregon State University
Corvallis, USA
The authors are, respectively, Graduate Research Assistant and Professor in the Forest Engineering Department, Oregon State University.
ABSTRACT
The average log size in many parts of the world is getting smaller and it is becoming increasingly time consuming and expensive to individually scale each log. Truck scaling of various forms, including the use of weighbridges, is becoming increasingly popular.
Understanding the factors affecting the accuracy of weighbridge systems is vital if measurement errors are to be minimized. We used a mixture of interviews with weighbridge operators, suppliers and government weights and measures staff in New Zealand along with experiments on a small set of weighbridges to identify, and where possible quantify, the most important factors affecting weighbridge accuracy. In our paper we have broken down the sources of variation into mechanical, environmental, truck, human and system-related. It is difficult to put a figure on the possible magnitude of these combined sources of variation, however, interviews, experiments and calculations show that it could be as much as 4% of the payload weight - although it is likely that some sources of variation will act in opposite directions and cancel each other out.
Keywords: truck-scale, weigh-scaling, weighbridge errors, forestry, accuracy.
INTRODUCTION
A credible weight system is essential for any industry using the measurement of weight as a benchmark for sale of a product. In the forest industry a number of different approaches to selling wood by weight can be found. Approaches include: sale solely by weight, sale by weight with an adjustment for moisture content of the wood, and sale by volume based on a weight-volume conversion factor (weigh scaling).
Buying/selling logs solely by weight is used in some parts of the southern USA. It encourages landowners and timber harvesters to get timber to a mill quickly, before it loses moisture and thus weight. Mills purchasing timber benefit from fresher, although heavier logs too, because they contain less stain and decay and fewer wood destroying insects [7].
The Chilean forest industry buys/sells pulplogs by weight after an adjustment is made for moisture content of the wood. It is estimated that approximately 80% of Chilean pulpwood (~30 % overall wood hauled) crosses a weighbridge [12]. Obtaining the adjustment factor for moisture content requires less effort than obtaining the volume conversion factor for the next method (weigh scaling).
Volume is one of the key metrics used by forest growers in many parts of the world to determine wood fiber quantity for harvesting, stand production estimates and log sales. Weigh scaling is the use of weight to gain the equivalent volumetric measure using weight-to-volume conversion factors.
Weigh scaling is used extensively in North and South America, New Zealand, Australia, Scandinavia and Europe. In New Zealand, it is estimated that 85% of logs are measured using weigh scaling [8]. Over 95% of the timber harvested in the interior of British Columbia is weigh scaled [2]. Weigh scaling is becoming increasingly popular in the United States of America; particularly in the Southeast states where pulpwood transactions by weight are the standard in the industry [9].
In "Procedures for the Measurement of Roundwood" it is stated that, when using a weigh scale system, individual truckloads of wood could be expected to be within 10% of true volume 95% of the time [10]. It is also noted that "accuracy increases as more truckloads are measured because the errors cancel out. With many truckloads, weigh scaling generally achieves volume estimates within 2% of true volume" in New Zealand.
The British Columbia "Scaling Regulation" implies "that for a weigh scale system, 95% of the time the estimated volume in one year will be within 1% of the actual volume (which is the same as within 1% of the volume you would determine if you scaled every piece)" [2].
Part of the "error" in weigh scaling systems will be due to the sampling method used to determine volume conversion factors. Another source of error will be due to errors in determining payload weights. This paper does not deal with sampling method "errors" in further detail.
Whether weight, or volume calculated from a weight measure, is used as a basis for payment, the accuracy and integrity of a weighing system is critical to both the buyer and seller. If the weighbridge system records payload weights that are too high, the buyer will be paying for wood that he/she is not receiving. If, however, the weighbridge is under weighing, the forest owner will be missing out on potential revenue. This can, and has, produced major sources of conflict between forest owners and wood users in the forest product industry in various parts of the world.
The purpose of this paper is to identify the sources of variability of weights from weighbridges and determine how these can lead to potential measurement errors within the forest industry. The paper uses data collected from several weighbridges used by some companies in New Zealand. Although this paper is based on limited New Zealand experience, in general terms the results are relevant to forest companies operating weighbridges in other countries, as well as to other industries that use weighbridges to obtain a measure of quantity.
Weighbridges and Weighing Systems
Weight as a measure of a quantity has several benefits. Unlike volumetric measurement, weight can measure quantity without the use of a correction factor for the material's bulk density, weighing does not require contact with the material and with the correct system weighing is fast, accurate and objective, particularly in long-run situations where errors in individual measurements can be neglected [11].
Weighing systems can take several forms but the most common design includes one or more load cells that support (or suspend) a platform (or weigh vessel), a junction box, and a weigh controller. When a weight is applied to the platform, a portion of the load is transmitted to each load cell. Each load cell sends an electrical signal to the weigh controller via the junction box which sums the signals from a number of cells. The weigh controller converts the summed signals to a weight reading [3].
One of the most common weighing systems used in the bulk transportation industry is the weighbridge. Weighbridges are used throughout the world as a way of quickly assessing the weight that a truck or train is carrying.
A weighbridge is, ideally, built to weigh a fully loaded truck in a single weighing with a high degree of accuracy. This can sometimes be difficult in the forestry industry, particularly for off-highway operations where "over-weight", "over-length" loads can weigh over 100 tonnes and be over 45 meters long with triple trailer configurations. Weighbridges rated up to 60 tonnes and 21 meters or less in length are more likely to be used for on-highway legal loads.
The weight of the payload, including the weight of the truck, is measured by first driving the truck onto the weighbridge; this weight is referred to as the gross weight. To obtain the weight of the payload (the net weight) the tare weight (the weight of the empty truck) must then be subtracted from the gross weight.
Inaccuracy in payload weights can be created by either inaccurate gross weights or variability between the tare weight of the truck and the actual weight of the truck (gross weight minus payload) at the time of gross weighing. The latter can be minimized by re-tareing the truck immediately before the truck is loaded or immediately after the truck is unloaded. This is common practice in industries where the weighbridge is close to either the loading or unloading area; for example, in a quarry or milk factory.
Due to large distances between the loading site, weighbridge and unloading site or large daily usage of weighbridges (e.g., one of the major forestry weighbridges in New Zealand handles over 500 loads per day), the process of tareing in and out is sometimes impractical in forestry. Instead some weighbridges in the forestry industry use a system of stored-tare weights.
The stored tare weight system works by re-tareing trucks at either a regular time interval, which in the New Zealand forest industry ranges from 1 week to 12 months, or at the next available opportunity after the time interval is up. An alternative approach is to use a "random time within a window"; for example, within a 2 week window at the end of a one-month interval. In some cases, the stored tare weight may have been measured on a different weighbridge to the one where the gross weight is obtained. We recognize that a stored weight system may be impractical in regions where ice and snow may be present in winter months, sometimes adding tonnes to the truck weight.
At this stage in the paper, it should be noted that stored tare weight systems are illegal, or at least limited in how they can be applied, in a number of countries and in some states within the USA. They are more likely to be used as the basis for internal transfer payments within a forest enterprise or where there is a special agreement between buyer and seller.
This weighing system, combined with the environment in which weighbridges operate within the forestry industry, can mean that both the gross and tare weight may be subject to several sources of variation leading to inaccurate payload weights.
SOURCES OF VARIATION
While platform weighbridges can be said to give the highest levels of accuracy for vehicle weights (compared with single axle weighbridges or portable wheel axle weighers) no weighbridge can ever be totally accurate all of the time [4]. Sources of variation effecting gross, tare and stored-tare weights can be split into five main categories; mechanical (to do with the weighbridge), environmental, truck-related, human and system related.
Mechanical Variation
When weighbridges are being tested and legally stamped for approval it is recognized that they are comprised of mechanical and electronic components, which have inherent variability. The weights and measures laws of various countries and states specify the maximum level of deviation in reading that is permitted from known test weights. For example, for vehicle loads in New Zealand between 10 and 40 tonnes it is +/-40 kg. As a comparison, the US National Institute of Standards Handbook 44 specifies an acceptance tolerance of 0.1% (e.g. +/-40 kg on a 40 tonne load) [13].
Repeatability Tests
Two sets of tests were carried out on two different weighbridges (bridges A and B) in the North Island of New Zealand to provide a general indication of the variability in readings that can occur given that the same weight is repeatedly applied to the weighbridge. Both weighbridges A and B were made up of a large rear platform and a smaller front platform. Weighbridge A had four digital load cells supporting the front platform section and four digital load cells supporting the rear section. Weighbridge B had four digital load cells supporting the front section and eight digital load cells supporting the rear section. Each weighbridge provided a single combined reading, to the closest 20 kg, from both the rear and front platforms, if used. Both weighbridges A and B were checked, using standard test weights, a week after the repeatability tests were completed and found to be within legal tolerances; that is, within +/- 40 kg.
The first set of tests was carried out to measure the variability caused by different truck locations on the large rear platform of each weighbridge. Two vehicles were used in this test; a gravel truck weighing approximately 31 tonnes when loaded and a fire-truck weighing approximately 10.5 tonnes when loaded. It should be noted that the fire-truck tests on weighbridges A and B were done on different days and with slightly different loads. Tests on individual trucks and weighbridges were done in a timely manner so that fuel usage should not have been a significant factor.
The fire-truck was first weighed with the rear axle on the rear end of the rear platform. The truck was then driven off the bridge to allow the bridge to return to zero; it was then moved forward and reweighed with the rear axle one meter closer to the front of the bridge. This was repeated until the front axle of the truck was level with the front of the rear platform. A 60 kg difference was found in the readings depending on where the truck was located for Bridge A (Figure 1) and 20 kg for Bridge B (Figure 2). The same test was repeated on Bridge B using the 31 tonne gravel truck. In this case the variation in reading was found to be 40 kg (see Figure 3).
Figure 1. Effect of fire truck location on Bridge A.
("R + 3" = Rear axle is 3 meters forward from the rear end of the weighbridge platform)
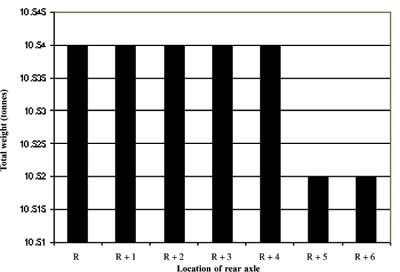
Figure 2. Effects of fire truck location on Bridge B.
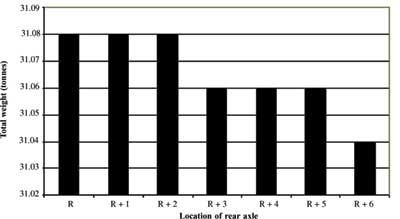
Figure 3. Effect of gravel truck location on Bridge B.
The second set of tests was carried out to measure the variation in multiple readings obtained for the same truck measured in the same location on each bridge. The fire truck was repeatedly measured; twenty-one times for bridge A and sixteen times for bridge B (Figures 4 and 5). In both cases the front axle was located on the front platform and the rear axle on the rear platform. Between measurements the truck moved off the bridges to allow them to re-zero. Limited availability of both the fire-truck and bridge B precluded us from having the same sample size for both bridges.
It was found that for Bridge A there was a 60 kg variation in readings of the rear platform and a 20 kg variation in readings of the front platform. For Bridge B there was a 40 kg variation in the readings of the rear platform and a 20 kg variation in the front platform. Overall there was an 80 kg and 60 kg variation in the combined platform readings for Bridges A and B respectively. Once again this test was repeated on Bridge B using the 31 tonne gravel truck. Over the sixteen repeat measurements (Figure 6) there was a 40 kg variation in the readings of both the rear and front platforms, as well as the combined platform readings.
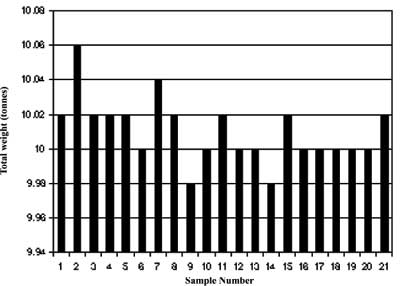
Figure 4. Repeatability tests - Bridge A - Fire Truck.
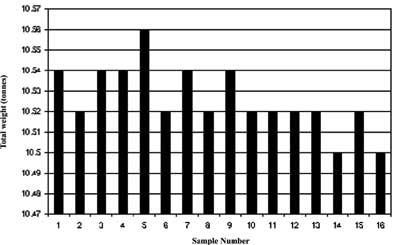
Figure 5. Repeatability tests - Bridge B - Fire Truck.
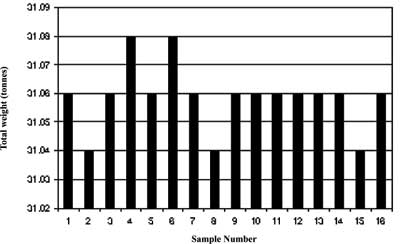
Figure 6. Repeatability tests - Bridge B - Gravel Truck.
Drift in accuracy with time
Interviews with staff from three New Zealand weighbridge testing and maintenance companies found that poorly maintained weighbridges have been tested where readings were grossly inaccurate; e.g., an error of over two tonnes (~5% on a 40 tonne load). One of the companies indicated that a drift of +/-1% was not unexpected for a well-maintained bridge over a twelve-month period. The frequency of maintenance and testing of weighbridges is covered later in the section on Systems-Related Variation. It is important to note at this stage, however, that weighbridges do drift out of calibration and that the same load may give different readings on different weighbridges.
As an indicator only of the size of these differences, mention is made of three small (poorly-replicated) tests that were done over a six-month period on four nearby weighbridges; A and B referred to above and two additional bridges, C and D. In the first test, calibrated test weights totaling 23 tonnes were placed on weighbridges A, C and D. All of the weighbridges weighed low and gave readings which ranged from 20 kg to 300 kg under weight. In the second test, 23 tonnes of calibrated test weights were placed on weighbridges B and D. One bridge weighed 20 kg under weight and the other bridge 60 kg over weight. In the final test, the 23 tonnes of test weights were placed on a truck (total weight of truck and test weights unknown but approximately 41 tonnes) and weighed on weighbridges B, C and D. The three weighbridges varied in readings by 200 kg (~0.5%).
Environmental Variation
Most weighbridges in the forestry industry are open to the environment. Environmental factors such as moisture and dirt, wind loading, shock loading, vibration and large temperature changes can produce errors in the load cell observation, thereby producing incorrect measurements.
Moisture and dirt
If a weighbridge is not regularly maintained a build up of dirt can affect the electronics, increase the wear on the metal components of the load cells, and physically stop the bridge settling as far as it should with a loaded weight.
Interviews with weighbridge operators indicated that mud build-up on logging trucks can add 300 to 500 kg of extra weight depending on the truck configuration. A truck weighed on a wet day can weigh significantly more that if it was later re-weighed during a dry period.
To test the hypothesis that trucks on wet days weigh more than trucks on dry days, seven trucks were randomly selected for analysis. The selected trucks included a range of both on-highway and off-highway configurations. For a five-month period, spanning from mid-winter to early summer, tare weight data, along with the comments on whether the day was wet or not was collected.
Table 1. Effect of Wet Weather on Truck Tare Weights.
| Truck | Wet Days | Dry Days | |||
| Mean Weight (tonnes) | Number of measurements | Mean Weight (tonnes) | Number of measurements | Difference (kg) | |
| A | 37.35 | 6 | 37.02 | 8 | 330 |
| B | 36.34 | 9 | 36.17 | 18 | 170 |
| C | 16.42 | 3 | 16.29 | 9 | 130 |
| D | 16.37 | 3 | 16.29 | 8 | 80 |
| E | 14.66 | 7 | 14.50 | 11 | 110 |
| F | 14.63 | 8 | 14.52 | 4 | 110 |
| G | 12.20 | 7 | 12.14 | 11 | 80 |
| Overall | - | 43 | - | 69 | 140* |
Table 1 provides a summary of the results. It was found that trucks on wet days weigh approximately 140 kg more per truck than on dry days. Comparisons for individual trucks show no statistically significant difference between wet and dry days. Logic would tell us, however, that bigger trucks should collect more mud and should weigh more but this could not be proven statistically from this sample.
Washing the truck and load before driving onto the weighbridge is one way of overcoming the problem of build up of detritus on trucks. For example, some dairy companies in New Zealand require their milk tankers to be washed before weighing.
Wind
Allowance should be made for the effects of wind pressure on the load [1]. Weighbridge operators comment that wind blowing on the side of a truck can affect the readings, up or down, by 20 kg or more - even for an empty logging truck. If the wind is blowing horizontally the force caused by the wind is likely to cause a shift in the center of gravity of the load and a redistribution of weight [11] onto the wheels on the leeward side of the truck - possibly resulting in a variation in weighbridge reading, depending on how evenly balanced are the load cells supporting the weighbridge. If, however, the wind is blowing at a downward angle onto the truck there will be both a redistribution of weight to the leeward side and an increase in overall "weight" measured by the weighbridge - caused by the downward force component of the wind. Locating the weighbridge inside an enclosure is one way of minimizing the effects of wind.
Wind drag equations, used in the design of aerodynamic vehicles, can be used to calculate how large a force would be theoretically exerted on the side of a truck. These forces can then be transformed into horizontal and vertical forces through fundamental engineering principles.
A well-accepted formula for wind drag [17] is:
Force = ρ *CD *A*V2 ;
Where: ρ = air density,
CD = a constant depending on aerodynamic
shape of the object,
A = the "frontal" area of the object, and
V = the wind velocity vector.
This equation was used to calculate the additional weighbridge loadings for a small sample of logging truck configurations caused by a wind blowing at a 5o downward angle, as might be found if a weighbridge were situated in the bottom of a small valley and was subjected to downhill winds. A CD value of 1.35, part way between that of a truck (front on) and a motorbike, was used in the analyses for empty logging trucks. A CD value of 0.90, similar to that of a truck (front on), was used for loaded logging trucks. The areas of the four truck configurations were calculated from photos of a known scale (see Figure 8). The results for the four truck configurations are shown in Table 2 and Figures 7 and 9.
Wind can increase the tare weight of an empty logging truck by over 50 kg and of a loaded logging truck by over 80 kg. The actual values will depend on the wind speed and trucking configuration as demonstrated in Figures 7 and 9. Further studies are required to confirm appropriate Cd values for these calculations.
Temperature and Humidity
Temperature and humidity are known to affect the load cells used in weighbridges. Most modern weighing systems have temperature compensation systems, however. Provided the temperature range of these compensation systems exceeds the expected range of ambient and operating variations that the weighbridge is operating under there should be little effect on weighbridge readings [3].
Table 2. Effect of a 28 km/hr (15-knot) wind loading on calculated weighbridge readings.
| Unloaded Truck | Loaded Truck |
|||
| Truck Configuration | Area (sq.m.) | Increase in weight reading (kg) | Area (sq.m.) | Increase in weight reading (kg) |
| Shorts Truck | 16.4 | 14 | 35.9 | 21 |
| Longs Truck | 15.0 | 13 | 35.2 | 21 |
| Bailey Bridge | 19.7 | 17 | 36.3 | 21 |
| Self Loader | 23.3 | 20 | 54.3 | 32 |
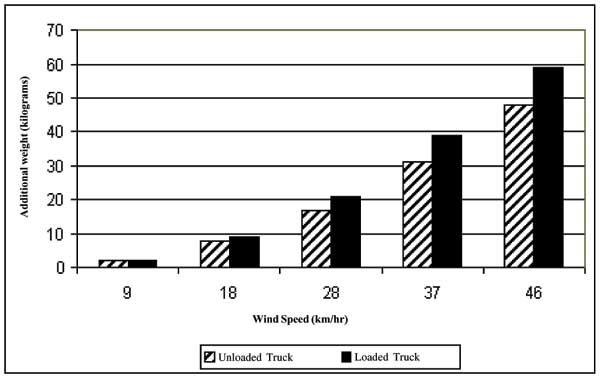
Figure 7. Effect of wind loading on weighbridge readings - Bailey Bridge configuration.
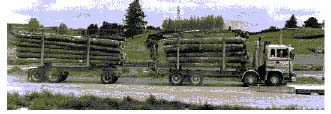
Figure 8. Self-loading truck with a loaded "frontal" area of 54.3 m2 about to drive onto a platform weighbridge in New Zealand.
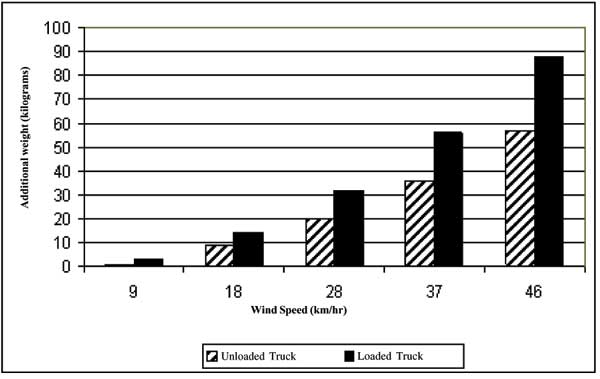
Figure 9. Effect of wind loadings on weighbridge readings - self-loading configuration.
Shock Loading and Vibration
Shock loading on weighing systems occurs when a heavy object is dumped onto a weighing system, the platform is bumped by a vehicle or is otherwise disturbed. Most load cells can withstand up to 200% of their capacity in side loads. If an extreme sudden loading is applied to a weighbridge the load cells should be checked and recalibrated [3].
Vibration from processing equipment and other sources such as the movement of other trucks near the weighbridge can cause the load cells to measure the weight of material as well as vibration that is transmitted to them. Vibration effects can be reduced by isolating the weighing system from vibration sources, where possible, or by using weighing system instrumentation that automatically removes vibration effects [11].
Truck Related Variation
Most logging trucks carry a range of "removable" equipment such as tire irons, chains and tool box and along with the spare tires and fuel these can have a substantial effect on the weight of the truck. For example, spare tires weigh about 120 kg each.
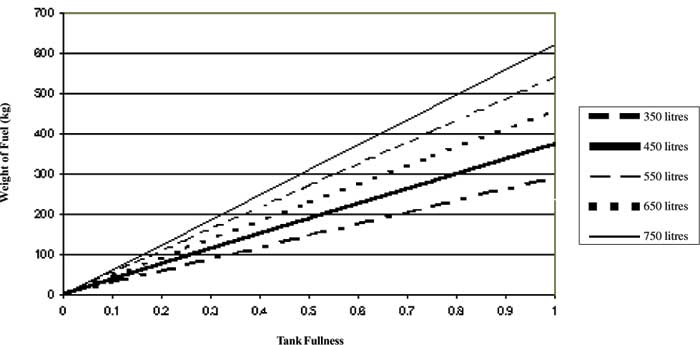
Fuel has been identified as one of the major variables in truck weight. Depending on fuel tank capacity and level, fuel can account for a variation of up to 600 kg for some logging trucks (Figure 10).
If a stored-tare weight system is used it is important to record each time the truck is weighed whether the truck is carrying spare tires and what its fuel loading is.
Another variable, which can effect tare weight variation, is the truck configuration. If the truck is too long to fit onto the weighbridge it has to be weighed in several increments. If access to the bridge is not perfectly level, additional weight will be registered on each reading due to axle "shifts" and the shifts in the centers of gravity of the truck and trailer [4]. For example, in a copy of an old memo given to the authors by a weighbridge operator, mention is made of a study on the effect of "end-and-end" weighing of a 10 ton "motor lorry" where the approaches to the weighbridge were not perfectly level. The study found that a 74 lb (32 kg) increase in weight due to axle shift and a 106 lb (47 kg) increase in weight due to a 1 inch (25 mm) difference in the levels of the center of gravity were to be expected.
Human Variation
Variation in weight readings caused by humans can fit into two categories; driver errors and bridge operator errors.
Driver "errors"
Since the weight of New Zealand (North Island) truck drivers is somewhere between 70 kg and 120 kg, whether a driver is in or out of the cabin during the weighing process can cause variation in both the gross and tare weights. This problem is doubled if the truck is carrying a passenger; e.g, when the driver is showing a new driver the route.
Adhering to the "driver out during weighing" policy where practical or recording whether the driver is in or out is the best way to help reduce any variation that could be caused by the driver.

Display large image of Figure 10
Figure 10. Effect of fuel loading on truck weight variation.
Although not an error as such, another source of variation in weighbridge weights is the deliberate lightening of loads before a tare weight is taken. Most companies and countries would see this as fraud.
Bridge operator "errors"
Bridge operator error, although rare, can occur especially when the bridge is under high demand. The sorts of errors that have been occasionally observed are:
- the back axle was not correctly on the bridge
- when split weighing a load an axle was reweighed when not properly off the bridge
- the wrong truck or trailer identification number was entered into the computer for the load that was being weighed; thereby leading to the wrong stored-tare weight for net payload calculations.
Some weighbridge systems automatically detect whether the truck is fully on the weighbridge or not, thereby minimizing the chances of the first two types of error occurring. Some weighbridge systems also automatically read an identity tag for the truck, thereby minimizing the chances of the third type of error occurring.
Unmanned Bridge "Errors"
In some parts of New Zealand weighbridges may be unmanned because of very low demand for their use. These unmanned bridges are operated by the truck driver who may, or may not, remember to zero the bridge scales before weighing the load. To save time and quickly determine the net load the drivers are also known to sometimes use the permanent tare weight recorded on the side of the truck. The accuracy and integrity of a weight system such as this is unknown but is unlikely to match that of the well-maintained and manned systems described earlier in this paper.
System-Related Variation
In the Mechanical Variation section of this paper it was mentioned that the accuracy of weighbridges could drift with time. It is, therefore, important to monitor accuracy on a regular basis. Many countries (or states) regulate the frequency by which weighbridges have to be checked and stamped for approved usage. For example, both New Zealand and Australia require weighbridges to be "stamped" on an annual basis. As a comparison, Washington State requires weighbridges to be stamped on a six-monthly basis. Weighbridge owners can, of course, monitor the accuracy of their weighbridges on a more frequent basis than is legally required and arrange for the weighbridges to be adjusted by qualified specialists if the weighbridges are not operating within acceptable tolerances.
A review of eleven forest owners in New Zealand, who use weighbridges as part of their weight scaling systems, found that there were large differences in how often the weighbridges were checked for accuracy. Most of the forest companies checked their weighbridges on an annual basis - in line with legal requirements. A few, usually the larger companies, checked their weighbridges every month or every four months. By way of comparison, one large forest company in the Pacific Northwest tests its weighbridges every three months. Comments from New Zealand companies that checked their weighbridges monthly or four-monthly indicated that they wanted to minimize risk to themselves of long-term errors and be able to demonstrate to their customers the integrity of their weight measurement system.
A review of the same eleven forest companies indicated that there was considerable difference in how often they re-tared the trucks used in their stored-tare weight system; ranging from weekly through to annually. Most companies, however, re-tared their trucks at an interval somewhere between 2 weeks and 2 months to minimize the effects of environmental variables (e.g., mud, snow, and ice in particular - refer back to Table 1) on the accuracy of payload determination. While some companies felt that re-taring at a fixed interval was easier to administer (and would allow re-tarings to be scheduled evenly throughout time or at a particular time of day), other companies felt that random selection within a fixed time window would help to miminize the risk of trucks purposefully being "lightened".
Some companies had a written policy on whether the truck driver should be in or out of the truck when it is being weighed. Consistency in following the policy is also required. For example, errors were noted at one weighbridge because the weighbridge operator thought the weighbridge system's computer software automatically "assumed" the driver would be out of the truck when a gross weight was measured and in the truck when a tare weight was measured. The operator assumed the software would subtract an average weight for a driver (say 80 kg) from the tare weight. These sorts of errors can be overcome with careful development of weighbridge operation procedures and training of weighbridge operators.
DISCUSSION
Although most of the sources of variation are only small, individually less then about 300 kg (or less than 0.7 % of a loaded truck's weight), added together they can be significant. Fuel, alone, can produce up to 600 kg variation in weight depending on the size of the tank and the fullness of the tank (Figure 10).
Table 3 provides a summary of the magnitude of the different types of variation. Based on the assumptions outlined in Table 3 it is possible that the net weight of a loaded truck could be plus or minus 1150 kg or 4 percent of the actual payload [16]. It is unlikely that all of the sources of variation would affect a truck at one time; in fact, it is likely that some will even cancel each other out. It does, however, highlight the need to be aware of the possible sources of variation that can affect weight readings from weighbridges.
Most of the major sources of variation are only a problem in a stored-tare weight system. Under a tare-in tare-out system, which uses the same weighbridge, the combined sources of variation would only be 0.5 to 1 percent of the payload.
In New Zealand 15.8 million cubic meters of wood are harvested annually [5]. Eighty five percent of that harvest volume, is weighed using a weighbridge [8]; that is, approximately 13 million cubic meters. A 0.5% to 1.0% variation in weighbridge readings would represent about 65,000 to 130,000 cubic meters. At US$25.00 per cubic meter the value of this variation would range between US$1.6 million and US$3.3 million annually.
The majority of the sources of variation can be minimized by designing and maintaining the weighbridge correctly and by following well designed procedures for the operating and checking of a weighbridge.
Table 3. Summary of Sources of Variation.
| Source of Variation | -/+ Magnitude (kg) | Assumption (based on a Bailey Bridge truck configuration) |
| Repeatability | 40 | |
| Location on bridge | 40 | |
| Mud | 140 | |
| Wind | 20 | Assuming 28 km/hr ( 15 knots ) |
| Fuel | 400 | The weight difference between the two weighings. |
| Removable items | 180 | Tools, chains, spare tire, etc. |
| Driver | 80 | Assuming an average size driver was in the truck during gross weighing and not for the tare weight. |
| Drift in time | 250 | Assume a 1% drift over a 12 month period |
| Total | 1150 | |
The weighbridge and its approaches should be designed so that water and debris do not accumulate on the platform(s) or in the pit [15].
Most countries that use weighbridges have minimum standards for operating weighbridges [14]. Usually these standards are laid down in law (see Table 4). It is important to remember that these are just that - minimum standards. Particularly when it comes to checking that the weighbridges are operating within acceptable tolerances, high use industries, like the forest industry, may benefit from exceeding these minimum standards.
Table 4. Examples of legislation relating to weighbridges.
| Country | Legislation covering Weighbridges. |
| New Zealand | Weights and Measures Act 1987 |
| Australia | Trade Measurement Act 1993 |
| USA | Each state has their own laws - guided by US National Institute of Standards and Technology Handbook 44 |
| Canada | Weight and Measures Act and Regulations (1993) |
| Great Britain | Weights and Measurement Act 1985 |
It is important for gaining control of weighbridge accuracy to maintain and implement appropriate procedures for operating a weighbridge. These procedures need to cover what should, and should not, be included when a truck is weighed. The details of these procedures are not as important as the fact that they are always carried out. The procedures should, however, include details on whether the truck is weighed with or without the driver, the need for passengers to be out of the truck when weighing and the equipment that the truck should have.
The ideal situation for a log-supply-by-weight system is to be able to tare-in and tare-out all trucks. By using the tare-in and tare-out approach major variation, caused by such factors as fuel and mud, can be minimized. However, although the tare in and tare out system is becoming increasingly popular, there are still many weighbridges used by forest companies in the USA, and countries like New Zealand, which use the stored-tare weight system. It is important when using a stored-tare weight system that re-tareing occurs randomly within a set time window. This will help to minimize any systematic bias.
It is inappropriate to expect a weighing system such as a weighbridge to weigh 100% accurately 100% of the time. However, by keeping the possible sources of variation in mind when building and operating a weighbridge, inaccurate weighing can be kept to a minimum - whether a tare-in tare-out system or a stored-tare weight system is used.
CONCLUSION
As the average log size is getting smaller in many parts of the world it is becoming increasingly time consuming and expensive to individually scale each log. Weigh scaling of various forms, using weighbridges, is becoming increasingly popular.
As the use of weighbridges increases, an understanding of the accuracy and integrity of weighbridge systems grows in importance. Weighbridges, in comparison with some other forest mensuration and scaling activities, tend to be very accurate. The sources of error can be broken down into mechanical, environmental, truck, human and system-related. Although it is difficult to put a figure on the possible magnitude of these errors, experiments and calculations carried out in New Zealand as part of this paper show that it could be as much as 4% of the payload weight if all errors occurred simultaneously in the same direction. It is unlikely, however, that all sources of error will act in the same direction at the one time.
Almost all of the variation can however be minimized by; installing a well designed bridge, regularly maintaining the bridge and following well designed procedures for operating an accurate weighbridge system.
AUTHOR CONTACTProf. Murphy can be reached by e-mail at --
glen.murphy@orst.edu
LITERATURE CITED
[1] Anonymous. (date unknown). Weighed in the balance and found wanting. A special report prepared by the editors of "Fleet Owner", by McGraw-Hill Publication, New York.
[2] Anonymous. 2002. The weight scale system. Revenue Branch, Ministry of Forests, Government of British Columbia, http://www.for.gov.bc.ca/revenue/manuals/scaling/Ch9.htm #P8-50. As accessed on 18 November 2002.
[3] Anonymous. 2002. Weighing applications. Omega Engineering, http://www.omega.com/literature/transactions/volume3/weigh.html, As accessed on 18 November 2002.
[4] Anonymous. 2002. Overview of vehicle weighing methods.http://www.hawkleyint.co.uk/technicaloverview.shtml #s2 . As accessed on 18 November 2002.
[5] Anonymous. 2002. Log flow in the New Zealand forest industry. New Zealand Ministry of Agriculture and Forestry, http://www.maf.govt.nz/statistics/primaryindustries/forestry/nzstats2000/logflow2.jpg, As accessed on 18 November 2002.
[6] Anonymous. 2002. Weights and measures: information for traders. New Zealand Government, http://www.consumer-ministry.govt.nz/weights-weighbridges.html. As accessed on 18 November 2002.
[7] Beckwith, J. 1997. Timber sale volumes, weights and prices. http://www.forestry.uga.edu/warnell/service/library/for97-192/, As accessed on 18 November 2002.
[8] Brack, C. and G.B. Wood. 1998. Measurement of log quantity by weight. http://sres.anu.edu.au/associated/mensuration/BrackandWood1998/LOGS.HTM As accessed on 18 November 2002.
[9] Daniels, R. 2002. Marketing your timber: the basics of weight scaling. Mississippi State University Extension Service. http://www.msucares.com/pubs/pub2005.htm, As accessed on 18 November 2002.
[10] Ellis, J.C. 1988. Procedures for the Measurement of Roundwood. Ministry of Forestry, Forest Research Institute, Private Bag, Rotorua, New Zealand.
[11] Kopczynski, T. and D. Ness. 2001. Five factors that can affect your weighing system's accuracy. Powder and Bulk Engineering. http://www.powderbulk.com/main/archive/09_Sep-tember_01/hardy.html. As accessed on 18 November 2002.
[12] Laroze, A. 2002. Personal communication. New Zealand Forest Research, 18 Feb 2002.
[13] NIST. 2002. US National Institute of Standards Handbook 44 - Specifications, tolerances, and other technical requirements for weighing and measuring devices. http://ts.nist.gov/ts/htdocs/230/235/h442002.htm As accessed on 18 November 2002.
[14] Norden, K.E. 1984. Electronic weighing in industrial processes. Granada Technical Books, London. Pp268-278.
[15] South Australia Government. 1999. Trade Measurement in South Australia - Weighbridges, Office of Consumer and Business Affairs, Adelaide.
[16] Taylor, P. 1989. Folding Bailey Bridge Trailers in New Zealand., LIRA Report" 14(11): 6.
[17] Wong, J.Y. 1978. Theory of Ground Vehicles, J.Wiley and Sons. p127-132.