Vol. 13 No. 1 January 2002
M. J. Wood
University of Southampton
United Kingdom
A. J. Moffat
Forest Research
United Kingdom
P. A. Carling
University of Southampton
United Kingdom
The authors are, respectively, Post-doctoral Research Fellow, Head of Environmental Research Branch, and Professor of Physical Geography.
ABSTRACT
During mechanised forest harvesting, extraction routes may be armoured with a dense carpet of logging residues (slash roads) to reduce soil disturbance associated with heavy machinery. However, guidelines regarding the design of slash roads remain largely qualitative, and their efficacy as a means of ground protection uncertain. Trials were undertaken in north-east England and south-west Scotland to identify the main causes of slash road failure during repeated trafficking. Failure of the slash roads was defined as (a) deflection of logging residues and exposure of the ground surface to harvesting machinery or (b) mixing of logging residues with surface soils. The frequency of slash road failure was directly linked to terrain factors (soil water content, the presence of rocks, tree stumps, furrows and drain channels, or slope). In addition, failure was linked to the design of the slash roads where large diameter logging residues were readily deflected, or at junctions and turning points where 'shearing' of the slash road took place. A simple means of assessing the potential for slash road failure is presented based on terrain characteristics. These guidelines allow harvesting staff to locate extraction routes in order to maximise the structural longevity of the slash road, whilst reducing down-time associated with their repair. In addition, and where standard yield tables apply, a means of predicting the volume of logging residues available at any site is demonstrated, and the implications of this for effective slash road construction are discussed.
Keywords: forest harvesting; soil compaction; ground protection; slash roads.
INTRODUCTION
In the UK, forest harvesting operations present the greatest potential risk to the physical condition of the soil [3], particularly on sensitive soils such as deep peats and peaty gleys. Impacts on the soil can include compaction, deep rutting and erosion, and evidence from overseas has demonstrated the potential for a reduction in site productivity as a result of soil physical degradation. However, previous studies [5, 7, 8, 12, 14, 15, 17, and 19] have established that armouring designated extraction routes with a dense carpet of logging residues (slash roads) can greatly reduce the soil impacts described above.
Despite the potential advantages of slash roads and their widespread use in the UK, guidelines for their design remain qualitative [3, 4, 9, 13, 16 and 17]. Critical post-traffic slash road thickness of between 10-15 cm and 25 cm [6, 14, and 15], and slash applications of 18 kg m-2 and 20 kg m-2 fresh weight [8 and 11 respectively] have been suggested world-wide. Similar UK studies have demonstrated slash road designs which maximise ground protection. Hutchings et al. [7] found no advantage in terms of reduced soil disturbance following up to 12 machine passes where the thickness of the slash road, a function of the number of rows of trees felled along each extraction route, was increased beyond that considered practical under normal operational conditions (8-10 rows). More recently, Wood et al. [19] found only minor changes in soil dry bulk density and penetration resistance on sensitive soils following up to 28 machine passes along slash roads incorporating the residues from 6-9 rows of trees.
However, the volume of logging residues at any site, and subsequent thickness/density and composition of the slash roads across the site, may vary considerably according to forest character and the chosen harvesting system [18]. As a result, neither the thickness nor density of slash roads can be used as a practical guide for their construction under operational conditions. Further uncertainty regarding the efficacy of slash roads arises due to the incorporation of large diameter non-saleable round-wood from the main stem during their construction. At diameters >20 cm, this material has been previously shown to impede the performance of flexible tracked machinery whilst leading to increases in soil disturbance, principally rutting and churning of surface soils [8]. In addition, large diameter material may amplify machine loads applied to the ground surface [13] where the load is concentrated over an area less that that of the machine footprint area. Wood [18] also noted that large diameter logging residues were easily deflected by wheel and track action, particularly along steeper slopes, while mixing of logging residues (all diameters) with surface soils regularly took place on wet ground.
More suitable guidelines for the design of slash roads would be those based upon knowledge of (a) how terrain, slash volume/composition and traffic intensity/loading affect the overall longevity of the slash road, (b) how the volume of slash available at any site varies according to silvicultural treatment, and (c) how this volume may be easily manipulated to ensure adequate slash road volumes. This paper describes qualitative harvesting trials in north-east England and south-west Scotland where the main causes of slash road failure were identified. Given the nature of the study, more rigorous statistical analyses are not included. Guidelines for maximising the efficacy of slash roads are presented and, in addition, a provisional method for calculating slash volumes for UK forests is demonstrated. Based on this model, theoretical trends in slash volume according to silvicultural treatment are considered in relation to ensuring effective slash road design.
METHODS
Six operational clearfell sites were visited between June 1998 and November 1999 (Table 1). Each site was harvested using the short-wood system of extraction: cutting and sorting were carried out on site by purpose-built harvesting machinery before being forwarded to roadside log landings. Primary extraction routes, each >200 m in length, were located along the edge of the forest, and fed by regularly spaced secondary extraction routes, each of 150-200 m length. Each extraction route represented a swath of trees cut by the harvester, averaging 10-16 m wide and armoured with a slash road of 5 m width. The general pattern of extraction was considered representative of upland sites employing the short-wood system under normal operational conditions in the UK (C. Saunders, 1998; personal communication. Technical Development Branch, Forest Research, UK).
Appendix 1 describes the method by which the total area of primary and secondary extraction routes, and of slash roads at each site, was estimated. Expressed as a percentage of the total site area, slash roads along primary routes accounted for between 2% and 7% of the total site area, and slash roads along secondary routes accounted for between 27% and 47% of the total site area (Table 1). As a result, this study chose to concentrate on secondary extraction routes which represented the largest proportion of the ground area subject to traffic.
At each site, three adjacent secondary extraction routes were chosen for study where tree species, age, planting regime and ground features such as slope and the presence of rocks, drains and furrows, remained uniform. Forest and terrain characteristics, and machine specifications at each site, are summarised in Table 1. Terrain was classified using the UK Forestry Commission terrain classification system [2], summarised in Table 2.
Within each experimental plot, the number of machine passes at any point along the slash roads was recorded and, after all the timber had been removed, a visual assessment was made of the construction and composition of the slash roads. This was extended to randomly chosen primary extraction routes. The number of rows of trees used in each slash road was derived by dividing the width of the extraction route by the tree spacing at the time of planting (Table 1). For each experimental plot, a qualitative assessment was then made of the post-traffic condition of the slash roads at 1 m intervals along the left and right wheel tracks (n = 900 observations per plot where each sample observation area equalled 1 m2). Failure was defined as (a) deflection of logging residues and exposure of the ground surface to harvesting machinery or (b) mixing of logging residues with surface soils. At sites 1-3, the overall frequency of failure was recorded, and at each point of failure, the terrain characteristics were noted. This process was repeated at sites 4-6 where, in addition, the location of each failure was recorded and referenced to the number of machine passes.
To investigate any relationship between the volume/thickness of logging residues at each site and the rate of slash road failure, a provisional means of estimating the volume of logging residues for UK forests was developed (Appendix 2) which uses allometric functions [10] and UK forest yield tables [1]. These take into account soil type, species, age, stocking density and previous thinning operations. It was beyond the scope of this study to test the accuracy of this method which assumes that slash was evenly distributed both within the crop and subsequently on the ground, and the resulting volume estimates are considered indicative rather than absolute. Based on the observations during each trial, the two major components of the slash roads were defined as; (1) branch wood (Vbranch) comprising the main stem of <7 cm diameter and all other woody branch material not part of the main stem, and (2) non-saleable large diameter components, each >7 cm diameter and generally 0.25-0.75 m in length, of the main saleable stem lost during conversion (Vloss). This included off-cut tree tops, forks (where the main stem splits into two separate stems) and some stops (a portion of the main stem exhibiting a rapid change in diameter), but not including massive butts and very large diameter off-cuts.
RESULTS
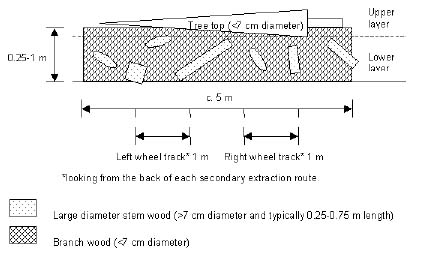
The composition of the slash roads at each site is typified in Figure 1. The main body comprised a lower layer of tightly interwoven branch wood, typically <7 cm diameter.
Table 1.Site and experimental plot characteristics at sites 1-6.
| Site (and harvesting date of experimental plot) |
||||||
| Site description |
1 (Jun 1998) |
2 (Aug 1998) |
3 (Oct 1998) |
4 (Mar 1999) |
5 (May 1999) |
6 (Nov 1999) |
| National grid reference | NY 645945 | NX 375885 | NY 685905 | NY 745905 | NY 675935 | NY 715855 |
| Soil type | Peaty gley | Deep peat | Peaty gley | Peaty gley | Peaty gley | Peaty gley |
| Compartment (ha) | 70 | 25* | 25* | 8 | 42 | 12 |
| Species1 | Sitka spruce | Sitka spruce | Sitka spruce | Sitka spruce | Sitka spruce | Sitka spruce** |
| Planting date and yield class2 |
1951 (12) | 1942 (12)* | 1942 (12)* | 1948 (12) | 1951 (10) | 1951 (14) |
| Total slash road area (%)3 | 31 | 31 | 42 | 42 | 50 | 34 |
| Primary routes (%) | 2 | 4 | 4 | 7 | 3 | 6 |
| Secondary routes(%) | 29 | 27 | 38 | 35 | 47 | 28 |
| Route dimensions (m)4 | 16 (5) | 16 (5) | 12 (5) | 12 (5) | 10 (5) | 15 (5) |
| Tree rows per slash road | 9 | 9 | 7 | 7 | 6 | 4 |
| Terrain class5 | 4:2:3 | 5:2:2 | 4:1:1 | 4:3:1 | 4:2:1 | 4:1:1 |
| Machine passes6 | 4-16 | 9-28 | 10-18 | 10-18 | 13-18 | 9-20 |
| Harvester | Modified excavator*** | Modified excavator | Timberjack 1270B | Timberjack 1270B | Valmet 911 | Timberjack 1270B |
| Gross weight (kg) | 15000 | 15000> | 16850 | 16850 | 15000 | 16850 |
| Forwarder | Hemek TD81 | Valmet 860 | Timberjack 1210 | Hemek TD81 | Valmet 860 | Valmet 890 |
| Gross weight unladen (kg) | 13000 | 13770 | 16000 | 13000 | 13770 | 17000 |
| Capacity (kg) |
12000 |
12000 |
12000 |
12000 |
12000 |
18000 |
11.7 m spacing at time of planting - no subsequent thinning. 2based on estimated standing volume (m3 ha-1) of saleable material. 3Total slash road area, and slash road area along primary and secondary extraction routes, as percent of total compartment area. 4Average width of extraction routes, and in parentheses, the average width of the slash roads, at each site. 5Based on author's assessment within each experimental plot using FC terrain classification system [2] where an increase in each value (1 to 5) indicates a deterioration in ground conditions (increases in soil water content), an increase in ground surface roughness (occurrence of boulders, plough furrow, drains etc) or slope respectively. 6the range across entire plot combining harvesting and forwarding machinery (at each site this comprised 2-4 passes by the harvester, the remainder by the forwarder), *authors estimate. **Alternating between two rows Sitka spruce and two rows Scots pine (the latter planted as a nurse species and having died off by the time of harvesting). ***Steel-tracked excavator with harvesting head fitted to the boom.
Table 2. UK Forestry Commission terrain classification system.
| Class 1 |
Class 2 |
Class 3 |
Class 4 |
Class 5 |
| Ground conditions | ||||
| Dry sands or gravels | Firm mineral soils | Dry mineral or ironpan soils | Dry peaty gleys, wet mineral soils | Wet peaty gleys, deep peats |
| Ground roughness (obstacles - rocks, drains, tree stumps etc) | ||||
| Obstacles small, widely spaced | Intermediate (low) | 40 cm height, 1.5-5 m spacing | Intermediate (high) | 60 cm height, 1.5-5 m spacing |
| Ground slope | ||||
| 0-10% (0-6o) |
11-20% (6-11o) |
21-33% (11-18o) |
34-50% (18-27o) |
>50% (>27o) |
For example, a terrain class 1:3:4 represents a dry sand or gravel, covered by obstacles of up to 40 cm height at 1.5-5 m spacing, with a slope of 34-50% (18-27o).
Figure 1. Typical composition of a slash road (cross section not to scale).
This layer was armoured by an upper layer of larger diameter tree tops comprising branch wood and stem material of diameter <7 cm, placed perpendicular to the direction of travel. In addition, non-saleable large diameter components (Vloss, described above), were located randomly, both throughout and adjacent to, each slash road.
Five types of slash road failure were identified at each site. Type 1 failure related to worsening ground conditions (softer and wetter soils), and resulted in liquefaction of the underlying soil and/or mixing of logging residues with the underlying soil. Type 2 failure related to ground roughness where tree stumps, rocks, plough furrows or drain channels created a point of weakness in the slash road, increasing the likelihood of slash deflection. Type 3 failure took place in response to ground slope, and resulted in the deflection of tree tops and large diameter stem material during wheel slip as the machinery struggled to maintain traction on the steeper slopes. Type 4 failure related to structural inconsistencies in the slash road where large diameter stem wood (Figure 1) was deflected by wheel action irrespective of slope or where machine wheels punched a hole in the slash road where large voids were present. Type 5 failure took place at the right-angled junctions joining primary and secondary extraction routes or other turning points where the slash road was 'torn open', exposing the ground surface to machinery.
For each site, the area of the slash road that failed within each experimental plot, the dominant failure type, the estimated Vslashroad and number of machine passes are summarised in Table 3. At each site, Vloss was distributed both within, and adjacent to, each slash road making it difficult to estimate the overall amount of Vloss incorporated in the slash road, hence estimates of Vslashroad in Table 3 are based on Vbranch alone. Type 1 failure dominated site 2 (ground condition class 5), though was rare at the remaining sites (ground condition class 4). Type 2 failure occurred regularly at site 4 (ground roughness class 3), though only isolated cases were recorded at sites 1, 2 and 5 (ground roughness class 2) and at sites 3 and 6 (ground roughness class 1). Type 3 failure was frequently recorded at site 1 (slope class 3), though seldom observed at site 2 (slope class 2) or sites 3, 4, 5 and 6 (slope class 1). Type 4 failure was rare, and accounted for less than 5% of all observations at any site. Type 5 failure took place outside the experimental plot at each site, though was a common feature at many junctions and turning points. Correlation analysis (EXCEL 2000) demonstrated a positive, though non-significant, relationship between the area of the slash road subject to failure across all experimental plots and Vslashroad (Table 3, r = 0.71, p = 0.05 and n = 6), and it is possible that large volumes of logging residues may be counter productive. During trafficking, small diameter branch wood was observed to 'knit' together, theoretically im proving the structural integrity of the slash road. Larger volumes of logging residues, particularly those of greater length and diameter, may be less inclined to 'knit' together in this way, though results of this study showed that failure was linked more strongly to worsening ground conditions, especially at sites 1 (steep), 2 (wet) and 4 (rough).
| Site |
||||||
| 1 | 2 | 3 | 4 | 5 | 6 | |
| Machine passes (range) | 1-16 | 6-28 | 8-18 | 10-18 | 11-18 | 9-20 |
| % failure (n. observations) | 15 (135) | 15 (135) | 5 (45) | 10 (90) | 0 (0) | 5 (45) |
| Dominant failure type** | Type 3 | Type 1 | Type 2 | Type 2 | - | Type 2 |
| Vslashroad(m3 ha-1)*** | 1123 | 1129 | 847 | 802 | 530 | 1140 |
*not including type 5 failure which occurred outside the experimental plot at each site. **accounting for 95% or more of total observations. ***based on Vbranch alone (Eqn. 6).
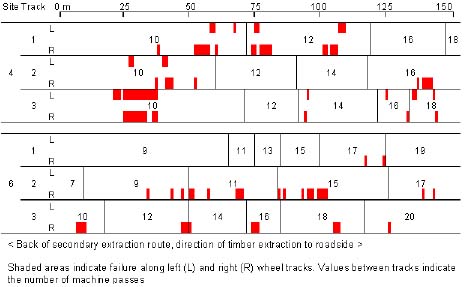
Figure 2. Distribution of slash road failure (all types) at sites 4 and 6.
The extent of slash road failure along secondary extraction routes, illustrated using sites 4 and 6 in Figure 2 (failure was not recorded at site 5), did not indicate a strong relationship with traffic frequency (i.e. the incidence of failure did not increase towards the junction between the secondary and primary extraction routes where trafficking frequencies were much higher). In general, the extent of type 1 failure appeared to worsen with each machine pass, stabilising at 15-20 machine passes, though failure types 2, 3 and 4, associated with points of weakness in the slash road, and failure type 5, located at junctions and turning points, took place after only 5-10 machine passes, and often during a single machine pass. Throughout this study, the gross weight of the harvesting machinery varied little (c. 15000-16850 kg), though that of the forwarding machinery (laden) ranged between 25000 kg and 34000 kg. However, there was no indication that increasing the gross weight of the forwarding machinery led to an increase in the extent of slash road failure. For example, the gross weights of the forwarder (laden) at sites 1 and 2 were c. 25000 and 25770 kg respectively and resulted in slash road failure of 15 %, yet at site 6, only 5 % failure took place where the gross weight of the forwarder (laden) was c. 35000 kg.
Desktop trials of the method for calculating slash volumes described in Appendix 2 were carried out to explore potential variations in slash volumes for a range of important British tree species and typical silvicultural treatments (Roger Coppock, 2000; personal communication. Forestry Commission, UK). All examples are based on t > tmin (Eqn. 5) which is considered to represent economic viability (main stem > 7 cm diameter) for which yield models are available, and Vslash (Eqn 8) which includes both Vbranch and Vloss.
Differences in Vslash for a range of species are shown in Figure 3. Examples are based upon unthinned stands, with an average yield class and a spacing of 2.0 m for all but Japanese larch (Larix kaempferi) where data for unthinned stands were only available at 1.7 m spacing. With time, differences in Vslash between the five species; Sitka spruce, Norway spruce (Picea abies), Scots pine (Pinus sylvestris), lodgepole pine (Pinus contorta) and Japanese larch became increasingly apparent. At clearfell, typically 50-61 years for the pine species and 44 years for the larch (Roger Coppock, 2000; personal communication. Forestry Commission, UK), Vslash was approximately 50% and 30% respectively of that for the spruce species, typically clearfelled at 50-55 years. Beyond the average age of felling, the volume of Vslash continued to rise for the spruce species while stabilising for the pines, but for larch, Vslash fell steadily from c. 35 years.
Figure 4 illustrates the effect of yield class and spacing on Vslash for unthinned Sitka spruce, the dominant economic forest crop in the UK. There was a marked increase in Vslash with greater yield class (yield class 6, 12, 18 and 24). However, the model did not indicate an effect due to spacing at either 1.7 m or 2.0 m within each yield class.
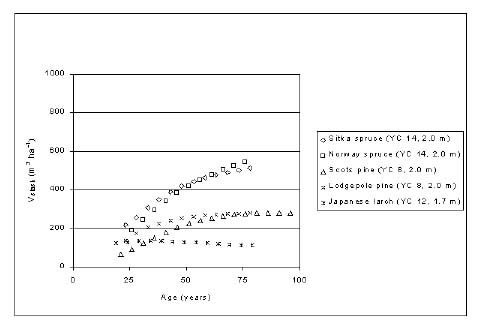
Figure 3. Differences in Vslash for typical unthinned upland species (yield class and spacing).
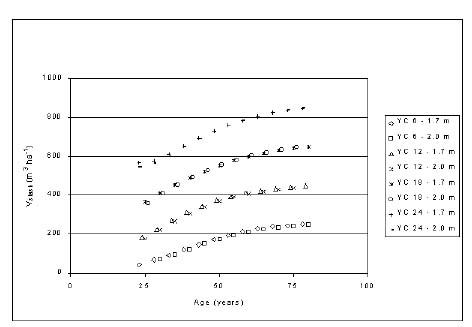
Figure 4. The effect of variations in yield class and spacing on Vslash for unthinned Sitka spruce.
The effect of thinning treatments on Vslash for Sitka spruce at 1.7 m spacing, yield classes 6, 12 and 24, is demonstrated in Figure 5. For each yield class, the effect of both line thinning and crown thinning was to reduce Vslash at clearfell, typically 40-60 years, to around 60% of an unthinned stand. The difference in Vslash between line thinning and crown thinning within each yield class was negligible.
For each species at average yield class, the relative proportions of Vbranch and Vloss for typical and maximum rotation lengths are summarised in Table 4. The overall volume/composition of Vslash is important as Vbranch has been shown in this, and other studies, to provide soil protection and vehicle traction while Vloss can result in (a) structural weakness within the slash road and (b) tractive inefficiency. The proportion of Vloss at clearfell is typically between 8% and 14% of Vslash based on the silvicultural conditions in this example. However, for Japanese larch Vloss approaches c. 25% of Vslash at the maximum rotation length.
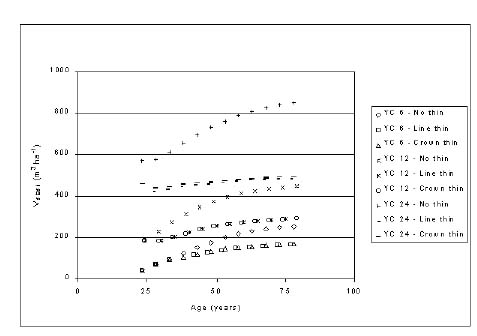
Figure 5. The effect of different thinning treatments on Vslash for Sitka spruce.
Table 4. Typical volume estimates (m3 ha-1) of Vstem, Vbranch, Vloss and Vslash.
| Species | Age* | Vstem | Vbranch | Vloss | Vslash | Vloss (%)** |
| Sitka spruce (YC 14, spacing 2.0 m) | 48 | 591 | 384 | 35 | 419 | 8 |
| 78 | 886 | 460 | 53 | 513 | 10 | |
| Norway spruce (YC 14, spacing 2.0 m) | 56 | 688 | 410 | 41 | 451 | 9 |
| 76 | 933 | 489 | 56 | 545 | 10 | |
| Scots pine (YC 8, spacing 2.0 m) | 61 | 417 | 230 | 25 | 255 | 10 |
| 101 | 624 | 239 | 37 | 277 | 14 | |
| Lodgepole pine (YC 8, spacing 2.0 m) | 48 | 343 | 233 | 21 | 253 | 8 |
| 78 | 542 | 247 | 33 | 280 | 12 | |
| Japanese larch (YC 8, spacing 1.7 m) | 44 | 322 | 114 | 19 | 133 | 15 |
| 79 | 462 | 84 | 28 | 111 | 25 | |
DISCUSSION
The protection slash roads afford, and their longevity during repeated trafficking, is a function of trafficking intensity and terrain features, tree species, stand age and previous management, and the overall strength, volume, orientation and distribution of specific components of the slash roads. The longevity may be maximised by attention to (a) their location in relation to terrain and (b) design - relating to their form and volume/composition.
Based the results of this study, where failure types 1, 2 and 3 (relating to the terrain at that location) commonly occurred at, and not less than, ground condition class 5, surface roughness class 3 or slope class 3 respectively, a provisional guide to assessing the risk of slash road failure is presented in Table 5. It is assumed that the incidence of type 4 failure (relating to composition) increases proportionally to the volume of large diameter material. The risk banding is broad, and reflects the limited number of sites visited and qualitative nature of the collected data. The risk of failure rises proportionally to either worsening ground conditions or increases in the volume of large diameter material (Vloss). For example, type 1 failure relating to increasingly soft/wet ground conditions may occur earlier on sites classed lower than 5 (ground conditions) during wet conditions. Table 5 could be used when planning the pattern of extraction so that terrain features limiting to the longevity of the slash roads area are avoided as far as possible.
To reduce further the risk of failure types 3 and 5, recommendations for the design of slash roads are presented in Figure 6. Deflection of logging residues on steeper terrain (>11o) such as that at site 1 (type 3 failure) may be reduced by placing tree-tops at 45o to the direction of travel along circular extraction routes (Figure 6a). Increasing the area of the slash road at junctions may reduce machine induced shearing (type 5 failure, Figure 6b). It is noteworthy that at site 1, the forwarder was fitted with chains rather than floatation tracks which may have influenced the extent of type 3 failure. Tracks may prove less aggressive than chains on steeper terrain where the integrity of the slash road is in question, though a detailed comparison between tires, chains and tracks was not possible in this study.
Desktop trials of the method for calculating slash volumes described in Appendix 2, provided a useful insight into the potential variation in slash volumes according to both species and silvicultural treatments prior to harvesting. From a manager's perspective, the higher volumes of slash associated with spruce sites compared to pine and larch sites may allow greater flexibility when locating extraction routes and building/maintaining slash roads. For Sitka spruce, the principal economic crop in the UK, variation in slash volumes as a result of differing spacing appears negligible, though slash volumes fell with a decreasing yield class or as a result of thinning. In such cases, managers may wish to exercise caution when planning the pattern of extraction.
Given the broad range of terrain and silvicultural scenarios under normal operational conditions, it is difficult to determine a minimum Vslashroad such that the efficacy of slash roads along secondary extraction routes are maximised. The estimates of Vslashroad for each site in this study (incorporating Vbranch only) indicated that (a) 1129 m3 ha-1 was insufficient to prevent type 1 failure at site 2, (b) 802 m3 ha-1 was insufficient to prevent type 2 failure at site 4 and (c) 1123 m3 ha-1 was insufficient to prevent type 3 failure at site 1. However, elsewhere along the secondary extraction routes at each site, and notwithstanding the occasional occurrence of type 4 failure (< 5% total observations), the slash road remained wholly intact irrespective of volume/thickness or the number of machine passes.
Table 5. Assessing the risk of slash road failure based on terrain and composition. Low (L), medium (M) and high (H) risk of slash road failure and machine down time associated with slash road repairs.
| Terrain class* |
|||||
| Composition** | 1 | 2 | 3 | 4 | 5 |
| Fine | L | M | M | M | H |
| Medium | M | M | M | M | H |
| Coarse | H | H | H | H | H |
*UK Forestry Commission terrain classification: ground conditions (failure type 1) and/or ground roughness (failure type 2) and/or ground slope (failure type 3), **proportion of material >7 cm diameter and of length 0.25-0.75 m.
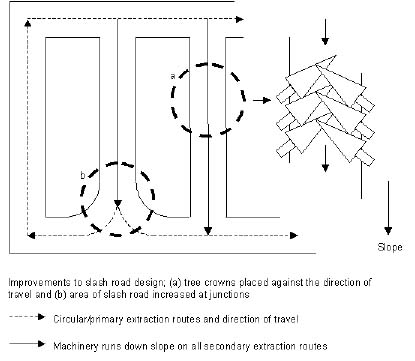
Figure 6. Improved slash road design to reduce failure types 3 and 5.
For the purpose of demonstration, and despite only limited experimental coverage in this study, a Vslashroad of around 500 m3 ha-1 is considered a minimum operational requirement. This is based upon the volume estimate at site 5 where terrain factors were non-limiting, though in other situations this may be much lower. This minimum volume relates to secondary extraction routes which represent the greatest proportion of the site area trafficked. Vslashroad along primary extraction routes, often located along forest perimeter, will generally be greater due to the increased volumes of branch wood associated with trees along the forest edge. Where terrain factors may limit the efficacy of the slash road, Vslashroad may be increased to a maximum determined by the boom reach of the harvesting machinery and number of tree rows incorporated into each slash road. This in turn will be determined by terrain factors, machine stability when handling larger stems and the size of the forwarding machinery. Timber markets may also affect slash road design where the width of extraction routes is reduced to ensure efficient sorting and stacking of shortwood.
Assuming a minimum operational Vslashroad of 500 m3 ha-1, Table 6 demonstrates how this may be achieved in all but a few cases for a range of common silvicultural scenarios in Britain (examples chosen to match, as far as possible, spacing, age and yield class). Given the negative effect of Vloss on the longevity of the slash roads, its inclusion in slash roads is generally avoided in practice (C. Saunders, 1998; personal communication. Technical Development Branch, Forest Research, UK), and Vslashroad in Table 6 is based upon Vbranch only. This is particularly important where Vloss may constitute up to approximately 25 % of Vslash (Table 4). Where Vslashroad falls short of this target, additional measures may be taken to limit soil disturbance. These relate to, (a) the timing of harvesting operations, (b) the choice of machinery and extraction system and (c) importing logging residues from other areas.
Table 6. Recommended extraction route widths to ensure minimum operation Vslashroad (500 m3 ha-1).
| YC | Sp | Age | W | Vslashroad | YC | Sp | Age | W | Vslashroad | YC | Sp | Age | W | Vslashroad |
| 8 | 1.7 | 56 | 11 | 531 | 8 | 1.8 | 62 | 10 | 502 | 8 | 1.8 | 61 | 11 | 501 |
| 12 | 1.7 | 52 | 7 | 514 | 12 | 1.8 | 57 | 7 | 501 | 10 | 1.8 | 57 | 10 | 552 |
| 16 | 1.7 | 49 | 6 | 561 | 16 | 1.8 | 53 | 6 | 559 | 12 | 1.8 | 55 | 8 | 520 |
| 8 | 1.7 | 63 | 15 | 516 | 8 | 1.5 | 71 | 15 | 527 | 8 | 1.4 | 69 | 17 | 556 |
| 12 | 1.7 | 56 | 11 | 523 | 12 | 1.5 | 61 | 11 | 536 | 10 | 1.4 | 63 | 17 | 626 |
| 16 | 1.7 | 49 | 9 | 553 | 16 | 1.5 | 53 | 9 | 530 | 12 | 1.4 | 58 | 17 | 773 |
| YC | Sp | Age | W | Vslashroad | YC | Sp | Age | W | Vslashroad | |||||
| 8 | 1.8 | 50 | 10 | 545 | 8 | 1.7 | 44 | 17* | 386 | |||||
| 10 | 1.8 | 47 | 9 | 548 | 10 | 1.7 | 43 | 17 | 463 | |||||
| 12 | 1.8 | 45 | 8 | 566 | 12 | 1.7 | 41 | 16 | 519 | |||||
| 8 | 1.5 | 62 | 16 | 503 | 8 | 1.7 | 54 | 17 | 227 | |||||
| 10 | 1.5 | 59 | 13 | 501 | 10 | 1.7 | 50 | 17 | 274 | |||||
| 12 | 1.5 | 54 | 12 | 523 | 12 | 1.7 | 46 | 17 | 333 | |||||
All estimates based on Vbranch only and assume a Swidth of 5 m. YC _ yield class based on estimated standing volume (m3 ha-1) of saleable material, Sp _ spacing (m), Age (years), W - width of extraction route (m), *where 17 m represents the widest extraction route possible (based on currently available machinery).
CONCLUSION
This study has demonstrated that where terrain and slash road design (composition and form) are non-limiting, and assuming the normal operational conditions encountered in this study, slash roads have the potential to provide sustained ground protection on many forest plantation sites in upland Britain. Where failure of the slash road occurs, prompt repairs are necessary to (a) limit the area of the ground subject to direct trafficking during subsequent machine passes, (b) maintain vehicle floatation and (c) avoid extended periods of machine down-time associated with slash road repairs. However, attention to the location and design of slash roads based on the guidelines presented above provides forest managers and harvesting staff with a means of extending the longevity of slash roads and reducing the incidence of failure. A study of the mechanical properties of logging residues used in the construction of slash roads under both wheeled and tracked machine loading over a range of terrain classes, and how these may change with time, water content, site and silvicultural conditions, would allow guidelines for the use of slash roads to be further refined.
ACKNOWLEDGEMENTS
We would like to thank the Scottish Forestry Trust and the Forestry Commission (UK) for financial support, staff of Forest Enterprise (Newton Stewart and Kielder Forest Districts) for site access and Forest Research (Northern Research Station, Technical Support Unit North and Alice Holt Lodge), in particular Robert Matthews and Colin Saunders, for support both in the field and with the presentation of this work.
AUTHOR CONTACT
Mr.Wood can be reached by e-mail at --
m.wood@fore.canterbury.ac.nz
LITERATURE CITED
[1] Edwards, P.N. and Christie, J.M. 1981. Yield models for forest management. For. Comm. Booklet 48. Her Majesty's Stationary Office, London.
[2] Forestry Commission. 1996. Terrain classification. For. Res. Tech. Dev. Branch, Tech. Note 16/95. 5 pp.
[3] Forestry Commission. 1998. Forests and soil conservation guidelines. For. Comm., Edinburgh.
[4] Forestry Commission. 2000. Forests & water guidelines. For. Comm., Edinburgh.
[5] Fries, J. 1974. Views on the choice of silvicultural methods and logging technique in thinning - Aspects of thinning. For. Comm. Bull. No., 55. Her Majesty's Stationary Office, London.
[6] Hallonborg, U. 1982. The effect of slash covering on the formation of ruts. Resultat: Forskningsstiftelsen 3; Skogsarbeten. 4 pp.
[7] Hutchings, T.R., Moffat, A.J. and French, C.J. 2002. Soil compaction under timber harvesting machinery: a preliminary report on the role of brash mats in its prevention. Soil Use and Management 18: 34-38.
[8] Jakobsen, B.F. and Moore, G.A. 1981. Effects of two types of skidders and of slash cover on soil compaction by logging of mountain ash. Australian J. For. Res. 11: 247-255.
[9] Jones, W.M. 1991. Working systems for mechanised harvesting in Britain. For. Comm. Work Study Br., Rep.No. 9/91, 18 pp.
[10] Matthews, R. 2000. Estimation of stand total volume increment for production forecasting. Unpublished note, For. Comm., UK.
[11] McDonald, T. P. and Seixas, F. 1997. Effect of slash on forwarder soil compaction. J.For. Eng. 8 (2): 15-26.
[12] McMahon, S., and Evanson, T. 1994. The effect of slash cover in reducing soil compaction resulting from vehicle passage. Log. Ind. Res. Org., New Zealand. Rep. No. 19 (1), 4 pp.
[13] Murgatroyd, I.R. 1997. Soft ground clearfell harvesting techniques. For. Comm. Tech. Dev. Br., Unpublished Tech. Note. 9 pp.
[14] Schaffer, J. 1991. Soil deformation by vehicles _ effect of reinforcement by brushwood mats. Allgemeine-Forstzeitschrift 46 (11): 550-554.
[15] Schafer, T. and Sohns, D. 1993. Reducing soil compaction by a layer of brushwood. Allgemeine-Forstzeitschrift 48 (9): 452-455.
[16] Spencer, J.B. 1991. Soft ground harvesting: a review of methods to minimise site damage. For. Comm. Work Study Branch, Report 35/91, 17 pp.
[17] Wall, M. and Saunders, C.J. 1998. Kielder harvesting slash road trial: An assessment of soil protection. For. Comm. Tech. Dev. Br., Unpublished Tech. Note. No. 32/98, 14 pp.
[18] Wood, M. J. 2001. The effects of mechanised forest harvesting on soil physical properties. Unpublished PhD thesis, Southampton University.
[19] Wood, M. J., Carling, P. A. and Moffat, A. J. (In press). Reduced ground disturbance during mechanised forest harvesting on sensitive forest soils in the UK. Forestry.
Appendix 1
Estimating the area of slash roads at each site
At each site, an approximation of the total site area covered by slash roads, Tslashroad (ha), is given by;
 (1)
(1)
where A is the area of the site (ha), and Sw and Rw are the average width of the slash roads and extraction routes respectively for the entire site. The area (ha) of primary (Py) and secondary (Sy) extraction routes is then determined using either;
 (2)
(2)
where A (the area of the site, ha) is assumed to be a square forest block surrounded by primary routes on each side (N = 4) or;
Sy = Tslashrod - Py (3)
Appendix 2
Estimating the volume of slash at each site
The total tree volume (including roots) can be estimated from:
Vtotal = Vstem x f(t) (4)
where Vstem (m3 ha-1) is the volume of saleable timber [1] and f(t) is an inflation factor obtained using;
 (5)
(5)
where t is stand age (yrs) and tmin, a, b and g are parameters given in Table 1a. Based on a rearrangement and modification of Eqn 4, the first component of the slash road, Vbranch, is assumed to be given by:
Vbranch = Vstem x r(f(t) - 1) (6)
where r (0.85) is the correction factor to remove root volume, estimated at 15% of Vtotal - Vstem (Robert Matthews, 2000; personal communication. Forest Research Mensuration Branch, UK). The second component Vloss is assumed to be given by:
Vloss = g x Vstem (7)
where g (0.06) is the stem volume potentially saleable but lost during conversion, with an estimated range of between 0.05% and 0.07% (R. Matthews, 2000; personal communication. Forest Research, Mensuration Branch, UK). Finally the total volume of logging residues at any site (the total volume of saleable and non-saleable material lost during conversion) Vslash (m3) is given by:
Vslash = (Vbranch + Vloss) x A (8)
where A is the total area (ha) of the compartment. Under normal operational conditions, the volume of the slash road, Vslashroad (m3 ha-1) is a function of the areal extent of extraction routes and may be estimated using:
 (9)
(9)
Table 1a. Parameters for Equation 5 [10].
| Species group | tmin (yrs) | a | b | g |
| Spruces* | 22 | 1.441 | -0.720 | -0.067 |
| Pines | 20 | 1.194 | -2.785 | -0.117 |
*(inc. Hemlock, Cedar, Cypress).