
Display large image of Figure 1
Vol. 14 No. 2 July 2003
Glen Murphy
Oregon State University
Oregon, USA
The author is a Professor in the Forest Engineering Department at Oregon State University.
ABSTRACT
Four simulated procedures for scanning and bucking of 75 pruned and 75 unpruned radiata pine (Pinus radiata) trees were evaluated on the basis of productivity, costs, and value recovery. The procedures evaluated were: (a) a conventional scan where quality changes and bucking decisions were input by the machine operator, (b) a fully automated scan of the stem prior to optimisation and bucking, (c) a 6 m automated scan with 6.2 m forecast ahead, and (d) a 4.7 m automated scan with 7.5 m forecast ahead before optimal bucking took place. Cutting patterns for export and domestic markets were used in the simulations for optimally bucking each tree. After subtracting costs, net value recovery for the automated scanning methods was 5 to 8% higher than for a conventional scan. Based on the stand types and market conditions used in the analyses, breakeven capital investment costs for new scanning and optimisation equipment on mechanised processors could range between US$240,000 and US$450,000.
Keywords: productivity, costs, value recovery, mechanised log-making, scanning, New Zealand.
INTRODUCTION
Worldwide there is a trend towards mechanisation of forest harvesting operations, particularly where harvested tree size is decreasing. The drivers for this trend are generally productivity/cost improvement goals or labour-related issues; e.g. to improve worker safety or to overcome labour shortages. However, mechanisation not only affects productivity and costs but it can also have significant impacts, both positive and negative, on value recovery [18] .
Audits of mechanised processing operations indicate that up to two-thirds value loss can occur if the bucking is undertaken without the assistance of computerised optimal bucking tools. Losses can occur when logs do not meet specification (e.g. inaccurate lengths, diameters too small or large, too much sweep, non-allowable quality features) or when the combination of logs cut from a stem is sub-optimal. Stand characteristics, market complexity, equipment design and maintenance, and operator skills can all affect the level of loss.
Improved selection and training of operators may provide one of the higher benefit-to-cost ratios [8] for investments in ways to reduce value losses. However, there is a limit to human ability to capture and process information and, therefore, to the potential improvements from training. In the mid-1960's Russian scientists [15 , 16] found that humans could make use of 0.7 to 4.0 bits of information per second. However, they also found that production speeds, similar to those found on modern day processors, generated 2.13 to 4.26 bits of information on knots per second; knots being only one type of defect an operator has to consider. They concluded that the human brain is inadequate for making unassisted decisions at production speeds. Gellerstedt [11] reported that Scandinavian harvester operators indicated that they have problems seeing defects in the log at current feeding speeds of 4 m/s and that more "sensing" in the harvester head is required for faster operation and better judgements on the logs.
Currently, most processor heads are fitted with mechanical sensors for measuring lengths and diameters of each tree processed. The operator has to visually assess changes in quality along the length of each stem and determine, with or without the use of an "optimal" bucking system, the log types to be cut. While tree-form models have been suggested as one way of improving stem shape and quality assessments it has been noted that these work better with some species than with others. For example, Gellerstedt 11] comments that Scandinavian operators "more often follow the computed [cross cutting] decision when working with spruce than with pine".
Problems with assessing stem dimensions and quality features have long been recognised. Swedish researchers 25 years ago concluded that "if improved bucking techniques [on mechanised harvesters] are to be found, research and development work should concentrate on the design of machines, the incorporation of transmitters, the development of systems for measuring curvature and knot diameters, and the programming of calculating equipment" [19] . Significant progress has been made on many of these goals. Much work still needs to be done on developing systems for assessing quality characteristics and incorporating these into optimal bucking routines.
As wood users become more targeted in the type of logs they want, they are beginning to specify a broader range of acceptable quality features that will need to be assessed using new technologies, e.g knot size, wood density, extractives content, knotty core diameter and stiffness.
Whether assessing diameter, or knotty core, or extractives content up the stem, measuring the entire stem before bucking would require double handling with significant consequences for machine productivity and costs. Scandinavian researchers have invested considerable resources into determining the best procedures for scanning and optimal bucking on mechanised harvesters for their tree types and market conditions [2, 4, 5, 6, 12, 14, 23, 24] . They have found that by measuring a portion of the stem and forecasting taper for the unmeasured portion of the stem, productivity impacts could be reduced and value losses contained to less than 1% [2] . In comparison with radiata pine (Pinus radiata), these results relate to relatively uniform spruce and pine stems with small branches.
Mechanised processors are being used more in Southern Hemisphere radiata pine plantation forests - particularly in Australia and New Zealand, but also in Chile and South Africa. For many reasons, radiata pine is much more variable than the Scandinavian trees and markets for it tend to be considerably more prescriptive in the features that are allowed in each log-type. Assessment of changes in quality is, therefore, a key requirement for any scanning system to be used in radiata pine harvesting operations. To ensure that each part of the tree is allocated to the most profitable market it will be vital that mechanised processors are developed which can accurately and automatically scan both stem dimensions and quality features. It is also vital that the best procedures for scanning are developed.
Research into technologies for scanning stem quality attributes is progressing on a number of fronts with varying levels of success; e.g. optical and laser [25, 20] , x-ray [1, 17] , ultrasound [13] and near infra-red spectroscopy [22] . Scanning technologies are not the focus of this paper, however. Rather, the focus of this paper is on procedures for scanning, given that suitable technologies become available for accurately measuring quality attributes.
This paper summarizes the results of four simulated procedures for scanning radiata pine stems by mechanised processors. Evaluations were carried out in terms of productivity, costs and value recovery for a range of stand conditions and market types. The paper also quantifies the breakeven capital investment for new scanning and optimisation technology compared with technology used on conventional mechanised equipment.
METHODS
Tree Stem Data Sets
Fifteen trees in each of ten New Zealand radiata pine stands were selected for the study. Five of the stands had been pruned and five were unpruned. The ten stands were all owned by one of the largest forest companies in New Zealand and were located in plantation forests in the central North Island. They were considered to be representative of the company's clearfell radiata pine stand characteristics.
The fifteen trees from each stand were selected by the company's harvesting crews and supervisors and were considered by them to be broadly representative of the cross-section of tree sizes and qualities within each stand. The trees were manually felled and extracted in tree-length form by rubber-tired skidders and tractors to in-forest landings. There, they were carefully measured in detail for stem shape and external quality characteristics (e.g., knot size and scarring) using a length measuring tape, diameter calipers and a metal ruler (for branch sizes and sweep offset). A forest supervisor, familiar with log quality characteristics, assisted with measurements of each stem. Measurements were taken over bark and often took 15 minutes, and sometimes up to a half an hour, for each stem to ensure that they accurately represented stem shape and qualities. Under-bark dimensions were estimated using a combination of a national bark thickness equation for radiata pine and stand-specific tree height functions.
Tree size from the ten stands averaged 2.00 m3 and individual trees ranged between 0.18 and 5.03 m3. Table 1 provides a summary of stem characteristics.
Procedures for Scanning
To determine the best procedure for scanning, four simulated scanning and optimisation patterns were included in the study. These are based on the assumption that accurate scanning technologies are, or will become available, for measuring dimensions and qualities. The four simulated scanning and optimization patterns were:
Table 1. Stem characteristics.
| Stand | Pruned Stands | Unpruned Stands | ||||
| Mean Tree Size (m3) |
Minimum Tree Size (m3) |
Maximum Tree Size (m3) |
Mean Tree Size (m3) |
Minimum Tree Size (m3) |
Maximum Tree Size (m3) |
|
| I | 2.64 | 1.05 | 4.15 | 1.11 | 0.27 | 1.85 |
| II | 2.41 | 1.16 | 4.02 | 2.28 | 0.42 | 4.20 |
| III | 1.97 | 0.18 | 5.03 | 1.93 | 0.54 | 3.27 |
| IV | 1.55 | 0.39 | 4.77 | 2.06 | 0.89 | 3.53 |
| V | 2.12 | 1.03 | 3.80 | 1.97 | 0.43 | 4.08 |
Taper was forecast ahead using the same taper rate as measured for the last 3 metres (approx.) of stem length scanned. Quality was forecast ahead based on the last 0.1 metre of stem length scanned. Sweep is a difficult stem attribute to measure, particularly when the stem is dangling from a processor head. Evanson [7] describes a video system for helping processor operators to assess sweep in radiata pine. It was assumed for our simulations that sweep was measured consistently and correctly, regardless of scanning procedure - that is, sweep was not forecast.
Forecasting of stem taper and quality was taken up to 12.2 metres on each occasion since this was the longest log length included in the study. If the "optimal" solution required a log cut to be made in the forecast zone and that would have resulted in a log not meeting specifications, for quality or diameter reasons, then a revised bucking solution was determined based on the new information.
Markets
Two market scenarios were included in the analyses - a domestic market (DOMESTIC) and an export market (EXPORT). Each market included approximately eighteen log-types and individual log-types could also have multiple lengths. Log lengths ranged from 3.7 to 12.2 m. The highest value log-type was a 6.2 m pruned export grade log. Its value, based on average stumpage prices for the forest, was set at US$72.00 per m3. The lowest value log-type was an oversize kraft pulplog. Its value was set at US$3.60 per m3.
The DOMESTIC market included 2 grades of domestic pruned sawlogs (US$64.80 per m3), 11 grades of domestic sawlogs with branches (US$30.25 to US$17.30 per m3), 1 grade of house-piles (US$20.90 per m3) and 3 grades of pulp logs (US$11.50 to US$3.60 per m3).
The EXPORT market included slightly different sets of log-types for pruned stands and unpruned stands. For pruned stands the EXPORT market included 2 grades of export pruned sawlogs (US$72.00 to US$70.60 per m3), 2 grades of domestic pruned sawlogs (US$64.80 per m3), 5 grades of export sawlogs with branches (US$43.20 to US$33.80 per m3), 6 grades of domestic sawlogs with branches (US$30.25 to US$20.90 per m3) and 3 grades of pulp logs (US$11.50 to US$3.60 per m3). For unpruned stands the EXPORT market included 8 grades of export sawlogs with branches (US$43.20 to US$33.80 per m3), 7 grades of domestic sawlogs with branches (US$30.25 to US$18.00 per m3) and 3 grades of pulp logs (US$11.50 to US$3.60 per m3).
Gross and Net Value Recovery
The single-stem, optimal bucking software AVIS [10] has been extensively tested in New Zealand and was used to determine gross value recovery for the FULL, SCAN 6 and SCAN 4.7 scanning procedures for the fifteen stems in each stand for both DOMESTIC and EXPORT markets.
A review of 39 studies of mechanised log-making operations around the world found that, on average, the top quartile of operators lost 5.0% of value, the top half lost 8.5% of value and the top three quartiles lost 13.5% of value. The average value loss from all operators was a little over 20% [18] . Gross value recovery for the CONVENTIONAL scanning procedure was determined by reducing the FULL scan value recovery by a constant percentage; 8.5%. The gross value recovery of the top half of operators was used as the basis for the CONVENTIONAL scanning procedure for this paper since it could be argued that value recovery by the poor performers could probably be improved through non-technical solutions, such as better training of operators. Sensitivity analysis was also carried out for the top quartile of operators who lost 5.0% of value on average.
Net value recovery was calculated by subtracting log-making costs from gross value recovery.
At this point it should be noted that we assumed in our simulations that the markets were supply limited, not limited by aggregated log-type demand quotas. Unless stand characteristics are closely matched to market requirements single-stem optimal buckers will over-predict potential value recovery. The implication of our assumption is, that under demand-limited market conditions, the improvements we will show in value recovery through optimal bucking may be compressed when compared with supply limited market conditions.
Productivity and Costs
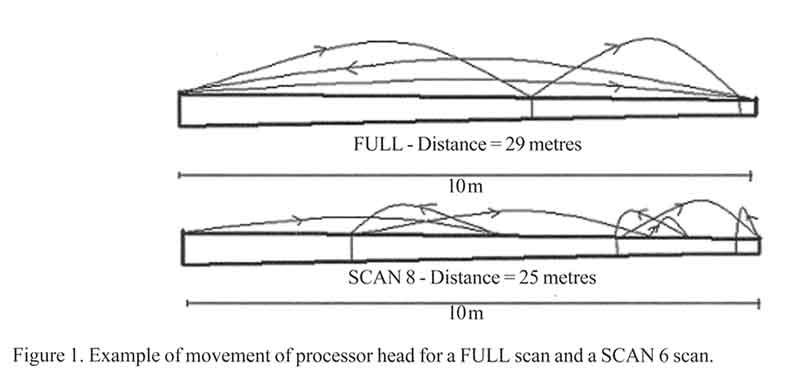
The results of the optimal bucking analyses using AVIS were also used to determine the number of sawcuts made for each stem and the movement of the processor head. Figure 1 provides an example of the movement of the processor head and number of cuts for a FULL scan and a SCAN 6 scan. For example, for the FULL scan shown in Figure 1 the processor head movement can be broken down into scanning/delimbing the full 10 m, reversing from tip to butt for the full 10 m, and then moving forward in two sections to where cuts will be made on the delimbed stem.
The number of sawcuts and movement of processor head information was combined with published production data gathered in 1994 [9] and unpublished production data gathered six years later on two Waratah Tree Harvester Model HTH 234's. The following functions were derived and used in the analyses for the harvester processing tree length stems delivered to a landing: 0.35 minutes per stem for picking up the tree, sorting logs, aligning logs in the stacks and moving between stacks; 3.85 seconds per sawcut; 1.25 m per second for scanning/delimbing; 1.0 m per second for bucking delimbed stems for either moving the processor head forward or backward; 2.5 m per second for reversing from tip to butt of scanned and delimbed stem. A machine utilisation rate of 67% was also used in the calculations.
A capital cost of US$305,000 was assumed for the processor operating with the CONVENTIONAL procedure for scanning; i.e., without scanning equipment fitted. An operating cost of US$90 per scheduled machine hour was used in the analyses. This includes the cost of an operator at New Zealand labour rates. Costs per scheduled machine hour were combined with the time required to scan, delimb and buck the 15 trees in each stand to determine production costs.
Breakeven Capital Investment Costs
After calculating productivity and value recovery for the FULL, SCAN 6 and SCAN 4.7 procedures for scanning, capital costs for the processor were increased to the point where net value recovery for these procedures equaled that of the CONVENTIONAL scanning procedure. The labour component of the operating costs was held constant.
These breakeven capital costs were rounded down to the nearest US$10,000. They provide an indication of the maximum amount that could be spent on new scanning and optimisation systems.
Sensitivity analysis of these breakeven costs to changes in market conditions, stand conditions, gains in value recovery and scanning speeds was also carried out.
Display large image of Figure 1
Statistical Analyses
Costs and net value for each stand were analysed using Giant Size Regression techniques [3] and the multiple regression procedures in Microsoft's Excel spreadsheet. Average tree size was used as a covariate because of differences in tree size between stands. Indicator variables were used to separate stand-types, market types and scanning procedures. Interactions between the covariate and the indicator variables were also tested.
A full model, with all variables and interactions included, was first evaluated. Variables were then dropped one at a time until all remaining variables were significant at the p-value <0.05 level. Tests were then carried out to determine if slopes or intercepts could be combined for like-variables, i.e., stand-types, market-types, and scanning procedures. A p-value of < 0.01 was used.
RESULTS
Productivity and Costs
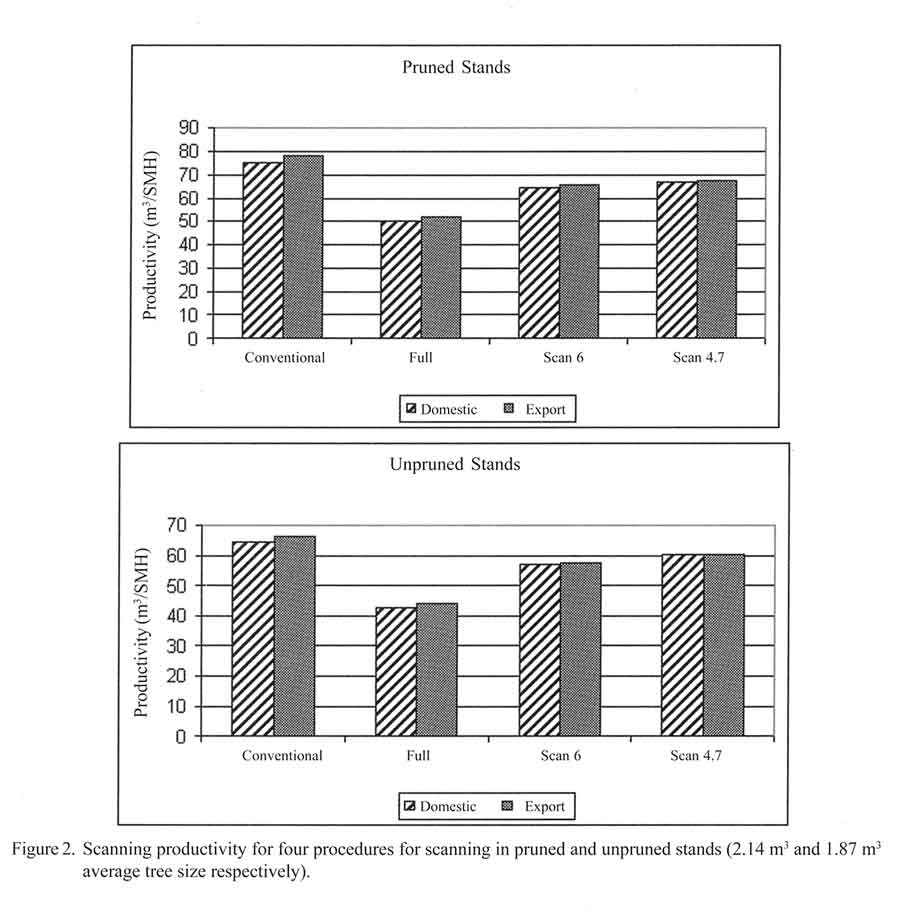
Figure 2 shows that productivity for the FULL scanning procedure was about a third less than that for the CONVENTIONAL scanning procedure in both the pruned and unpruned stands. Scanning only a portion of the stem at a time reduced the productivity impacts but the level of reduction was dependent on market type and stand type. The SCAN 6 procedure resulted in a 12 to 16% drop in productivity and the SCAN 4.7 procedure a 6 to 14% drop in productivity compared with the C0NVENTIONAL procedure.

Display large image of Figure 2
Changes in scanning and processing costs were in line with changes in productivity. Costs for scanning and processing the 15 trees in each stand were significantly related to tree size, market type, stand type and scanning procedure but there were no significant interactions between either market type or stand-type and scanning systems (Table 2). A regression model with an adjusted R2 of 0.935 was developed. Table 3 provides costs for the four scanning systems based on equal numbers of pruned and unpruned stands, an equal mix of domestic and export market conditions and an average tree size of 2.004 m3. Costs were about 50% higher for the FULL scan procedure, about 15% higher for the SCAN 6 procedure and about 11% higher for the SCAN 4.7 procedure than for the CONVENTIONAL scan procedure.
Table 2. Analysis of variance and regression statistics for costs of processing 15 trees.
| Source | df | SS | MS | F | Significance |
| Regression | 6 | 4719 | 786 | 163.8 | <0.001 |
| Residual | 73 | 350 | 4.8 | ||
| Total | 79 | 5069 | |||
| Variable | Coefficient | Standard Error | P-value |
| Intercept | 33.03 | 1.28 | <0.001 |
| Tree Size | 2.91 | 0.72 | <0.001 |
| Stand Type*Tree Size (Stand Type = 1 if Pruned; 0 otherwise) |
-1.00 | 0.25 | <0.001 |
| Market Type*Tree Size (Market Type = 1 if Domestic; 0 otherwise) |
0.53 | 0.24 | 0.031 |
| FULL Scan*Tree Size (FULL scan = 1 if FULL, 0 otherwise) |
9.49 | 0.34 | <0.001 |
| SCAN 6*Tree Size (SCAN 6 = 1 if SCAN 6, 0 otherwise) |
2.91 | 0.34 | <0.001 |
| SCAN 4.7*Tree Size (SCAN 4.7 = 1 if SCAN 4.7, 0 otherwise) |
2.12 | 0.34 | <0.001 |
Table 3. Scanning and processing costs for four scanning procedures for an average tree size of 2.004 m3 and equal mixes of stand types and market conditions.
| Scanning Procedure | Cost for scanning and processing 15 trees ($) |
Increase in costs compared with CONVENTIONAL Procedure (%) |
| Conventional | $38.39 | 0 |
| Full Scan | $57.41 | 50 |
| Scan 6 | $44.21 | 15 |
| Scan 4.7 | $42.61 | 11 |
Net Value Recovery
Net value recoveries from scanning and processing the 15 trees in each stand were significantly related to tree size, market type, stand type and scanning procedure. There were significant interactions between tree size and all of the indicator variables. Analyses indicated that the net value recovery from the CONVENTIONAL procedure was significantly different from the other scanning methods but the FULL scan, SCAN 6 and SCAN 4.7 procedures could be combined (Table 4). A regression model with an adjusted R2 of 0.970 was developed. Table 5 provides net value recoveries for the four scanning systems operating in pruned and unpruned stands under domestic and export market conditions for an average tree size of 2.004 m3. Net value recoveries were about 7% higher for the FULL scan, SCAN 6 and SCAN 4.7 procedures than the CONVENTIONAL procedure but the percentage increase was dependent on stand type, market type and tree size. Although gross value recovery for the FULL scan procedure was about 4% higher than for the SCAN 6 and SCAN 4.7 procedures, there were no statistically significant differences in net value recovery partly due to higher scanning and processing costs.
Breakeven Capital Investment Costs
Table 6 shows the breakeven capital costs that could be invested in new scanning and optimisation technology for the SCAN 4.7 procedure. The SCAN 4.7 procedure was selected as the basis for presenting this information since it is the closest in operating method to the CONVENTIONAL procedure and no statistically significant difference in net value recovery was found between the FULL, SCAN 6 and SCAN 4.7 procedures. The breakeven capital costs have been rounded to the nearest US$10,000 and are in addition to the cost of current technology - estimated to be US$305,000. The costs are also estimated on the assumption that the new technology would accurately assess stem dimensions and qualities and determine optimal bucking patterns based on these assessments. Breakeven capital investment costs range between US$240,000 and US$450,000. The breakeven costs were dependent on the stand-type, the market, the scanning procedure (CONVENTIONAL or otherwise) and average tree-size. For example, for the conditions we evaluated, the lowest breakeven costs were found for the unpruned stands with an average tree size of 1.0 m3 supplying a DOMESTIC market. Similarly the highest breakeven costs were found in pruned stands with an average tree-size of 2.0 m3 supplying an EXPORT market.
Table 4. Analysis of variance and regression statistics for net value recovery from processing 15 trees.
| Source | df | SS | MS | F | Significance |
| Regression | 5 | 6141422 | 1228284 | 517.76 | <0.001 |
| Residual | 74 | 175549 | 2372 | ||
| Total | 79 | 6316971 | |||
| Variable | Coefficient | Standard Error | P-value |
| Intercept | -387.49 | 39.37 | <0.001 |
| Tree Size | 616.73 | 29.86 | <0.001 |
| Market Type (0/1, 1 = Domestic) |
186.00 | 3.42 | 0.001 |
| Market Type *Tree Size | -194.53 | -7.31 | <0.001 |
| Stand Type*Tree Size (Stand Type = 1 if Pruned) |
52.25 | 9.31 | <0.001 |
| Scan*Tree Size (Scan = 0 for Conventional, or = 1 otherwise) |
27.45 | 4.46 | <0.001 |
Table 5. Net value recoveries for 15 trees from four scanning procedures adjusted for an average tree size of 2.004 m3. Bracketed figures are the percentage increase in value recovery compared with the CONVENTIONAL procedure.
| Scanning Procedure | Pruned Stands | Unpruned Stands | ||
| DOMESTIC market |
EXPORT market |
DOMESTIC market |
EXPORT market |
|
| Conventional | $749.71 | $953.25 | $644.70 | $848.54 |
| Full / Scan 6/ Scan 4.7 | $804.42 | $1008.26 | $699.71 | $903.55 |
| [7.3] | [5.8] | [8.5] | [6.5] | |
These breakeven capital investment costs are related to the assumption that gross value differences between the CONVENTIONAL scanning procedure and the FULL scanning procedure were 8.5% - equivalent to the average performance of the top half of operators in a recent review of mechanised log-making [18] . If assumed differences between the CONVENTIONAL scanning procedure and the FULL scanning procedure were reduced to 5.0% - equivalent to the average performance of the top quartile of operators - breakeven capital investment costs would fall to between US$140,000 and US$260,000.
Besides increasing equipment costs it is possible that scanning technology fitted to a harvester head could negatively affect both delay-free productivity and machine utilisation rates. Costs were increased by 50% to see what impact this might have on breakeven capital investment costs under a "worse case" scenario - an unpruned stand of average tree size 1.0 m3 supplying a domestic market where the improvement over CONVENTIONAL procedures was only 5.0%. The effect would be to reduce breakeven capital costs from about US$140,000 down to about US$20,000.
DISCUSSION AND CONCLUSIONS
The simulations indicated that substantial gains in value recovery could be obtained by automatically scanning radiata pine stem quality and dimensions. After subtracting costs, net value recovery for the automated scanning methods was about 7% higher than for a conventional scan where dimensions were automatically measured by the processor but quality changes and bucking decisions were input by the machine operator.
Table 6. Costs, net value recovery and breakeven capital investment costs for the SCAN 4.7 procedure.
| Stand | Market Type |
Average Tree Size (m3) |
Scanning and Processing Cost for SCAN 4.7 procedure ($m3) |
Net Value Recovery for CONVENTIONAL procedure ($m3) |
Net Value Recovery for SCAN 4.7 procedure ($m3) |
Breakeven Capital Investment Cost* ($1000) |
| Pruned | Domestic | 1.0 | 2.51 | 18.20 | 20.03 | 250 |
| 1.5 | 1.77 | 22.67 | 24.50 | 350 | ||
| 2.0 | 1.41 | 24.91 | 26.74 | 440 | ||
| Export | 1.0 | 2.47 | 18.77 | 20.60 | 250 | |
| 1.5 | 1.74 | 27.38 | 29.21 | 360 | ||
| 2.0 | 1.37 | 31.68 | 33.51 | 450 | ||
| Unpruned | Domestic | 1.0 | 2.57 | 14.74 | 16.54 | 240 |
| 1.5 | 1.84 | 19.19 | 21.02 | 340 | ||
| 2.0 | 1.47 | 21.43 | 23.26 | 420 | ||
| Export | 1.0 | 2.54 | 15.28 | 17.11 | 240 | |
| 1.5 | 1.80 | 23.89 | 25.72 | 340 | ||
| 2.0 | 1.44 | 28.20 | 30.03 | 430 | ||
| *These are costs above those of the conventional processor head and integral measuring equipment. | ||||||
Scandinavian researchers found that by measuring a portion of the stem and forecasting taper for the unmeasured portion of the stem, productivity impacts could be reduced and value losses contained to less than 1% [2] . It was found that when quality has to be forecast as well as taper gross value losses could be contained to less than 4% compared with a full scanning procedure. Productivity, however, is about 25% higher with a scanning/forecasting procedure than with a full scan procedure.
No significant differences were found in net value recovery between the automated scanning methods but there were significant differences in costs and productivity. Since the SCAN 4.7 procedure resulted in lower productivity and cost impacts than the FULL or SCAN 6 procedures this would seem to be the best alternative. Scanning a short section of stem before determining the optimal bucking pattern is likely to require different computing capability and technology than that required for scanning a full stem prior to optimal bucking. This paper did not address the issue, however, of how short a section of stem needs to be scanned to ensure that value losses do not escalate. It is possible that a few metres of stem are all that needs to be scanned at any one time.
The simulations also showed that the capital investment that could theoretically be spent on new scanning and optimisation technologies to ensure that maximum value is recovered from radiata pine plantations is considerable - in some cases exceeding the cost of the carrier and processor head. It should be noted, however, that these breakeven costs were sensitive to assumptions on system productivity and potential gains in gross value recovery when compared with conventional procedures - under some conditions the gains in value recovery could be outweighed by the increases in operating cost. Since the breakeven capital investment cost also varied between different stand-types, market conditions and tree-sizes it would be important that new technology were matched to the conditions in which it was expected to operate most frequently and effectively.
An investment in operator training may be a simpler and more effective way to improve value recovery than investing in technology. As Gellerstedt [11] notes, however, it can take years for an operator to gain the training and experience to effectively operate a harvester and, even then, there is a limit to how quickly operators can perceive and use information about each tree stem. Increases in machine delimbing/processing speeds and a trend towards matching internal wood properties to markets will probably lead to a greater use of scanning technology and log bucking decision support systems on harvesters if log values warrant such an investment.
This research has significant implications for the mechanised harvesting of radiata pine plantations where average tree sizes are around 2 m3 and where markets are similar to those found in New Zealand. Smaller radiata pine trees and other species in different markets are likely to have different costs and potential values, however. Further research needs to be undertaken to determine how broadly these results can be applied. It must also be noted that these results relate to scanning of external quality features only. Further research is required to determine the effects of alternative procedures for internal quality scanning on productivity, costs and value.
ACKNOWLEDGEMENTS
This research was partially funded by the New Zealand Foundation for Research Science and Technology under Contract CO4X014. The work was begun when the author was previously employed by Forest Research, Rotorua, New Zealand.
AUTHOR CONTACT
Professor Murphy can be reached by e-mail at -- glen.murphy@orst.edu
REFERENCES
[1] Aune, J.E. 1995. An x-ray log scanner for sawmills. pp: 52-64. In: The Second International Workshop/Seminar on Scanning Technology and Image Processing on Wood. Skelleftea. Sweden. 14-16 August, 1995. Lindgren, O. (ed.).
[2] Berglund, H. and J. Sondell. 1985. Computerised bucking - one way to increase value of the wood in mechanised logging systems. Skogsarbeten Report NR6 1985. 51pp.
[3] Cunia, T. 1973. Dummy variables and some of their uses in regression analysis. pp:1-146. In: Proceedings of IUFRO seminar: Subject Group S4.02 - Forest Resources Inventory, held in Nancy, France. June 25-29, 1973.
[4] Drake, E. 1988. The influence of bucking decisions of stems on the sawing yield - some trials based on simulation techniques. Tratek Report I 8811070. 69pp.
[5] Drott, C. 1996. Ersattningsform for fordelning-sapterat timmer [Alternative methods for bucking timber]. Swedish Land University Arbetsrapport 224. 84pp.
[6] Ek, A., L. Lendrup, and F. Stenstrom. 1972. Marking. Skogsarbeten Report NR7 1972. 52pp.
[7] Evanson, T. 1999. Using video to improve sweep recognition in mechanised processing. Logging Industry Research Organisation. Report Volume 24. Number 11.
[8] Evanson, T. 1999. Research strategies to improve value recovery from mechanised processing. Logging Industry Research Organisation Report (Unpublished), (Reported in: Murphy, G.E., 2000. Maximising value recovery: costs and benefits. In: Proceedings of Austimber 2000 Conference, held 14-18 March 2000. Albury, NSW, Australia. Kerruish, W. (ed.)).
[9] Evanson, T. and A. Riddle. 1994. Evaluation of a Waratah Hydraulic Tree Harvester Model HTH 234. Logging Industry Research Organisation Report, Volume 19 (3).9pp.
[10] Geerts, J.M P. and A.A. Twaddle. 1984. A method to assess log value loss caused by cross-cutting practices on the skidsite. New Zealand Journal of Forestry 29(2): 173-184.
[11] Gellerstedt, S. 2002. Operation of the single-grip harvester: motor-sensory and cognitive work. International Journal of Forest Engineering 13(2):35-47.
[12] Haggblom, R. and O. Pennanen. 1983. Influence of sawlog bucking method on yield of center goods. Metsateho Report 381. 14pp.
[13] Han, W. 1994. Log quality evaluation by lengthwise ultrasonic transmission. Measurement of log quality. Seminar 25/10/1994. The Norwegian Institute of Wood Technology, Oslo.
[14] Hossjer, S. and A. Tosterud. 1989. The Target Matrix - a program for increasing wood value. Skogsarbeten Report NR2 1989. 15pp.
[15] Kudinov, A.A. 1969. Evaluating the operative thinking of the operator of a log cross-cutting unit. Lesnicky Zhurnal, Arkangel'sk 12(1):120-123.
[16] Leonov, L.V. 1967. The amount of information defining the knottiness of long longs. Lesnicky Zhurnal, Arkangel'sk 9(1):155-162.
[17] Martin, P. and D. Choffel. 1995. Timber automatic grading using microwave technology. pp: 157-169. In: The Second International Workshop/Seminar on Scanning Technology and Image Processing on Wood. Skelleftea. Sweden. 14-16 August, 1995. Lindgren, O. (ed.).
[18] Murphy, G.E. 2002. Worldwide experiences with mechanization and value recovery. pp: 23-32. In: Proceedings of the Woodfor Africa 2002 Conference, held 2-3 July, 2002, Pietermaritzburg, South Africa. Kellogg, L., B. Spong, and P. Licht, (eds) Oregon State Univesity, Corvallis, Oregon.
[19] Nordstrom, S. 1978. Examples of bucking losses in mechanised logging. In: Wood processing and the value of wood. Skogsarbeten Report No. 3. pp: 33-34.
[20] Nylinder, M. 1990. Automatic grading of pine logs. The Swedish University of Agricultural Sciences, Department of Forest Products, Report No. 215, Uppsala, Sweden. pp: 63.
[21] Petersen, R.G. 1985. Design and analysis of experiments. Marcel Dekker, Inc., New York. pp: 117-124.
[22] So, C-L., L.H. Groom, T.G. Rials, R. Snell, S.S. Kelley, and R. Meglen. 2002. Rapid assessment of the fundamental property variation of wood. In: Proceedings of the eleventh biennial southern silvicultural research conference. (Outcalt, K.W. (editor)). General Technical Report SRS-48. Asheville, NC. U.S. Department of Agriculture, Forest Service. Southern Research Station. pp: 176-180.
[23] Sondell, J. 1995. Evaluation of five bucking-to-value systems for harvesters marketed in Sweden. pp: 87-111. In: Proc. of the IUFRO XX World Congress P3.07 Meeting, Tampere, Finland, 6-12 August 1995. Kellogg, L. and G. Milota, (eds.). Oregon State University, Corvallis, Oregon, U.S.A.
[24] Sondell, J., J.J. Moller, and J. Arlinger. 2002. Third-generation merchandising computers. Skogforsk Results No. 2. 6pp.
[25] Tian, X. 1999. An application of computer vision technologies to log defect determination. PhD Thesis, Lincoln University, New Zealand. 329pp.