
Display large image of Figure 1
Vol. 14 No. 2 July 2003
Juho Rantala
Nuutti Kiljunen
Pertti Harstela
Finnish Forest Research Institute
Finland
The authors are, respectively, Researcher, Researcher, and Professor at the Finnish Forest Research Institute, Suonenjoki, Finland.
ABSTRACT
In Finland, the number of nurseries has been decreasing year by year, and it seems probable that in the near future this trend will continue. It can be assumed that greater economies of scale could also be achieved in Finnish seedling production by enlarging the size of production units [9, 10] . The management strategies used by a nursery company for long-distance seedling transportation were compared with different allocations of seedling production among nurseries. To determine the optimal transportation costs in different strategies for seedling production and planning of long-distance transportation, linear programming (LP) was applied. To manage spatial information, a geographical information system (GIS) was used. The current development towards seedling transportation managed by nursery companies seems to have marked advantages in the cost-effectiveness of transportation. The relative improvement in cost-effectiveness caused by centralized transportation strategy (CTS) compared to decentralized transportation strategy (DTS), which is the mostly used strategy in seedling transportation planning in Finland, varied from 13.0% to 36.5%, depending on the number of nurseries and the degree of specialization of production among them. These results will be useful for nursery companies and forest owners' associations (FOAs) when they evaluate the cost effects of production allocation, product specialization and systems of transportation management.
Keywords: seedling, transportation, nursery, planning, GIS, linear programming, Finland.
INTRODUCTION
In many branches of industry, the economics of scale has led to larger production units [e.g. 1] . It can be as sumed that greater economies of scale could also by enlarging the size of production units [9, 10] . In Finland, the number of nurseries has been decreasing year by year, and it seems probable that in the near future this trend will continue. Finnish nurseries have traditionally been quite small, producing 3-10 million seedlings per year. Nurseries have mainly served local customers , and their production has been divided among many types of seedlings. For the sake of comparison, in northern Sweden seedling production is concentrated in very few nurseries and fewer seedling types are being produced. Although in Finland, development has also been in this direction, most nurseries are still rather small and the number of seedling types produced is large. A decrease in the number of nurseries unavoidably causes an increase in total transportation costs. Thus, to obtain as much advantage as possible from lower production costs, more information about the effects of production concentration on transportation costs, and the development of systems for transportation control and planning of transportation are required.
Linear programming (LP) is widely used in transportation planning [e.g. 6] . In forestry, optimization of transportation has naturally been related to timber transportation and, more widely, to timber procurement. Standard LP and its variations have been applied to timber procurement problems, where the goal has been to find optimal timber flows from procurement areas to mills [8] . Planning of seedling transportation with LP requires a somewhat different approach, but in some ways is also similar to timber transportation. Laakkonen [3] applied LP to the distribution of regional demand for seedlings among nurseries. During the implementation of that study, governmental organizations (Central Forestry Board, District Forestry Boards and National Board of Forestry) owned most of the nurseries in Finland. Today, the nursery business has been privatized. Most of the companies are operating as limited companies and usually owning more than one nursery. The customers of these companies are usually non-industrial private forest (NIPF) owners due to their dominance in the ownership of Finnish forests. Few NIPF owners located near nurseries acquire their seedlings directly from nurseries, but usually Forest owners' associations (FOAs) or nursery companies deliver seedlings to the central seedling stores of the FOAs. Today, however, the modes of operation for long-distance transportation of seedlings seem to be quite varied, and research is needed to find the most cost-effective applications.
In this study, seedling transportation of a nursery company was optimized in various business circumstances. Optimal costs for seedling transportation were compared in two strategic dimensions: firstly, centrally planned transportation by the nursery company was compared with decentralized transportation organized by the customers who order the seedlings from the nearest nursery unit independently of other customers. In practice, decentralization leads to a situation where, due to difficulties in growing seedlings economically to meet the demand in a certain market area, internal transportation is needed between the nursery units of a company. The second dimension studied was related to the number of nurseries used for seedling production and the strategy of allocating production among nursery units. The aim of this study was to quantify the effect of different management strategies for seedling production and transportation planning on the total costs of long-distance transportation in a nursery company. At the same time, a LP model is introduced as a tool for planning seedling transportation.
MATERIAL AND METHODS
The seedling-production and transportation-management strategies studied
The wide range of seedling types was compressed to the five most important: two types of container spruce (1-year and 2-year), bare-root spruce (2- to 4-year), container pine (1-year), and container birch (1-year). The following strategies for seedling production were used in this study (Table 1).
In strategies S1 and S3 all nursery units produced equal numbers and proportions of the 5 seedling types. In strategy S6 the whole production was concentrated to one large nursery. In strategy S2 five nursery units produced seedlings according to the current practice of the company studied (Table 2). Production allocations in strategies S4 and S5 are presented in Table 3.
Production strategies S1, S3 and S6 are rather theoretical situations. Strategies S4 and S5, on the other hand, describe potential situations in the near future. In all production strategies, the total number of seedlings produced was constant (27 million). The customers closest to the nurseries were supposed to pick up their seedling orders themselves directly from the nurseries. Therefore the number of seedlings in long-distance transportation (23.85 million) was lower than the total number of seedlings produced.
The two alternative strategies concerning management of seedling transportation were:
Table 1. Seedling production strategies used in this study.
| Strategy | S 1 | S 2 | S 3 | S 4 | S 5 | S 6 |
| Number of nursery units | 5 | 5 | 3 | 3 | 3 | 1 |
| Number of seedling types produced in one nursery unit |
5 | 4-5 | 5 | 3-5 | 2-3 | 5 |
| Degree of product specialization | None | Small | None | Medium | High | — |
Table 2. The current production allocation of the company studied (strategy S2).
| Strategy 2 | Nursery 1 | Nursery 2 | Nursery 3 | Nursery 4 | Nursery 5 | Total |
| Spruce (1-year) | 4,000,000 | 1,000,000 | 1,000,000 | 500,000 | 2,000,000 | 8,500,000 |
| Spruce (2-year) | 3,000,000 | 2,500,000 | 1,500,000 | 500,000 | 1,000,000 | 8,500,000 |
| Spruce (bare-root) | 1,000,000 | 0 | 1,000,000 | 0 | 0 | 2,000,000 |
| Pine (1-year) | 1,000,000 | 1,000,000 | 1,000,000 | 500,000 | 1,000,000 | 4,500,000 |
| Birch (1-year) | 1,000,000 | 500,000 | 500,000 | 500,000 | 1,000,000 | 3,500,000 |
| Total | 10,000,000 | 5,000,000 | 5,000,000 | 2,000,000 | 5,000,000 | 27,000,000 |
Table 3. Production-specialization strategies S4 and S5.
| Strategy S4 | Nursery 1 | Nursery 2 | Nursery 3 | Nursery 4 | Nursery 5 | Total |
| Spruce (1-year) | 5,000,000 | 0 | 1,000,000 | 0 | 2,500,000 | 8,500,000 |
| Spruce (2-year) | 3,000,000 | 0 | 4,500,000 | 0 | 1,000,000 | 8,500,000 |
| Spruce (bare-root) | 1,500,000 | 0 | 0 | 0 | 500,000 | 2,000,000 |
| Pine (1-year) | 500,000 | 0 | 3,000,000 | 0 | 1,000,000 | 4,500,000 |
| Birch (1-year) | 1,500,000 | 0 | 0 | 0 | 2,000,000 | 3,500,000 |
| Total | 11,500,000 | 0 | 8,500,000 | 0 | 7,000,000 | 27,000,000 |
| Strategy S5 | Nursery 1 | Nursery 2 | Nursery 3 | Nursery 4 | Nursery 5 | Total |
| Spruce (1-year) | 5,000,000 | 0 | 0 | 0 | 3,500,000 | 8,500,000 |
| Spruce (2-year) | 4,500,000 | 0 | 0 | 0 | 4,000,000 | 8,500,000 |
| Spruce (bare-root) | 0 | 0 | 2,000,000 | 0 | 0 | 2,000,000 |
| Pine (1-year) | 2,000,000 | 0 | 0 | 0 | 2,500,000 | 4,500,000 |
| Birch (1-year) | 0 | 0 | 3,500,000 | 0 | 0 | 3,500,000 |
| Total | 11,500,000 | 0 | 5,500,000 | 0 | 10,000,000 | 27,000,000 |
In both strategies, it was assumed that customers could order all types of seedlings from the nearest nursery unit. Therefore, in the DTS, the nursery company must arrange internal transportation for the missing seedling types from nearest nursery unit having an overcapacity of those types of seedlings. After seedlings are transported internally, the whole order can be delivered to the customer. Because all the seedlings are transported from the nearest nursery, the total external transportation costs are constant, regardless of the seedling production strategy. In other words, in order to keep up the current level of service, the current five units will remain as sale and depot locations, even if production there is abolished. In the CTS, there is no need for internal transportation.
Display large image of Figure 1
Utilization of GIS
The main marketing area of a real Finnish nursery company and the locations of its nurseries were chosen as the geographical basis of the study (Figure 1). The area contained five nursery units owned by the company studied and seven medium- or large-scale nursery units owned by other companies. The customers of the company within the marketing area were located according to areas of the municipalities, which in many cases correspond to the areas within which FOA operate. Fewer customers were located in those areas containing a large number of small private seedling producers, for instance, in the eastern part of the study area. Potential customers located within a 30-kilometer radius of nurseries owned by other companies were excluded from the study. A vector-based network of main roads and a raster-based map managed with the ArcView 3.2 geographical information system (GIS) were used as tools for measuring the shortest transportation distances from the nurseries to the customers. In practice, main roads used in long-distance seedling transportations are so homogeneous that here the cost-effect of the differences between different road classes was ignored. The eastern side of the road network is bordered by a national boundary. A situation in which the optimal route between nursery and customer would go out of the network seems very improbable.
Transportation costs and capacities
To obtain information on the seedling trade and on transportation practices, nursery managers, FOA officials and transport company managers were interviewed. This information was used to estimate transportation costs (Table 4) and the capacities (Table 5) of different transportation vehicles. Fixed costs (Table 4) were calculated on the assumption that the external transportation company owned the vehicles used for transportation. Thus, all vehicles were assumed to work year round and only a certain part of the fixed costs was assigned to seedling transportation.
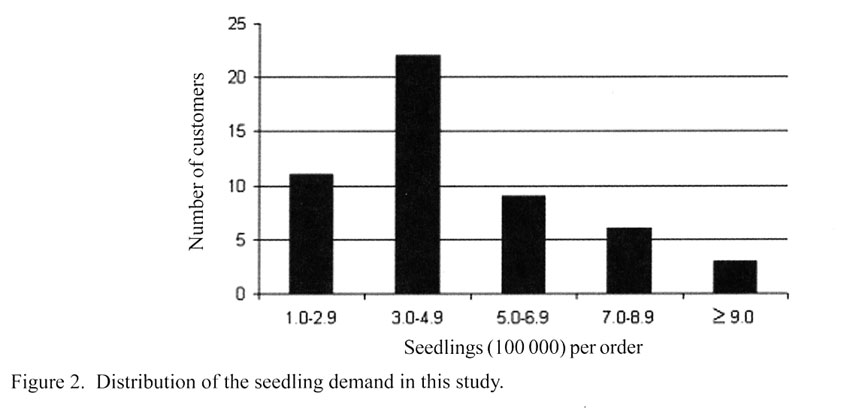
Seedling demand
The distribution of seedling demand was also estimated on the basis of the interviews of nursery managers, because no precise data on seedling markets was available. The total demand for the various seedling types was determined to correspond to regional regeneration statistics produced by the Regional Forestry Centers. The figures used here for demand included only customers (88.3 % of the total production) that required long-distance transportation (Figure 2). Customers very close to a nursery typically pick up their seedlings themselves and transport them directly to the regeneration areas. Such customers were excluded from the analysis. The material included 51 customers. Seedling demand per customer varied between 100000 and 1100000 seedlings, the average being 470,000. The smallest number of seedlings of a certain seedling type ordered by a customer was 50,000.
Table 4. Transportation costs, including labor costs, for each type of vehicle used in this study.
| Type of cost | Truck with a trailer |
Pickup truck |
Delivery van + trailer |
Passenger car + trailer |
Agricultural tractor + trailer |
| Terminal (US$/load) | 108.1 | 55.3 | 16.7 | 16.7 | 30.7 |
| Fixed (US$/load) | 120.8 | 27.6 | 4.8 | 3.9 | 7.5 |
| Variable (US$/km) | 0.62 | 0.52 | 0.38 | 0.40 | 1.23 |
Table 5. Transportation capacity of each vehicle type used in this study (seedlings/load).
| Type of seedling | Truck with a trailer |
Pickup truck |
Delivery van + trailer |
Passenger car + trailer |
Agricultural tractor + trailer |
| Spruce (1-year) | 150,000 | 60,000 | 15,000 | 6,000 | 15,000 |
| Spruce (2-year) | 100,000 | 40,000 | 10,000 | 4,000 | 10,000 |
| Spruce (bare-root) | 75,000 | 30,000 | 7,500 | 3,000 | 7,500 |
| Pine (1-year) | 100,000 | 40,000 | 10,000 | 4,000 | 10,000 |
| Birch (1-year) | 75,000 | 30,000 | 7,500 | 3,000 | 7,500 |

Display large image of Figure 2
LP-model
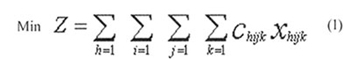
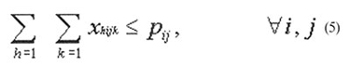
To explore the effects of different production and transportation strategies, minimization of long-distance transportation costs was set as an objective of the study. Transportation costs depended on the volume of seedlings transported, type of seedlings, transportation distance and type of vehicle used for transportation. In the LP model, presented below, transportation costs were based on full vehicle loads. Thus, transportation costs were assumed to depend linearly on transportation distance. In reality, it is usually not possible to transport the seedlings ordered by each customer only in full vehicle loads. This would lead to the problem of non-linear optimization, which we wanted to avoid here. After linearization of transportation costs, the LP-model was formulated as follows:
Where: 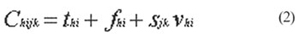
Subject to: 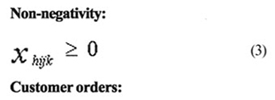
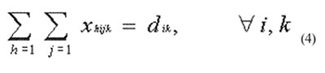
Production of seedling types at the nurseries:
The following symbols are used:
h refers to the transportation vehicle
i refers to the seedling type
j refers to the nursery
k refers to the customer
Z = total transportation costs of the nursery company
Chijk = the unit cost for seedling type i transported
from nursery j to customer k by vehicle h
thi = terminal cost per seedling type i for vehicle h
fhi = fixed cost per seedling type i for vehicle h
vhi = variable unit cost for seedling type i
transported by vehicle h
sjk = transportation distance from nursery j to
customer k
Xhijk = the amount of seedling type i transported from
nursery j to customer k by vehicle h
dik = the amount of seedling type i ordered by
customer k
pij = the production capacity of seedling type i in
nursery j
The model consisted of 6375 variables and 280 constraints. The LP problems were solved with What's Best! 5.0 solver run with the Microsoft Excel 2000 spreadsheet [11] .
RESULTS
Cost calculations showed that, when relatively large numbers of seedlings were transported long distances, transportation by pickup truck, delivery van with a trailer, passenger car with a trailer or tractor with a trailer was more expensive than transportation by truck with a trailer. In other words, truck with a trailer was the most cost-effective vehicle for transporting seedlings more than 32 kilometers (Figure 3). Because all transportation distances in the model input exceeded 32 kilometers, the only vehicle appearing in the model output was the truck with a trailer. It should be noted that the costs in Figure 3 are based on full loads and all-year usage of the transportation vehicles.
To analyze the effect of seedling production and long-distance transportation strategies on transportation costs, twelve experiments were carried out. The current situation (strategy 2) with five nurseries using DTS was set as the reference value (100) for the comparisons. The results of these comparisons are presented in Figure 4 and Figure 5. The demand for seedlings was constant and the customers the same throughout the experiments.

Display large image of Figure 3

Display large image of Figure 4
A decrease in the number of nursery units raised the total transportation cost due to an increase in the total transportation distance (Figure 4). The increase in cost was much smaller when CTS was applied to transportation planning. In this study, with the assumption of linear proportion of transportation cost and distance, the cost-effectiveness of CTS compared to DTS was the consequence of the shorter total transportation distance the company had to execute. In general, a centralized transportation strategy decreased transportation costs from 13.0 % to 36.5%, depending on the production strategies of the nurseries. For instance, in the case of equal allocation of seedling production among nurseries, reduction in the number of nursery units from 5 to 3 increased the transportation costs by 42.4% when DTS was applied and by only 12.5% when CTS was used in planning of transportations. The advantages of CTS compared to DTS were greatest when all production was focused on one nursery unit. It should be noted that a decrease in the number of nursery units means only putting an end to production, so that the original 5 units will continue as sales and storage sites.
The production strategy for three nursery units was selected for closer analysis in order to determine the effects of product specialization on transportation costs. To determine these effects three different strategies for allocation of seedling type production were studied. Studied strategies (3, 4 and 5) are presented in the material part of this study (Table 2 and Table 3). The same comparison as above was made for CTS and DTS. The current situation of 5 nursery units with small product specialization (strategy 2) was used as a reference index. The results of these comparisons are presented in Figure 5.
When the degree of product specialization increased, transportation costs also increased. The difference between no product specialization and high degree of specialization (Table 4) was 10.1% when CTS was used and 13.2% when DTS was applied (Figure 5). Thus, the increase in specialization slightly emphasized the advantages of CTS.
DISCUSSION
In Finland, the current development towards larger nursery units and seedling transportation organized by nursery companies seems to be very reasonable. Centralized planning of transportation makes it possible to optimize larger entities, thus leading to savings in transportation. In this case, a decrease in the number of nursery units from the current 5 (small degree of product specialization) to 3 (medium degree of specialization) increased the total transportation costs by 13.5 % when CTS was used in planning transportation and by 35.6 % when DTS was applied. The cost index for the first-mentioned current situation (DTS) was 100 and for the latter situation of 3 nursery units (CTS) it was 93 (Figure 5). Thus, according to this study, the centrally planned seedling transportation for 3 units could become even cheaper than transportation from the current 5 units by applying DTS. Within the company, the effect of level of product specialization on transportation costs was not as great as the effect of number of nursery units (Table 6). The production strategies presented here are the views of the authors and do not reflect the policy of the company studied.

Display large image of Figure 5
Table 6. Impact of production strategy on differences between CTS and DTS methods in terms of transportation cost.
| Production strategy | Cost difference between CTS and DTS, % |
|
| Number of nursery units |
Degree of product specialization |
|
| 5 | None | 13.0 |
| 5 | Small (current) | 18.0 |
| 3 | None | 31.3 |
| 3 | Medium | 31.4 |
| 3 | High | 33.1 |
| 1 | — | 36.5 |
In this study, decreasing the number of nursery units only means focusing production on fewer units as the former production locations will remain in use as sales and storage sites. In practice, a decrease in number of nursery units may slightly increase the proportion of seedlings transported long-distance in the CTS. This increase would consist of seedling orders to areas near abolished production units. Taking this increase into account may slightly reduce the advantages of CTS.
Naturally, evaluation of the optimal production and transportation strategies for a nursery company is much more complex than merely calculating transportation costs. First of all, the savings in costs achieved by a more effective system for managing transportation should be compared to the costs of acquiring, maintaining and using the system. Correspondingly, increased transportation costs caused by longer transportation distances with a smaller number of nursery units should be compared to the economic advantages achieved by larger production units. Nevertheless, according to this study and [9, 10] , it seems that current development towards larger size of production units gives marked advantages from the standpoint of production cost-effectiveness; and an unnecessary increase in transportation costs could be avoided due to better planning of transportation.
Linearization of transportation costs might cause a slight underestimation of the total costs. This is mainly due to the assumption of full vehicle loads. In these theoretical calculations the last load to each customer is rarely full. Due to linearization, the transportation cost of seedlings in that last load is the same as the cost of the other seedlings transported to the customer. Nevertheless, we can assume that, in practice, several last loads can be combined and delivered to customers at the same time. Recent surveys in Finland have indicated that, on average, the total logistic costs account for ca. 10% of a company's turnover. Typically, transportation makes up ca. 40% of the total logistic costs [2] . In this study, depending on applied production and transportation strategies, operative optimized long-distance transportation costs varied between 1.6 _ 3.1% of the nursery company's turnover.
Seedling production at nurseries can be directed to meet the forecasted demand in their marketing areas by using, for example, time-series data and harvesting statistics. In any case, growing tree seedlings in NIPF-dominated forestry is a production process in which production starts at least one year before the final demand for seedlings is known. To meet the regional demand, there can be some adaptation by transporting half-finished seedling material between nursery units. Seedling transportation is logistically challenging. Typical for seedling transportation are short periods of operation related to seasons and a need for special equipment. McKinnon [6] pointed out that physical distribution is increasingly becoming a specialist service that manufacturers purchase from outside agencies rather than organizing themselves. In this study, it was assumed that the transportation was purchased outside the company. Thus, all vehicle types were in productive work year round, and the fixed costs were not directed only to seedling transportation.
The results of this study are encouraging for long-distance transportation of seedlings by truck with a trailer. This is mainly due to the superior transportation capacity of truck and trailer combinations. Nevertheless, the transportation costs of truck with a trailer and pick-up truck were quite similar, and for both of these vehicles the sum of terminal and fixed costs was crucial. Thus, in terms of cost-effectiveness the order of these two vehicles might be sensitive to changes in cost calculation assumptions. The competitiveness of other vehicle types could be improved primarily through technical innovations that increase the transportation capacity. The results presented in this paper describe mainly the tactical level planning of transportation. It was assumed that seedlings transported long distances were shipped to FOA intermediate storage areas. Transportation from temporary storage to end-use areas is also needed. In practice, the interface between long-distance transportation and transportation to regeneration areas is indefinite: many of the seedlings can be transported directly from nurseries to regeneration areas. When seedlings are transported directly to regeneration areas, the unit size of each consignment would be much smaller than the units used in this paper. To distribute the seedlings to end-use areas as cost-effectively as possible, the convenience of each vehicle type should be re-evaluated. The applicability of vehicle-routing algorithms also needs to be studied.
Results of recent summer-planting studies with birch and spruce container seedlings have been promising [4, 5] . Thus, it seems that planting during the growing season will also become more common in the future. This development would lengthen the period of seedling transportation and bring the time factor to transportation optimization. In this context, dynamic linear programming [7] may become a useful method for solving tactical problems in seedling transportation. Further research is also needed to estimate the effects of linearization of the LP-model and applicability of more realistic methods for planning seedling transportation, such as integer-programming.
AUTHOR CONTACT
Mr. Rantala can be contacted by e-mail at -- juho.rantala@metla.fi
REFERENCES
[1] Aalto-Setälä, V. 1998. Economics of scale, concentration and market power in grocery sales. National Consumer Research Center, Publications 9. 29 pp.
[2] Kanerva, K., J. Lehtonen, R. Sandström and V. Tevä. 1997. Logistics in Finland 1996-1997. Ministry of Transport and Communications, Finland, Publications 33/97. 165 pp.
[3] Laakkonen, O. 1979. Optimal distribution of regional seedling production by nurseries: An economic study. Commun. Inst. For. Fenn. 95(5):1-32.
[4] Luoranen, J. 2000. Control of growth and frost hardening of silver birch container seedlings: growth retardants, short day treatment and summer planting. D.Sc.(Agr. and For.) thesis. The Finnish Forest Research Institute, Research Papers 777. 167 pp.
[5] Luoranen, J., K. Konttinen, R. Rikala and H. Smolander. 2001. Advanced results from container spruce summer planting studies. In: Poteri, M. [Ed.]. Yearbook of nursery research 2001. The Finnish Forest Research Institute, Research Papers 813:24-31.
[6] McKinnon, A. 1989. Physical distribution systems. Routledge. London & New York. 316 p.
[7] Palander, T. 1997. A local DLP-GIS-LP system for geographically decentralized wood procurement planning and decision making. Silva Fennica 31(2):179-192.
[8] Palander, T. 1998. Tactical models of wood-procurement teams for geographically decentralized group decision-making. D.Sc.(Agr. and For.) thesis. University of Joensuu, Faculty of Forestry. 49 p.
[9] Petäjistö, L. and P. Mäkinen. [ed.]. 1999. Metsäpuiden taimien kasvatus yritystoimintana. [Seedling production as a business in Finland]. The Finnish Forest Research Institute, Research Papers 727. 51 p.
[10] Rantala, J., K. Väätäinen, N. Kiljunen and P. Harstela. 2003. Economic evaluation of container seedling packing and disinfection machinery. Silva Fennica 37(1):121-127.
[11] What's Best! 2000. What's Best! User's manual. Lindo Systems Inc. Chicago, IL. 297 pp.