
Display large image of Figure 1
Vol. 14 No. 2 July 2003
P.A. Ackerman
University of Stellenbosch
Matieland, South Africa
R.E. Pulkki
Lakehead University
Ontario, Canada
The authors are, respectively, Department of Forest Engineering, Faculty of Agricultural and Forestry Sciences, and Dean, Faculty of Forestry and the Forest Environment.
ABSTRACT
Shorthaul transport, known as secondary intermediate transport (SIT), is an additional transport phase within traditional secondary transport in South Africa. It originates at roadside landing or depot and terminates at another depot or rail siding (not the final destination). The use of SIT is forced by poor and steadily declining forest road conditions, to the extent that highway type vehicles are unable to reach roadside landings. This necessitates the use of intermediate storage sites, from which the timber is once again loaded and transported to its final destination.
A network analysis model and grid cell-based geographic information system were combined to analyse the various transport scenarios within three study areas in the KwaZulu/Natal Midlands of South Africa, employing SIT on poor, high-density forest road networks.
Results show the South African forest industry's average annual transportation cost penalty, by maintaining SIT, to be $US 4.32 million or $US 0.82/m3 over the cost of transportation over an improved road network using only secondary terminal transport. This cost differential does not account for the cost of upgrades required to eliminate the need for SIT. However a net present value cost analysis of the inclusion of road upgrade costs versus the average annual transportation cost savings and increased forest yield from decommissioned roads, maintains a positive financial benefit.
Economic analysis highlighted the need for reduced road network densities and for improvement of the remaining network. This would eliminate extended primary transport, multiple loading, unloading and storage by allowing highway vehicles to transport timber from compartment roadside to its final destination.
Keywords: Network analysis, primary, secondary transport, forest products, hauling, roundwood, South Africa, GIS.
INTRODUCTION
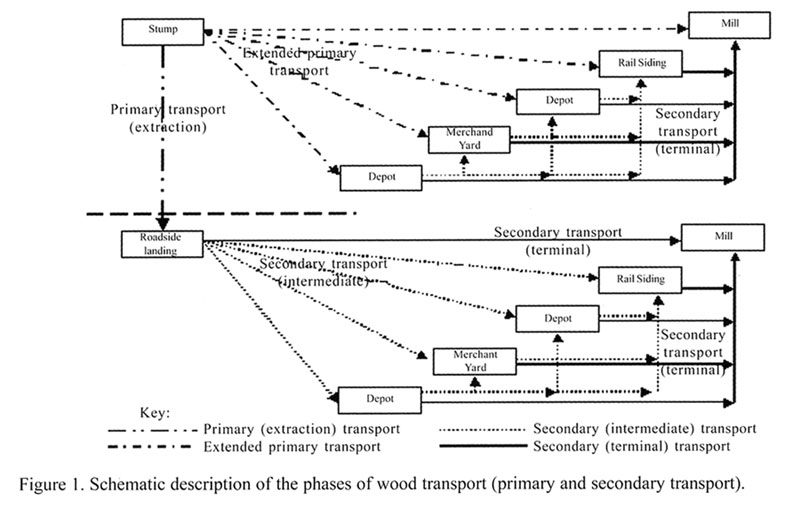
Secondary pulpwood transport, in South Africa, has been divided into two components; namely shorthaul and longhaul transport. Shorthaul, part of secondary transport, as a concept is not unique to South Africa; but the meaning assigned to the term is. Unfortunately, the use of these two terms is confusing and there is a need to develop standard terminology. This lack of exact terminology has created difficulties in the actual quantification of the economic impact of this mode of transport due to the overlapping of definitions in pulpwood operations. In most cases, additional transportation phases necessitate multiple handling and repeated storage of timber.
To avoid confusion in the terminology outlined above, the terms presented in Figure 1 are used in this study. Shorthaul will thus be referred to as secondary intermediate transport (SIT) and longhaul will be referred to as secondary terminal transport (STT).
During 1998, 5.4 million tonnes out of a total consumption of 9.4 million tonnes of pulpwood were delivered to mills by road, with the remaining 4 million tonnes transported by rail. SIT accounts for between 10 and 15% of the total delivered cost of pulpwood when used. Although SIT is not the largest cost component, it is the most expensive operation on a cost per t/km basis; $US 0.82 _ 0.40/t/km for an agricultural tractor and semi trailer configuration for SIT, versus $US 0.02/t/km for a large truck used for STT. A total of 3.7 million tonnes of pulpwood was subject to SIT for STT during 1998.
It was determined through surveys and studies [1, 9] that the main reason for the occurrence and maintenance of shorthaul is the poor and steadily declining state of the forest road network. Thus additional modes of transport have been included into the transport chain namely, secondary intermediate and extended primary transport. The economic impact of these actions has not been clearly established by the industry.
The objective of the study is to analyse the economic impact of SIT on pulpwood transport, by applying a simple grid cell-based GIS combined with network analysis.
Display large image of Figure 1
STUDY METHOD
For case studies, base stock maps of three estates were chosen. These are located north and northeast of the town of Richmond in the KwaZulu/Natal Midlands. The total area of the three estates is 4976.5 ha, delivering an annual volume of 42706.2 m3 (Table 1).
The underlying technique used in producing the spatial database is a grid cell-based geographic information system (GIS). The technique allows the use of a fixed grid network and facilitates the solution of large network problems [16] . The use of the fixed grid system facilitates the easy indexing of location. An additional advantage of a fixed grid system over geographical coordinates is that each grid cell has the same area, and linear distances can easily be calculated between points. With geographical coordinates, angular measurements would be required. Due to the above, easy storage of information in matrices by grid coordinates and the application of network analysis techniques are facilitated [10, 11] .
The entire areas of all three maps were divided into 50 m by 50 m grid cells (0.25 ha) and each grid cell was coded according to whether it contained a road (in road classes), compartment (as per surface cover), open areas and areas outside the plantation boundaries. If a grid cell contained a road, it was coded as road, with priority given to the highest road class. With other categories, the one making up the majority of the grid cell was assigned. The centre point of each grid cell defined a road network node. The raster data can be generated manually from a map sheet or automatically from GIS. In this case study, the raster data was manually generated and separate grid cell maps for roads and surface cover were generated for each estate. Manual data generation, for all three estates, was completed in a matter of 15 hours.
As demonstrated in a method developed by [10] , all grid-referenced information recorded in this study is referred to as a spatial database. With data readily available, in digital format for each grid cell, the required information matrices and data files for the areas can be developed.
Table 1. Individual case study estate detail, addressing individual and total area, volumes and current road densities.
| Detail | Uplands | Highlands | Greenhill | Total |
| Hardwood area (ha) | 542.8 | 1217.8 | 1288.0 | 3048.6 |
| Softwood area (ha) | 139.5 | 93.7 | 314.5 | 547.7 |
| Non-timber area (ha) | 443.4 | 256.0 | 680.7 | 1380.1 |
| Total area (ha) | 1125.7 | 1567.5 | 2283.3 | 4976.2 |
| Annual volumes (m3) | 7546 | 16087.7 | 19072.5 | 42706.2 |
| Road densities (current) (m/ha) | 94.66 | 50.70 | 52.16 | |
With data stored in spatial databases, the creation of information matrices follows. These are used for data manipulation and analysis. The information matrices can be thought of as map overlays containing some type of information of interest (these map overlays are developed in the network analysis programme).
Network analysis and shortest route algorithm
The most frequently used model in planning forest transportation and forest road networks is the shortest path (or route) model. The aim of applying network analysis is to find the minimum total time path through the network. The algorithm used and outlined below is based on work from [3, 10, 16] . Times are determined between the destination node and all other nodes in the network incrementally. The times from all nodes to a destination node are then checked repeatedly by comparing the differences in times to each node minus the time to all directly connected nodes, to the time of connecting two nodes. If the difference is less than or equal to the time to connect the two nodes, no shorter route can be found between the two nodes and the next route is checked. If the above condition is not met, a new minimum time is calculated to the adjacent node by adding the time to connect the two nodes to the minimum time of the node used in the check. The process is repeated until no changes in minimum time are made and the start point is reached [11] .
The algorithm developed for the fixed grid structure allows only arcs between adjacent grid cells to be analysed. In this way only four nodes are tested for solution improvements in network analysis. If a road node is not connected to four other nodes, dummy arcs back to itself at very high impediment are set so that each node has four records. The distances between all nodes through the network are available for the network analysis procedure.
Road density reductions
Manipulations of the database were restricted to the roads database matrices. Two road reduction exercises were undertaken for each area. The general approach in the first reduction was to reduce the number of road grid cells on all plantations by approximately 50%. The second procedure reduced the number of road grid cells to 30% of the original number. These reductions were applied in order to increase road spacing for each estate, to 200 and 600 metres respectively. The procedure followed was to remove all roads with grades greater than 12%, remove all class D and those class D roads that were necessary to maintain the integrity of the network were upgraded to class C roads.
Travel times and equipment costing
The empty and loaded driving speeds, for all road classes, cost and load volumes, as applied to the combined network analysis procedure, are presented in Table 2. In order to estimate driving times over different road standards, average loaded and unloaded travel speed of the various vehicles were determined [7, 14, 15, 17] .
The costs per hour for each of the vehicles were calculated using standard machine and vehicle costing models. The models consulted were, [4, 5, 6, 12, 13, 18] . In particular the vehicle-costing model was sourced from [2 , 8] . Cost of timber and log preparation at stump has been excluded from this study. This activity is common and similar to all three systems and the study is mainly concerned with primary and secondary transport from stump area to plantation exit.
Table 2. Individual travel speeds, costs and payload sizes for applied equipment over different road classes both in the loaded and unloaded state.
| Travel speeds in km/hour | ||||||
| Road Class | Agricultural tractor and (bundle) semi-trailer. $US 10.34/hr and 7.6m3/load |
Agricultural tractor and semi-trailer. $US 15.49/hr and 19.7m3/load |
Rigid truck and drawbar trailer. $US 31.65/hr and 45m3/load |
|||
| Loaded | Unloaded | Loaded | Unloaded | Loaded | Unloaded | |
| Provincial | 13.0 | 14.0 | 28.0 | 30.0 | 35.0 | 40.0 |
| A | 8.0 | 8.0 | 10.0 | 25.0 | 25.0 | 30.0 |
| B | 8.0 | 8.0 | 10.0 | 22.0 | 23.0 | 28.0 |
| C | 5.0 | 5.0 | 8.0 | 10.0 | 17.0 | 20.0 |
| D | 5.0 | 5.0 | 8.0 | 10.0 | 17.0 | 20.0 |
| In-field | 2.2 | 2.5 | 3.0 | 40 | ||
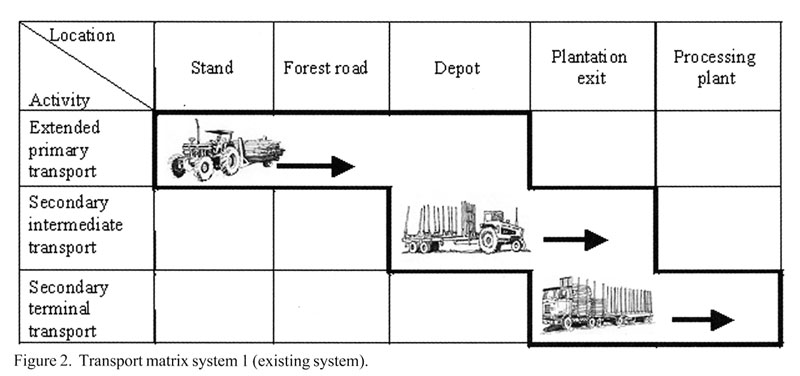
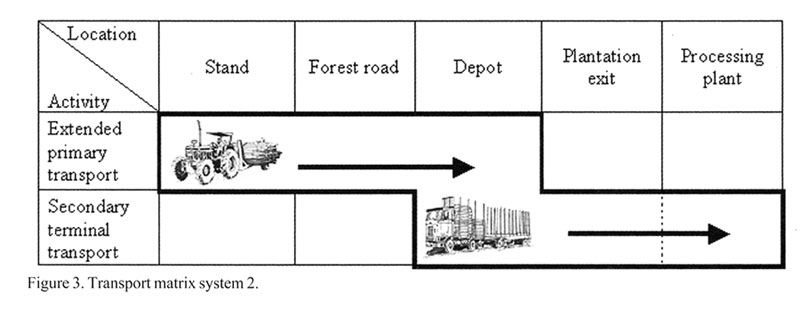
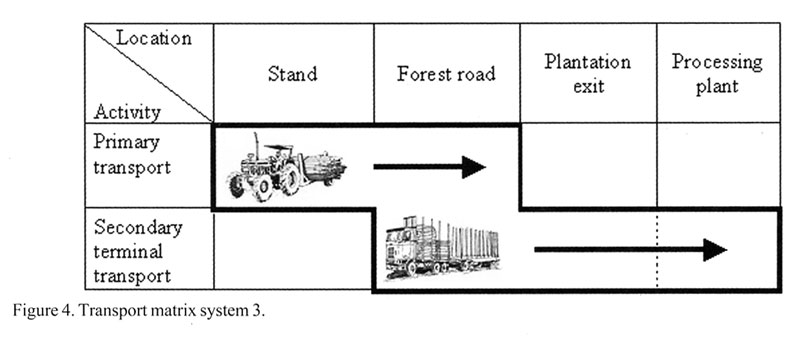
The following transport systems were applied to the study (Figures 2, 3 and 4):
Transport systems 1 and 2 were applied to all three road density scenarios (100%, 50% and 30%) and identified as 1 or 2 (100%), 1 or 2 (50%) and 1 or 2 (30%). System 3 was only applied to road density scenario (30%) because this transport system can only access the compartment at roadside on the improved road system associated with the (30%) road density scenario. It is identified as 3 (30%).

Display large image of Figure 2

Display large image of Figure 3

Display large image of Figure 4
Loading operations
Loading operations occur at roadside, depot and/or at the plantation exit point/sinks by means of three wheeled log loaders. Because loading at stump is common to all systems it is not included in the study. Unloading is accomplished by tipping the load from the trailer, and therefore minimal cost is attached. For systems 1 and 2, loading does occur at the depot site for transport to the plantation sink. System 1, however, has to be reloaded onto highway vehicles at the plantation exit point for transport to the processing plant. System three has one loading operation at roadside after the primary transport operation.
The inclusion of this second loading cost (set at $US 0.45/ m3) for system 1 is necessary to bring the operation in line with system 2 and 3, where timber has already been loaded onto highway vehicles at the depot and roadside, respectively. The highway vehicles thus arrive at the plantation exit/sink (the point at which the study ends) ready to move on to the processing plants. Thus the stages of the operations are all similar and comparable at the plantation exit.
Road upgrade costs
When calculating the cost of road upgrading required to make each depot and each compartment accessible to truck transport, the following is taken into account. For truck transport to reach depot sites in transport system 2 (50%), it is assumed that only plantation class A roads are upgraded, as provincial roads are suitable for this type of transport system. All depots are situated on either provincial or class A roads. For truck transport to reach individual logging compartments, roads of class A, B and C have to undergo upgrading.
Class A roads are to be upgraded over a period of no longer than two years in order to maintain sustained timber removal and the integrity of the road network. In the case of truck transport directly from logging compartments, roads are upgraded over a period of ten years, which is the weighted average rotation period for the plantations. Compartment scheduling is a key component in this case to concentrate road upgrades and maintain sustainable transport operations.
Road upgrade costs are based on current South African costs. The cost to upgrade class A roads to depots, to allow all-weather truck transport, is US$ 8000/km. The cost to upgrade classes A, B and C roads to allow truck transport directly from compartments is US$ 7000/km. For truck transport directly from compartments, applicable roads are upgraded to a specified standard to accommodate truck transport, but not all roads require all-weather surfaces. Dry and wet period scheduling will be applied in the annual plan of operations. A ratio of 70% all-weather roads and 30% dry-weather roads is assumed.
The current real interest rate for South Africa of 4.5% per year is used in the Net Present Value (NPV) calculations. NPV's of upgrading costs for two and ten years into the future are compared to the potential average annual transport cost savings between the present system and truck transport from depots and truck transport from individual compartments into perpetuity.
Road maintenance costs are not included or taken into account as it is assumed that maintenance budgets will remain the same into the future, but allocated to fewer roads as a result of the road reduction scenarios. This indicates that more money will be available per metre of road with the potential of improved maintenance.
A reduction in road densities, through all three estates, creates the potential of increased plantation area. This is an opportunity that must be accounted for in conjunction with the alternative transport systems cost savings and road upgrade costs, when evaluating the overall financial benefit. Calculation of increased stumpage revenue takes into account a 12 m road right-of-way, a weighted mean annual increment of 15m3/ha/yr and an average stumpage price of US$ 10/m3. The plantation area gain is calculated from the difference, in area freed-up for additional tree growing, between road density scenarios (100%) and (50%), and, (100%) and (30%). The NPV of the opportunity cost is calculated into perpetuity at the current real rate of interest.
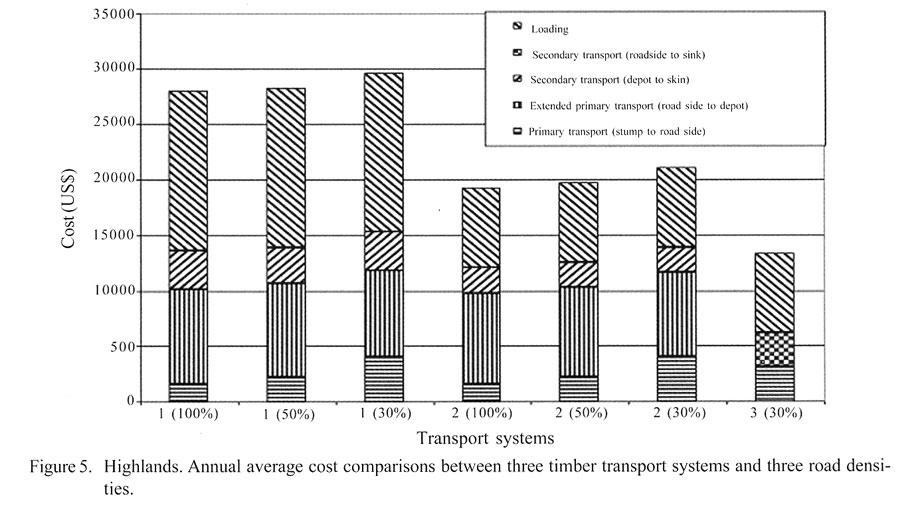
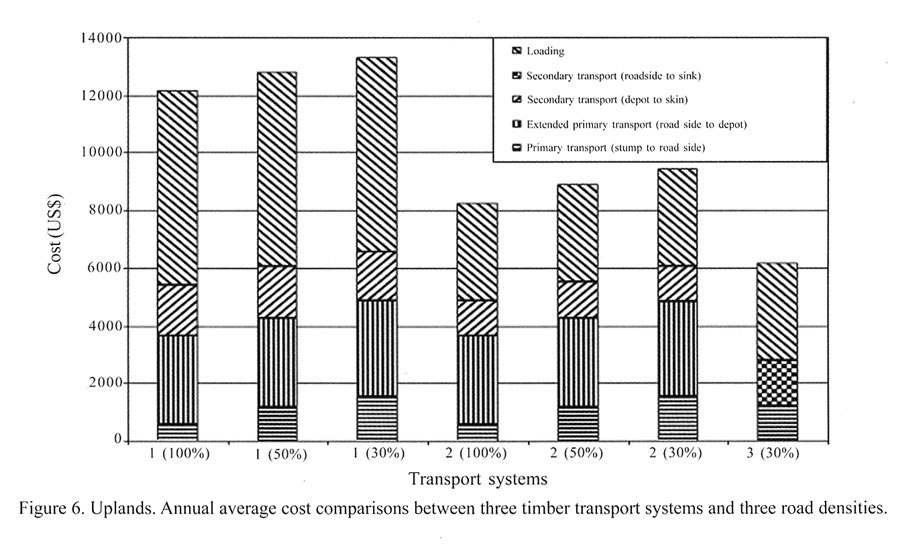
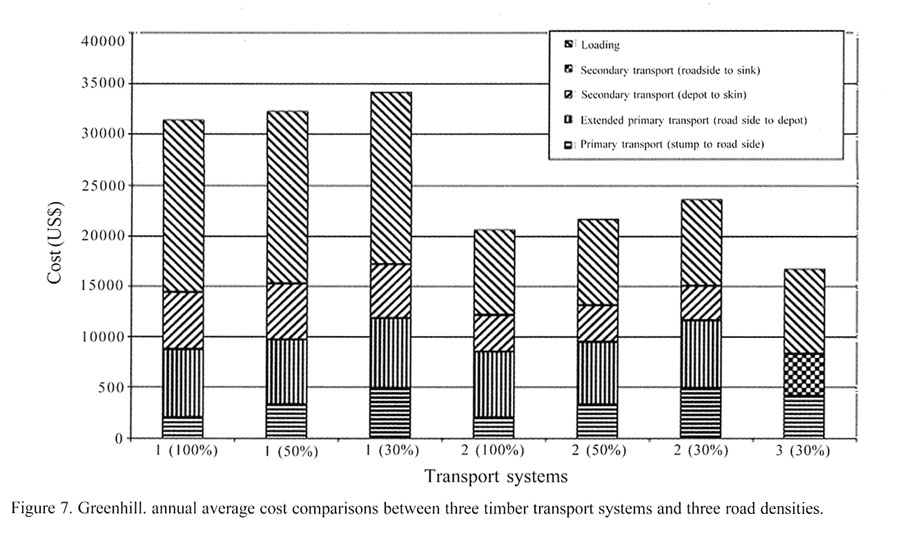
RESULTS AND DISCUSSIONS
In all three case study areas, there is an increasing trend (for transport systems 1 and 2), in total average annual transport costs, as road densities decrease (Figures 5, 6 and 7). This is due to longer off-road transport distances (primary transport) and thus higher cost of primary transport. There is also an additional loading phase in transport system 1. Transport system 3, over road density scenario (30%), delivers the lowest total average annual cost of timber transported, including the cost of road upgrades required to make each compartment accessible to truck transport and the increased stumpage revenue from additional plantation area made available due to reduced road density (Table 6).

Display large image of Figure 5

Display large image of Figure 6

Display large image of Figure 7
The cost differences between transport system, 3 (30%) and the currently employed system, 1 (100%), are reflected in Table 3 and indicate at least a 46% cost reduction in all three case study areas.
The current road density scenario (100%) is not suitable for use by rigid truck and drawbar trailer vehicles, due to road surface, geometry and alignment limitations, and only transport systems 1 and 2 can access this scenario. Access, to rigid truck and drawbar trailer vehicles, as far as the depot, for road density scenarios (100%) and (50%), will only be possible if road network upgrading is undertaken up to that point. Transport systems 2 (100%) and 2 (50%) make provision for rigid truck and drawbar trailer vehicle access as far as depots in this study. Road scenario (30%) does in theory however, allow access to the compartment roadside by rigid and drawbar trailer vehicles because of road network density reductions, coupled with road upgrading and maintenance.
Total average annual transport costs for each system per plantation have been tabulated for comparison (Table 4). The cost difference between transport system 3 (30%) and all the other transport systems are listed in Table 5. This indicates the theoretical cost savings to be gained by applying transport system, 3 (30%), as opposed to the other transport systems.
The average transport cost saving for the change from the current transport situation 1 (100%) to transport system 3 (30%), is $US 0.82/m3 transported. The obvious choice, in line with the underlying thought behind this study, is for part of these savings to be used on road deactivation and upgrading in order to implement the more efficient transport system, 3 (30%). These roading activities should be phased in over a full rotation in order to limit the financial pressure on cash flows. The more road densities decrease through time, the greater the potential savings.
Table 3. Transport costs for systems 1 (100%) and 3 (30%), cost differences and average annual saving with adoption of system 3 (30%).
| Area | System 1 (100%) $US/m3 (current system) |
System 3 (30%) $US/m3 |
Average cost difference $US/m3 |
Average annual cost saving ($US) |
| Uplands | 1.60 | 0.81 | 0.79 | 6010 |
| Highlands | 1.73 | 0.83 | 0.90 | 14616 |
| Greenhill | 1.64 | 0.88 | 0.76 | 14606 |
Table 4. Total average annual and per unit costs per plantation per transport system.
| Estate/ Transport systems |
Uplands | Highlands | Greenhill | |||
| ($US) | $US/m3 | ($US) | $US/m3 | ($US) | $US/m3 | |
| 1 (100%) | 12180 | 1.61 | 27978 | 1.74 | 31387 | 1.65 |
| 1 (50%) | 12822 | 1.70 | 28257 | 1.76 | 32214 | 1.69 |
| 1 (30%) | 13309 | 1.76 | 29639 | 1.74 | 34169 | 1.79 |
| 2 (100%) | 8271 | 1.10 | 19319 | 1.20 | 20628 | 1.08 |
| 2 (50%) | 8899 | 1.18 | 19710 | 1.23 | 21623 | 1.13 |
| 2 (30%) | 9434 | 1.25 | 21074 | 1.31 | 23572 | 1.24 |
| 3 (30%) | 6169 | 0.82 | 13362 | 0.83 | 16780 | 0.88 |
Table 5. Average annual savings to be expected between transport system 3 (30%) and transport systems 1 (100%), 1 (50%) and 1 (30%).
| Transport systems |
Savings Uplands ($US and $US/m3) |
Savings Highlands ($US and $US/m3) |
Savings Greenhill ($US and $US/m3) |
Volume weighted average saving ($US/m3) |
| 1 (100%) – 3 (30%) | 6010 | 14616 | 14606 | |
| 0.79 | 0.91 | 0.77 | 0.82 | |
| 1 (50%) – 3 (30%) | 66522 | 14895 | 15433 | |
| 0.88 | 0.93 | 0.81 | 0.87 | |
| 1 (30%) – 3 (30%) | 71400 | 16277 | 17388 | |
| 0.94 | 1.02 | 0.91 | 0.95 | |
Extended primary transport is an integral part of the current transport system as previously mentioned. Even if the secondary transport phase changes from SIT to STT by employing a rigid truck and drawbar trailer instead of the agricultural tractor and semi-trailer from depot, the inefficiency of the extended primary transport along existing roads, remain.
A potential weighted average cost saving of $US 0.82/m3 or $US 1.17/t was established between system 1 (100%) and 3 (30%), based on the cost of applying SIT under conditions of this study. Accordingly, the total annual cost of applying SIT to depots for road transport to mills for the South African industry is $US 4.32 million.
Road density reductions will have the benefit of real increased expenditure on road maintenance per metre of road without any increase in the budgeted amount. The extent of such "increased" allocation per metre of road depends entirely on what the road reduction is and the initial funds available. The fact that more funds will be allocated per metre of road is a reality.
When road-upgrading costs are included in the evaluation of the alternatives (Table 6), and NPV's of road upgrade costs and transport savings compared, system 2 (50%) yields the best option for the three estates. When the NPV value differences with system 1(100%) are summed for all three estates, system 2(50%) yields an overall NPV saving of US$ 291037, while system 3(30%) yields an overall NPV saving of US$ 269760.
However, assuming a road right-of-way width of 12 m, the opportunity cost forgone of creating an additional 231.3 ha of forest against 160.2 ha with road density reduction scenarios to 30% and 50% of the original 100%, respectively, must be considered (Table 6). Assuming a mean annual increment of 15 m3 and an average local stumpage price of US$ 10/m3 the annual wood income increase would be US$ 10665. The NPV of this series of incomes in favour of system 1(30%) over system 2(50%) is US$ 237000, which far exceeds the NPV advantage of system 2(50%) when only road upgrade and transport costs are included. The overall NPV for system 3 (30%) is US$ 215723 greater than for system 2 (50%).
Table 6. Net present value comparisons between the current road and transport situation (system 1 (100%)), and road upgrading and average annual savings of applying alternative transport systems over two road density scenarios.
| Uplands | Highlands | Greenhill | ||||
| Road class and other evaluation categories |
System 2 and road density 50% |
System 3 and road density 30% |
System 2 and road density 50% |
System 3 and road density 30% |
System 2 and road density 50% |
System 3 and road density 30% |
| Class provincial (kms) | 6.6 | 6.1 | 4.4 | 4.1 | 10.0 | 9.2 |
| Class A (kms) | 4.5 | 4.0 | 6.7 | 6.1 | 11.2 | 10.1 |
| Class B (kms) | 26.2 | 15.6 | 32.0 | 14.3 | 37.6 | 15.0 |
| Class C (kms) | 11.7 | 8.6 | 9.5 | 8.1 | 11.5 | 11.0 |
| Road upgrade length (kms) Class A | 4.5 | 6.7 | 11.2 | |||
| Road upgrade length (kms) Class A, B and C | 28.2 | 28.5 | 36.1 | |||
| Upgrade distance Class A (km/2 years) (kms) | 2.25 | 3.35 | 5.60 | |||
| Upgrade distance Class A, B and C (km/10 years) (kms) | 2.82 | 2.85 | 3.61 | |||
| Total cost (US$), Class A at US$ 8000/km | 18000 | 26800 | 44800 | |||
| Total cost (US$), Class A, B and C at US$ 7000/km | 19740 | 19950 | 25270 | |||
| NPV road upgrading costs (US$) (two and ten years) | 36684 | 155946 | 54618 | 157605 | 91302 | 199633 |
| NPV average annual saving on transport (US$) into perpetuity | 72913 | 133664 | 183751 | 324800 | 216978 | 324580 |
| Difference in NPV with System 1 (100%) based on transport cost savings and road upgrading costs (US$) | 36229 | -22382 | 129133 | 167195 | 125675 | 124947 |
| Additional plantation area available for system 2 (50%) and 3 (30%), (ha) Additional plantation area | 69.1 | 86.6 | 32.4 | 56.2 | 58.7 | 88.5 |
| Annual increase in stumpage revenues (US$) | 10365 | 12990 | 4860 | 8430 | 8805 | 13275 |
| NPV of increased stumpage revenues (US$) | 230333 | 288667 | 108000 | 18333 | 195667 | 295000 |
| Overall difference in NPV with System 1 (100%) | 266562 | 266285 | 237133 | 354528 | 321342 | 419947 |
CONCLUSIONS AND RECOMMENDATIONS
To haul timber by means of secondary intermediate transport (SIT), from roadside to a depot for intermediate storage, before it is finally transported to processing plants via the plantation exit has been identified as an additional transport phase in pulpwood transport in South Africa. This study calculated the cost of the inclusion of this phase of transport, to the pulpwood industry, to be $US 0.82/m3 or $US 1.17/tonne. With the estimated volume of 3.7 million tonnes of pulpwood subjected to SIT, the total average annual cost of SIT, to the industry, is $US 4.32 million. By not employing SIT the industry will potentially save $US 0.46 for every tonne of the 9.4 million tonnes consumed by pulpwood processing plants annually.
When the cost of road upgrading required to eliminate the need for SIT is included in the analysis, transport system 2 (50%) yields a NPV that is US$ 21277 better than for system 3 (30%) when the NPV's of all three estates are summed. With the inclusion of income from trees grown on plantation area freed up due to reduced road density, system 3 (30%) has a total NPV that is US$ 215723 greater than for system 2 (50%).
System 3 showed the lowest average annual cost of transport (excluding road-upgrade costs), while system 1 was the most expensive operation. The reasons for system 3 having the lowest cost are:
Apart from a common primary transport phase to roadside, system 3 has only one other transport phase by high payload vehicle (STT) and this is direct to the processing plant via the plantation exit from compartment roadside, over a lean and improved road network.
System 2 is less expensive than system 1 due to the improved transport system from depot to plantation exit/sink. A rigid truck and drawbar trailer vehicle, with higher speeds and payloads, replaces the agricultural tractor and semi-trailer. There is also one less handling and loading phase associated to this transport system. There is a general upward trend in costs for systems 1 and 2 with decreasing road density. This is expected due to increased primary transport distances.
The following recommendations will be useful in making the transition away from the current SIT-dominated system:
AUTHOR CONTACT
Pierre Ackerman can be reached by e-mail at -- packer@sun.ac.za
REFERENCES
[1] Ackerman P. 2001. An investigation into the shorthaul of pulpwood in South Africa. Thesis presented in partial fulfillment of the requirements for the degree of Master of Science in Forestry. Stellenbosch. 180pp.
[2] Anon. 1999. Road freight vehicle costing schedules. Issued to paid-up members of the Road Freight Association of South Africa. 25pp.
[3] Dykstra D.P. 1984. Mathematical programming for natural resource management. McGraw-Hill Book Company, New York.
[4] Franklin G.S. 1997. The business of logging: A workbook for use with the video. Forest Engineering Research Institute of Canada (FERIC).
[5] Grobbelaar E. 2000. Systems approach to forest engineering costing. In D.L. Owen (ed). South African Forest Handbook. South African Institute of Forestry. Menlo Park. Pretoria. Vol. 1: 291-299.
[6] Hoffman B.F. 1991. How to improve logging profits. Published by The Northern Loggers' Association, Inc. Old Forge NY.
[7] Larcombe G. 1999. Forest roading manual. LIRO Forestry Solutions. Rotorua, New Zealand.
[8] Lowe D. 1989. Goods vehicle costing and pricing handbook. Fourth edition. Biddles limited, Guildford and King's Lynn.
[9] Morkel R. 1999. The shorthaul conspiracy. Paper presented at the SAIF Transport Conference - Shorthaul roundwood transport? Pietermaritzburg. Kwa-Zulu/Natal, Nov. 18.
[10] Pulkki R.1984. A spatial database - heuristic programming system for aiding decision-making in long-distance transport of wood. Acta Forestalia Fennica 188.
[11] Pulkki R. 1996. Water crossings versus transport costs: A network analysis case study. Journal of Forest Engineering. 7(2): 59-64.
[12] Riddle A. 1994. Business management for logging. New Zealand Logging Industries Research Organisation. Rotorua.
[13] Sessions J. and Sessions J.B. 1992. Cost control in forest harvesting and road construction. FAO Forestry paper 99. Food and Agriculture Organisation of the United Nations. Rome.
[14] Shuttleworth B. 1999. Work-study evaluation of Sappi long length harvesting system. Draft copy and unpublished confidential report.
[15] Shuttleworth B. 2000. Vehicle travel speeds - an Indonesian experience. Unpublished work.
[16] Taha H.A. 1982. Operations research an introduction. Sixth edition. Prentice Hall, New York.
[17] Van Daele, P. 1999. Melmoth forwarder evaluation. Study reference: 03060499. Unpublished work-study report. Mondi Forests, Pietermaritzburg.
[18] Warkotsch P.W. 1994. A guide to the calculation of machine costs. In H.A. van der Sijde (ed). South African Forestry Handbook. South African Institute of Forestry. Aurora Publishing, Pretoria: 457 - 469.