
Display large image of Figure 1
Vol. 14 No. 2 July 2003
T. Nordfjell
Swedish University of Agricultural Sciences
Umeå, Sweden
D. Athanassiadis
Forest Engineering Research Institute of Canada
Quebec, Canada
B. Talbot
The Danish Forest and Landscape Research Institute
Hoersholm, Denmark
The authors are, respectively, Associate Professor, Department of Silviculture, Swedish University of Agricultural Sciences and Professor, The Danish Forest and Landscape Research Institute; Post Doctoral Fellow, Forest Engineering Research Institute of Canada; and PhD Student, The Danish Forest and Landscape Research Institute.
ABSTRACT
Forwarder fuel consumption was studied by examining a total of 27 forwarders under field conditions. Three datasets, representing different data acquisition methods, were used. In a field study, time and fuel consumption by work-element of two 20-21 tonne forwarders in final felling were recorded. In a questionnaire survey, daily data concerning fuel consumption, productivity and average extraction distance was provided on 18 forwarders, divided between final felling and thinning. Finally, accounting data on fuel consumption for 11 forwarders were obtained.
In the field study, the fuel consumption varied between 8.3 to 15.7 l/PMH (productive machine hour) for different work elements. The total fuel consumption was 0.28-0.36 l/m3sub (solid under bark) at average extraction distances on 360-412 m for loads of sawlogs and 0.43-0.66 l/m3sub (458-514 m) for loads of pulpwood. 61-62% of that fuel was consumed during loading and driving during loading. The forwarders consumed 0.23-0.38 l/100 m driving and the difference was only 10% with and without load. In the questionnaire survey, the fuel consumption averaged 0.62 l/m3sub (sawlogs and pulpwood, 318 m average extraction distance) for final felling (16-20 tonne forwarders) and 0.92 l/m3sub (644 m) for thinning (11-14 tonnes). An exception was 2.5 tonne forwarders that consumed only 0.35-0.37 l/m3sub (120-180 m). 89% of the extracted volume in the accounting data was from thinnings and the fuel consumption was in average 0.67 l/m3sub (100-200 m) for 9 to11 tonne forwarders.
More difficult terrain conditions, the use of tracks and wheel-chains and one more assortment in the questionnaire survey are the most probable reasons for higher fuel consumption than in the field study. At long extraction distances it is especially important to utilize the maximum load capacity to benefit low fuel consumption on m3 basis.
Keywords: CTL, extraction, final felling, forwarder, fuel consumption, logging, thinning, Denmark, Sweden.
INTRODUCTION
The fuel consumption in a harvesting operation is of both economic and ecological importance. According to Favreau and Gingras [10] , fuel consumption in the CTL method accounts for about 10% of the total cost of a harvesting operation in Canada. In Sweden, where fuel prices are considerably higher, fuel costs account for approximately 20% of the direct harvesting cost in a final felling [cf. 12] . In Sweden, extraction by forwarder accounts for about 10% of the total raw material cost for the forest industry [1] and forwarding accounts for just under half of the total fuel consumed in the operation from felling to roadside [4] . Fuel consumption can be used as an estimator for the machines' operating costs. This has proven successful for different machines from power saws to harvesters [22] .
Eighty to 95% of the total energy input and discharges to the environment (CO2, CO, NOx, HC and particulate matter) during the life cycle of forest machines can be associated with fuel consumption during machine operation [2 , 3] .
Reducing fuel consumption per unit produced is a key issue in the economics of forest products and in moving towards more sustainable forest management practices.
Data on forwarder fuel consumption from field operations are often not readily available. Due to the complexity of the working method and the large variation in working conditions, extended field studies would be necessary to create a general model of forwarding. In most of the studies fuel consumption is estimated through questionnaires addressed to machine owners, operators and forest companies [4 , 6 , 20] , data derived from test driving cycles [11] or data derived from studies made under controlled conditions e.g. driving on defined trails [7, 14,15, 16, 21] . At the enterprise level, fuel consumption figures often exist only in the form of accounting data [23] .
The above-mentioned studies show that factors influencing forwarder productivity (travel distance, load size, log and bunch size, grapple volume, terrain conditions, operator skill, and assortment diversity) also influence fuel consumption. Test driving cycles and studies of driving on defined trails fail in representing the diversity of actual operating conditions while questionnaire surveys and analyses of accounting data have a low degree of associated detail. The lack of accurate fuel consumption figures contributes to uncertainty of the true cost and emission levels of forest operations and inhibits potential improvements in machine design.
The aim of the present study was to establish fuel consumption means and ranges per forwarded unit of timber and productive machine hour, and determine the proportional allocation of the fuel consumed to the various work elements involved.
MATERIAL AND METHODS
A field study and a questionnaire inquiry were conducted in Sweden. In Denmark, accounting data were obtained from the State Forest Agency. All the forwarders involved in the studies operated on diesel fuel and on a snow-free forest floor.
In the field study, the time and fuel consumption by work-element of two 20 - 21 tonne forwarders, a Valmet 890 (V890) and a Timberjack 1710 (TJ1710), were measured (Table 1). The study was carried out on two clear cuts, 140 km and 60 km west of Umeå in northern Sweden, for the V890 and the TJ1710 respectively. The stands were Scots pine (Pinus sylvestris) dominated with a total harvested volume of 151-175 m3sub (solid under bark) (Table 2). The volume of saw logs was almost similar on both sites. Ground strength, Ground roughness and Ground inclination were assessed as 1 or 2 (easy conditions) on a five-degree scale [5] . A significant difference between the sites was a 90 m long and 17% steep downhill slope between the harvesting area and the landing for the TJ1710. For the V890 the corresponding part of the extraction trail was nearly flat. There was a single operator on the TJ1710, while there were two on the V890. All operators had more than 2 years of experience with forwarders. No wheel-chains or bogie-tracks were used. The operations took place over a two-week period in 1999. All activities associated with the forwarding were summarised into four work elements; Driving unloaded, Loading (including driving while loading), Driving loaded and Unloading (Table 3). Before the commencement of the study, a harvester sorted the logs into small piles of pulpwood and sawlogs at the harvesting site, which is common practice. Sawlogs and pulpwood had minimum top diameters of 11 and 5 cm respectively. The overall average log length was 3.6 m and 4.3 m for the TJ1710 and the V890 respectively. Only one assortment (i.e. sawlogs or pulpwood) was extracted in a load. For each load, time consumption, fuel consumption and travelled distance were recorded during all work elements. Delays shorter than 2 minutes were incorporated into the work element during which they occurred. Fuel consumption while idling was measured separately during a period of 25 minutes.
Table 1. Field study forwarder specifications.
| V890 | TJ1710 | |
| Engine | Valmet 620 DS | Perkins 1306-8TI |
| Output (kW) | 130/2400 rpm | 157/2200 rpm |
| Torque (Nm) | 630/1400 rpm | 847/1600 rpm |
| Transmission | Hydrostatic-mechanical | Hydrostatic-mechanical |
| Working revolutions (rpm) | 1400 | 1340 |
| Idling revolutions (rpm) | 650-750 | 900 |
| Wheels and tires | 8 wheels (650 ´ 26.5) | 8 wheels (750 ´ 26.5) |
| Mass and maximum load (kg) | 20 110/ 18 000 | 20 910/ 17 000 |
| Loader/Grapple | Cranab 1200 / Cranab 365 | Timberjack 111F / Hultins 360 |
Table 2. Field study area data
| Harvested volume, sawlogs (m3sub/ha) | V890 | TJ1710 |
| 118 | 120 | |
| Harvested volume, pulpwood (m3sub/ha) | 33 | 55 |
| *Wood concentration (m3sub/100m) | 35 | 42 |
| Average stem volume (m3sub) | 0.24 | 0.20 |
| **Ground strength (class) | 1 | 1 |
| **Ground roughness (class) | 2 | 2 |
| **Ground inclination (class) | 2 | 1 |
| *m3sub, sawlogs and pulpwood together for every 100 m driving distance on the site. | ||
| ** according to the Swedish Terrain Classification System [5] . | ||
Table 3. Definition and delimitation of work elements.
| Work element | Definition and delineation |
| Driving unloaded | Begins when the forwarder starts to move from the landing and ends when the boom starts to move for loading. |
| Loading | Begins when the boom starts to move for loading and ends when the forwarder is fully loaded and the boom is placed for driving. This work element includes also driving during loading (driving on the site to collect logs) |
| Driving loaded | Begins when the forwarder starts to move after loading and ends when the boom starts to move for unloading. |
| Unloading | Begins when the boom starts to move for unloading and ends when the forwarder is empty and the boom is placed for driving. |
The mass of each load was registered at the landing by means of a vehicle weighing system (Telub 20T). Load volume was estimated with wood density set to 995 kg/m3sub [24] . Time consumption per work element was measured with a Husky Hunter computer running Siwork 3 software [19] . Diesel consumption was recorded with a VDO Kienzle 1404 flow measuring system. Travel distance was recorded with an Eltripp 26S for the V890 and with the Timberjack TMC system for the TJ1710. Both pieces of equipment were calibrated daily. The Independent Sample t-Test procedure of SPSS [17] was used to identify significant differences in the data set. The Linear Regression procedure of the same statistical package was used to generate equations that predict fuel consumption and productivity on the basis of the average extraction distance (the average of the travelled distances of the logs).
For the questionnaire survey, ten operators of company owned medium-sized (11-14 tonnes) forwarders, used in thinnings, and large sized (16-20 tonnes) forwarders used in final fellings responded. Also 4 contractors using small (2.5 tonnes) forwarders in both thinnings and final fellings responded (Table 7). The harvested volumes were 150-210 m3sub/ha for final fellings and 35-65 m3sub/ha for thinnings. Daily data concerning type of harvesting operation (final felling or thinning), fuel consumption, number of loads, average extraction distance and transported wood volume were provided for a total of 1420 E15 hours (productive time, including delays shorter than 15 minutes) and 22 470 m3sub. The logs mostly fell into three assortments with lengths averaging from 3.7 to 4.5 m. Terrain conditions were generally categorised into classes 2 and 3 [5] . The average extraction distances were 270-340 m for final fellings and 600-720 m for thinnings. The 2.5 tonne forwarders operated on average extraction distances of 120-180 m and were not fitted with tracks or wheel-chains. Most of the corporately owned forwarders were fitted with these accessories. All operators were regarded as experienced. The stands were of Scots pine (Pinus sylvestris) or Norway spruce (Picea Abies (Karst)) dominated stands in central Sweden.
Three years of accounting data for 11 small and medium sized (9-11 tonnes) forwarders owned by the Danish State Forest Agency were obtained and analysed. Fuel consumption levels, productivity rates and extracted volumes were examined for 246150 m3sub and 25480 E15 hours. Eighty-nine percent (89%) of the volume arose from thinnings (Table 8). The logs were mostly in 3 to 5 assortments with lengths in average from 2.2 to 2.7 m. The assortments had mostly lengths of 1.5 or 2.5 m with minor proportions of 3.2, 3.6 or 4.2 m. No tracks or wheel-chains were used on these machines. The data were not related to specific terrain conditions or to extraction distances. General terrain conditions were mostly class 1 regarding ground roughness and inclination [5] with even-aged spruce-monocultures and with average extraction distances of 100-200 m.
RESULTS
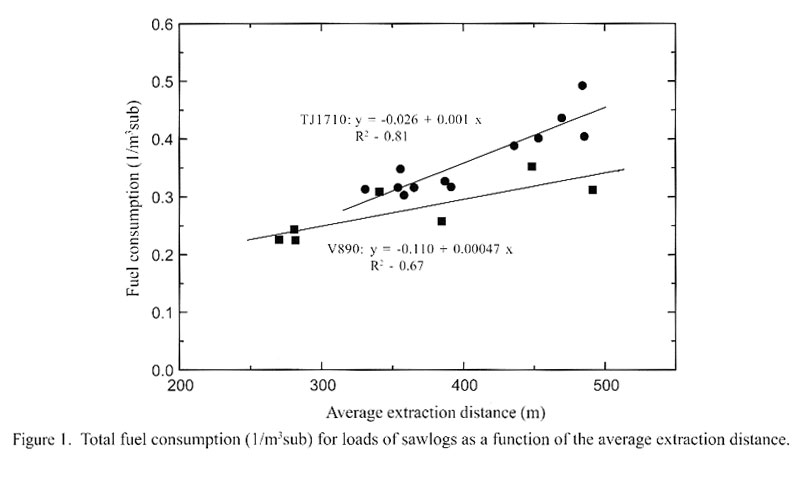
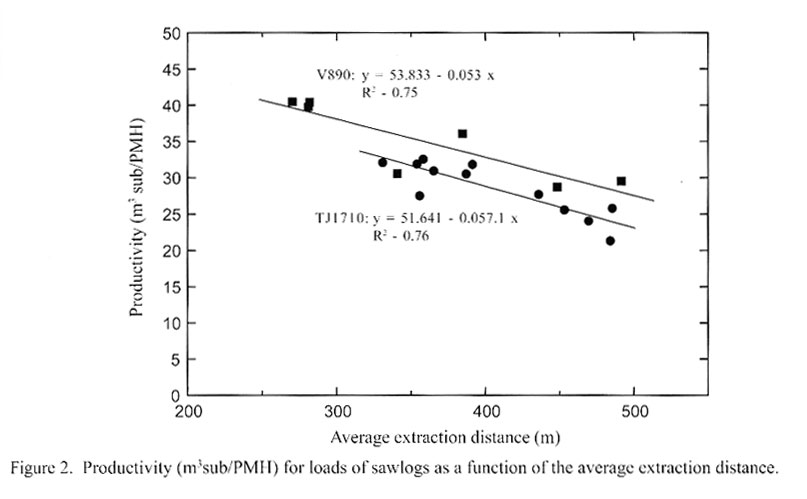
In the field study, both forwarders consumed on average almost the same amount of fuel on a PMH (Productive Machine Hour) basis whereas the V890 had significantly lower consumption on m3 basis (Table 4). The V890 also carried the biggest loads. For both forwarders, fuel consumption on an m3 basis was 53-83% higher for pulpwood than for sawlogs. The productivity was 37 and 50% lower when extracting pulpwood compared to sawlogs for the V890 and the TJ1710 respectively. The corresponding load sizes were also 11 and 33% lower with pulpwood. The average extraction distances for loads of sawlogs were 360 and 412 m for the V890 and the TJ1710 respectively. Corresponding values for pulpwood were higher, 514 and 458 m, and here the V890 had the longest extraction distance.
Table 4. Average values for the time study.
| V890 | TJ1710 | |||
| Sawlogs | Pulpwood | Sawlogs | Pulpwood | |
| Number of loads | 7 | 4 | 12 | 6 |
| Load size (tonnes) | 18.9a | 17.0b | 14.5c | 11.0d |
| Load (m3sub) | 19.0a | 17.1b | 14.6c | 11.0d |
| Productivity (m3sub/PMH) | 35.1a | 22.2b | 28.6c | 14.4d |
| Average extraction distance (m) | 360a | 514b | 412a | 458b |
| Fuel consumption(l/load) | 5.1a | 7.2b | 5.4a | 7.2b |
| Fuel consumption (l/m3sub) | 0.28a | 0.43b | 0.36b | 0.66c |
| Fuel consumption (l/PMH) | 9.4a | 9.4a | 10.2b | 9.5a |
| abcdValues within a row marked with the same letter show no significant difference (p<0.05) | ||||
For both forwarders, pulpwood loading accounted for the highest proportion of time consumption (60.4-64.4%) and of the fuel consumption (60.9-62.4%) (Table 5). Corresponding values for loading of sawlogs were (41.2-46.5%) regarding time consumption and (40.2-43.8%) regarding fuel consumption. Fuel consumption associated with different work elements was 8.4-9.8 and 6.8-15.7 l/PMH for the V890 and the TJ1710 respectively. The rather even fuel consumption of the V890 gave a good correlation between time- and fuel consumption. The biggest difference within a work element was 2% (60.4 and 62.4% in time- and fuel consumption respectively), corresponding figure for the TJ1710 being 10% (19.6 and 29.6% for the work element driving unloaded).
Fuel consumption on an m3 basis and productivity were strongly correlated to extraction distance. As extraction distance increased, productivity decreased and fuel consumption increased (Figures 1 and 2). Fuel consumption at idling was 1.75 and 2.25 l/PMH for the V890 and the TJ1710 respectively (data not shown).
For the V890, the driving distance during loading was 3.5 times as high for pulpwood as for sawlogs. The corresponding value for the TJ1710 was 1.9 times as high (Table. 6). This had a significant effect on fuel and time consumption for the loading work element. For both forwarders, loading of pulpwood took 2.4 - 2.5 times more fuel per unit volume then loading of sawlogs. Corresponding values for time consumption were 2.3 - 2.6 times higher time consumption for loading of pulpwood than loading of sawlogs. Time consumption per unit volume for both the loading and unloading work elements and for both pulpwood and sawlogs was significantly lower for the V890. Corresponding values for fuel consumption were also mostly significantly lower for theV890. The driving speed was 4-29% lower for the V890 than for the TJ1710. Fuel consumption during driving was between 0.23-0.38 l/100m.
Table 5. Distribution of time and fuel consumption.
| Time consumption (%) | Fuel consumption (l/PMH)abcd | Fuel consumption (%) | ||||||||||
| Work | Sawlogs | Pulpwood | Sawlogs | Pulpwood | Sawlogs | Pulpwood | ||||||
| element | V890 | TJ1710 | V890 | TJ1710 | V890 | TJ1710 | V890 | TJ1710 | V890 | TJ1710 | V890 | TJ1710 |
| Driving unloaded |
18.4 | 19.6 | 14.0 | 15.2 | 9.8a | 15.7b | 8.6a | 14.3b | 19.6 | 29.6 | 13.9 | 22.5 |
| Loading | 41.2 | 46.5 | 60.4 | 64.2 | 9.3a | 9.7a | 9.7a | 9.1a | 40.2 | 43.8 | 62.4 | 60.9 |
| Driving loaded |
20.9 | 16.5 | 12.2 | 8.8 | 9.1a | 7.8bc | 8.6ac | 6.8b | 21.5 | 12.6 | 11.5 | 6.3 |
| Unloading | 19.5 | 17.4 | 13.4 | 11.8 | 9.1a | 8.4b | 8.4ab | 8.3ab | 18.7 | 14.0 | 12.2 | 10.3 |
| abcdValues marked with the same letter within a row show no significant difference (p<0.05) | ||||||||||||
Display large image of Figure 1

Display large image of Figure 2
Table 6. Driving distances, speeds, fuel and time consumption for different work elements.
| Work element | ||||||||
| Driving unloaded | Loading | |||||||
| V890 | TJ1710 | V890 | TJ1710 | |||||
| S* | P** | S | P | S | P | S | P | |
| Driving distance (m) | 337 | 306 | 420 | 453 | 125 | 441 | 140 | 268 |
| Speed (m/s) | 0.83a | 0.94ab | 1.18b | 1.10b | - | - | - | - |
| Fuel consumption (l/100m driving) | 0.30a | 0.33a | 0.38b | 0.36b | - | - | - | - |
| Fuel consumption (l/m3sub) | - | - | - | - | 0.11a | 0.26c | 0.16b | 0.40d |
| Fuel consumption (l/load) | 1.01a | 1.00ab | 1.61b | 1.63b | 2.12a | 4.45b | 2.36a | 4.42b |
| Time consumption (seconds/m3sub) | - | - | - | - | 43a | 97b | 60c | 159d |
| Time consumption (seconds/load) | 361ab | 359ab | 357b | 416a | 819a | 1636b | 874a | 1763b |
| abcdValues marked with the same letter within a row and within the same working element show no significant difference (p<0.05). | ||||||||
| *Sawlogs ** Pulpwood |
||||||||
| Work element | ||||||||
| Driving loaded | Unloading | |||||||
| V890 | TJ1710 | V890 | TJ1710 | |||||
| S | P | S | P | S | P | S | P | |
| Driving distance (m) | 258 | 281 | 263 | 194 | - | - | - | - |
| Speed (m/s) | 0.68a | 0.80b | 0.86b | 0.83b | - | - | - | - |
| Fuel consumption (l/100m driving) | 0.38a | 0.31b | 0.26bc | 0.23c | - | - | - | - |
| Fuel consumption (l/m3sub) | 0.05a | 0.05a | 0.05a | 0.04a | 0.05a | 0.05a | 0.05a | 0.07b |
| Fuel consumption (l/load) | 0.97ab | 0.87a | 0.68b | 0.45c | 0.96a | 0.90ab | 0.76b | 0.75b |
| Time consumption (seconds/m3sub) | 20a | 20a | 21a | 22a | 20a | 23ab | 22b | 30c |
| Time consumption (seconds/load) | 369a | 357ac | 310ac | 241bc | 381a | 390ab | 237b | 325b |
Results from the questionnaire study showed that the productivity for 16-20 tonne forwarders in final felling varied from 21.2 to 25.5 m3sub/E15 and fuel consumption varied from 0.56 to 0.67 l/m3sub (Table 7). Corresponding values for 11-14 tonne forwarders in thinnings were 10.0-12.5 m3sub/E15 and 0.82 to 1.12 l/m3sub. On average, the extraction distance was twice as long for thinning as it was for final felling which partly explains the difference. For the 2.5 tonne forwarder, the productivity was low (3.8 and 5.5 m3sub/E15 for thinning and final felling respectively), but the fuel consumption was as low as 0.35-0.37 l/m3sub. This was partly explained by the shorter average extraction distances (120-180 m).
In the study of accounting data, the overall volume weighted average fuel consumption was 0.67 l/m3sub at a corresponding productivity level of 9.9 m3sub/E15 (Table 8).
DISCUSSION
In the field study, the 90 m downhill slope between the harvesting site and the landing for the TJ1710 made comparisons concerning fuel consumption with the V890 not valid for the work elements driving loaded and driving unloaded. The slope resulted in significantly lower fuel consumption, in l/100 m, driving downhill for the TJ1710 (driving loaded), and a higher consumption when driving uphill (driving unloaded) (Table 6). The incline, together with a high travel speed, resulted in the high fuel consumption in l/PMH for the TJ1710 when driving unloaded (cf. Tables 5 and 6).
Given almost similar conditions for loading of sawlogs (driving distances 125 and 140 m per load, volumes on 118 and 120 m3sub/ha) and for unloading of both sawlogs and pulpwood, it was expected to find similar time consumption per m3 for the V890 and the TJ1710 regarding those work elements. However, the analysis of the results showed significantly lower time consumption for the V890 for these two work elements. Also for pulpwood loading, the time consumption was lower for the V890 in spite of the fact that the TJ1710 should have had an advantage with more volume (55 compared with 33 m3sub/ha). The log lengths (on average 14% shorter for the TJ1710) resulted in the higher time consumption for the TJ1710.
Table 7. Findings from the questionnaire inquiry.
| Forwarder brand and model |
Number of machines |
Mass (tonnes) |
Number of follow-up hours (E15) |
Average extraction distance (m) |
Terrain conditions*** (classes 1 to 5) |
||
| Ground strength |
Ground roughness |
Slope | |||||
| Final felling | |||||||
| Timberjack 1840 | 1 | 18 | 208 | 330 | 3.5 | 3 | 2.5 |
| Timberjack 1710 | 2 | 20 | 224 | 340 | 3.5 | 3 | 2.5 |
| Ponsse Buffalo S16 | 1 | 16 | 184 | 270 | 2 | 2 | 1.5 |
| Volume weighted average for final felling: | 318 | 3.1 | 2.7 | 2.2 | |||
| Thinning | |||||||
| Timberjack 1210 | 3 | 14 | 296 | 620 | 2.5 | 2.5 | 2.5 |
| Timberjack 1110 | 2 | 11 | 192 | 720 | 2 | 2 | 3 |
| Ösa/Fmg 250 | 1 | 14 | 112 | 600 | 1.5 | 1.5 | 1.5 |
| Volume weighted average for thinning: | 644 | 2.2 | 2.2 | 2.4 | |||
| Vimek 606 in F* | 3 | 2.5 | 176 | 120 | 1.6 | 3 | 2.3 |
| Vimek 606 in T** | 1 | 2.5 | 24 | 180 | 2.8 | 2.8 | 2.3 |
| F* = Final felling, T** = Thinning, *** = according to the Swedish Terrain Classification System [5] . | |||||||
| Average productivity (m3sub/E15) |
Fuel consumption |
||
| (1/E15 hour) | (1/m3 sub) | ||
| Final felling | |||
| Timberjack 1840 | 25.5 | 12.7 | 0.56 |
| Timberjack 1710 | 23.5 | 14.2 | 0.64 |
| Ponsse Buffalo S16 | 21.2 | 12.9 | 0.67 |
| Volume weighted average for final felling: | 23.6 | 13.3 | 0.62 |
| Thinning | |||
| Timberjack 1210 | 12.5 | 10.3 | 0.82 |
| Timberjack 1110 | 10.0 | 9.6 | 0.96 |
| Ösa/Fmg 250 | 11.8 | 12.5 | 1.12 |
| Volume weighted average for thinning: | 11.6 | 10.5 | 0.92 |
| Vimek 606 in F* | 5.5 | 1.7 | 0.35 |
| Vimek 606 in T** | 3.8 | 1.3 | 0.37 |
| F* = Final felling, T** = Thinning, *** = according to the Swedish Terrain Classification System [5] . | |||
Raymond and Moore [18] reported a production rate dependence on log lengths similar to the one presented here. Nonetheless, this is not enough to explain the clear difference. It is probable that the two operators on the V890 were more skilled than the one on the TJ1710. The fact that the load capacity was better utilised on the V890 strengthen this assumption (cf. Table 4).
Table 8. Findings from the analysis of the accounting data.
| Forwarder brand and model |
Number of machines |
Forwarder mass (tonnes) |
Number of follow-up hours (E15) |
||
| Mini Brunett 678F | 1 | 9 ‡ | 90 | ||
| Valmet 828 | 4 | 9 ¨ | 8510 | ||
| Rottne F9 Solid | 1 | 10 ¨ | 985 | ||
| Valmet 820 | 3 | 10* | 9164 | ||
| Silvatec 854F | 2 | 11* | 6733 | ||
| ‡ [9] , * [8] , ¨ Manufacturer's specification | |||||
| Forwarder brand and model |
Number of assortments |
Average length on assortments (m) |
Productivity (m3sub/E15) |
Proportion of total volume extracted from thinnings (%) |
Fuel comsumption (1/m3sub) |
| Mini Brunett 678F | 2 | 2.3 | 8.7 | 100 | 0.68 |
| Valmet 828 | 5 | 2.7 | 7.7 | 95 | 0.84 |
| Rottne F9 Solid | 4 | 2.5 | 9.4 | 100 | 0.80 |
| Valmet 820 | 5 | 2.4 | 10.9 | 87 | 0.61 |
| Silvatec 854F | 3 | 2.2 | 10.5 | 86 | 0.57 |
| Volume weighted average: | 4.4 | 2.4 | 9.9 | 89.4 | 0.67 |
In accordance with the findings of Thompson [25] , loading was the most time and fuel consuming work element, while Kellogg and Bettinger [13] showed that sawlogs were loaded faster than pulpwood per unit volume in a final felling. This is mainly due to the higher proportion of sawlogs (69-78%) of the total volume was sawlogs in this study).
A comparison of the field study data for the V890 and the TJ1710 with the data from the questionnaire inquiry for the three 16-20 ton forwarders revealed that fuel consumption figures from the questionnaire were higher. Those three forwarders consumed on average 0.62 l/m3sub (sawlogs and pulpwood together) at an average extraction distance of 318 m. Corresponding values in the field study were 0.34 and 0.46 l/m3sub at an average extraction distance of approximately 420 m for the V890 and the TJ1710 respectively. This means that fuel consumption in the field study was only 55-74% of the consumption in the questionnaire, despite a 100 m longer average extraction distance. Other studies show higher fuel consumption figures from forest practice than from this field study. Athanassiadis et al. [4] , compiled fuel consumption figures for forwarders used in Sweden. They reported an average consumption on 0.88 l/m3sub for forwarders heavier than 12 tonnes operating in final fellings for about 70% of the time. These figures are in line with those reported in the questionnaire inquiry but much higher than those from the field study. The following reasons have been found to explain the low fuel consumption at the field study compared to fuel consumption from forest practice:
Together, these factors explain the notable difference in fuel consumption.
Fuel consumption was generally lower in the accounting data than in the questionnaire data, even though on average at least 1.5 m longer assortments were harvested in the questionnaire data. The longer extraction distances (at least 3 times as long) and more difficult terrain associated with the data in the questionnaire study, can explain this.
The difference in fuel consumption when driving unloaded and driving loaded is very small. For the V890 it was on average 0.315 and 0.345 l/100m respectively (proportion 1:1.1). From a theoretical point of view, the difference should be larger. The proportion of total mass for those work elements was on average 1:1.9. The difference in total resistance when driving on an uneven surface should give lower fuel consumption for driving unloaded. Vehicles with pure mechanical transmissions have proven to have a fuel consumption that in a high degree corresponds to the total mass of the vehicle when driving in terrain [cf.14, 16 ]. A probable explanation of this difference is the possibility to choose a higher mechanical gear when driving unloaded on the machines with a pure mechanical transmission. The speed is naturally higher when driving unloaded (cf. table 6) and a solution to solve a part of the problem would be to design the transmission to allow relatively high driving speeds at the lowest possible engine speed, when driving unloaded. The lower the engine speed, the lower the fuel consumption at a constant output [11] .
The following equation regarding fuel consumption was done, based on average values in the field study (cf. Table 6):
Y = 0.288 + (0.00638 / L) × Z
Where:
Y = The total fuel consumption (l/m3sub)
L = The load size (m3sub)
Z = The average extraction distance (m)
The equation is valid for final fellings (150 - 175 m3sub/ha), sawlogs and pulpwood together, 20 - 21 tonne forwarders and under easy terrain conditions. The equation gives 0.43 l/m3sub as result, if the load is 18 m3sub and the average extraction distance is 400 m. The same distance, but only half that load gives 33% higher fuel consumption as result. It is therefore important to utilize the maximum load capacity to obtain low fuel consumption on m3 basis.
The small 2.5 tonne forwarder presented low fuel consumption figures, in line with the field study. It operated on comparatively short extraction distances but no shorter than those in the accounting data. The productivity figures indicate that the maximum load capacity was well utilized on this machine.
ACKNOWLEDGEMENTS
The authors would like to thank Holmen Skog for hosting the field study, the operators and contractors that replied to the questionnaire as well as the Danish Forest & Nature Agency for making fuel accounting data available. The funding was provided by The Danish Product Development Fund for Forestry and the Timber Industries, the Danish Research Agency and the Swedish University of Agricultural Sciences.
AUTHOR CONTACT
Dr. Nordfjell can be reached by e-mail at -- Tomas.Nordfjell@ssko.slu.se
REFERENCES
[1] Arvidsson, P.A., P. Eriksson, I. Eriksson, S.M. Rönnqvist, A. Westerlund, and P. Igeklint. 1999. Smarter route planning for forwarders benefits both profitability and the environment. Forestry Research Institute of Sweden, Results nr. 22, Uppsala, Sweden.
[2] Athanassiadis. D. 2000a. Energy consumption and exhaust emissions in mechanised timber harvesting operations in Sweden. Sci. Total Environ. 255(1-3): 137-145.
[3] Athanassiadis. D. 2000b. Resource consumption and emissions induced by logging machinery in a life cycle perspective. Doctoral Thesis. Swedish University of Agricultural Sciences. Acta Universitatis Agriculturae Sueciae. Silvestria 143.
[4] Athanassiadis, D., G. Lidestav, and I. Wästerlund. 1999. Fuel, hydraulic oil and lubricant consumption in Swedish mechanised harvesting operations, 1996. Int. J. For. Eng. 10(1): 56-66.
[5] Berg, S. 1992. Terrain Classification System for forestry work. Forestry Research Institute of Sweden, Uppsala, Sweden. ISBN 91-7614-078-4.
[6] Berg, S. 1997. Some aspects of LCA in the analysis of forestry operations. J. Cleaner Prod. 5(3): 211-217.
[7] Bøllehuus, E. 1992. Skovmaskiners transmissions-systemer [Transmission systems for forest machinery]. Forskningscentret for Skov og Landskab. Skogbrugsserien nr. 6. Hørsholm, Denmark. ISBN: 87-89822-11-0.
[8] Bøllehuus, E. 1997. Udkørselstratorer; Test af Silvatec 856F, Timberjack 810B, Valmet 820 og Valmet 840 [Forwarders; Tests of Silvatec 856F, Timberjack 810B, Valmet 820 and Valmet 840]. Forskningscentret for Skov og Landskab. Skogbrugsserien nr. 21. Hørsholm. ISBN: 87-89822-80-3.
[9] Bøllehuus, E., and C. Kortegaard. 1989. Udkør-selstraktorer; Test af Silvatec F80, Bruunett Mini 678F og Gremo 704 [Forwarders; Tests of Silvatec F80, Bruunett Mini 678F and Gremo 704]. The Danish Institute of Forest Technology, Lyngby, Denmark. ISBN 87798-565. (In Danish).
[10] Favreau, J. and J.F. Gingras. 1998. An analysis of harvesting costs in eastern Canada. Forest Engineering Research Institute of Canada. Special Report SR-129.
[11] Björheden, R. and Dahlin, B. 1999. The complete logging machine - the feasibility of the harvester-forwarder in Swedish forestry. In Kellog, L. and Licht, P. (eds.) Timber harvesting and transportation technologies for forestry in the new millenium. Conference proceedings. Pietermaritzburg, South Afica June 10-11, 1999. Published by Oregon State University, Department of forest engineering, Corvallis, Oregon, U.S.A. p 15-23.
[12] Johansson, A. 2001. Forestry Costs and Revenues 2000, A year of storms and floods. Forestry Research Institute of Sweden. Results nr. 4, Uppsala, Sweden.
[13] Kellogg, D.L. and P. Bettinger. 1994. Thinning productivity and cost for a mechanised cut-to-length system in the Northwest Pacific coast region of the USA: J. For. Eng. 5(2):43-54.
[14] Loftäng, L. 1991. Vimek Minimaster and the ATV´s Suzuki and Honda. Comparative studies of basic technical properties. Swedish University of Agricultural Sciences. Department of Operational Efficiency, Research Notes no 209. Garpenberg. Sweden. ISSN 0282-2377
[15] Löfgren, B., T. Brunberg, G. Erikson, U. Hallonborg, P. Granlund, C. Löfroth and D. Myhrman. 1999. Forwarder trials 98. Forestry Research Institute of Sweden, Resultat nr. 2. Uppsala, Sweden.
[16] Nordfjell, T. 1989. Small terrain machines for forestry. Performance and requirements. Swedish University of Agricultural Sciences. Department of Operational Efficiency, Research notes no 163. Garpenberg. Sweden. ISBN 91-576-4000-9.
[17] Norusis, I.M. 1996. SPSS for Windows Base System User's Guide Release 6.0. ISBN 0-13-178-856-6.
[18] Raymond, K. and T. Moore. 1989. Mechanised processing and extraction of shortwood thinning. New Zealand Logging Industry Research Association, Report 14.
[19] Rolev, A.M. 1988. SIWORK3 version 1.1. Work study and field data collection system based on Husky Hunter handheld computer -user guide. Danish Forest and Landscape Research Institute, Lyngby, Denmark.
[20] Sambo, S.M. 1997. Wood harvesting, fuel consumption estimates for typical coastal British Columbia forest operations. Forest Engineering Research Institute of Canada. Technical Note TN-259.
[21] Sondell, J. 1979. Forwarder trials -78'; the speed and fuel consumption of forwarders operating on- and off-road. Forestry Research Institute of Sweden, Redogörelse 8.
[22] Sundberg, U. and N. Svanqvist. 1987. Fuel consumption as an indicator of the economics in mechanisation. Scand. J. For. Res. 1: 389-398.
[23] The Danish Forest & Nature Agency. 2000. Annual Machine Report 1999.
[24] The Swedish Forestry Association. 1999. Praktisk skogshandbok [Practical Forestry Handbook]. Djurholm. Sweden.
[25] Thompson, M.A. 1991. Thinning northern hardwoods with chain saws and forwarders. Northern J. Appl. For. 8(4): 149-153.