July, 1998, vol.9 no.2
Arif Oguz Altunel
Cornelis F. de Hoop
Louisiana State University Agric. Center
Baton Rouge, USA
The authors are, respectively, Graduate Student and Assistant Professor at the School of Forestry, Wildlife and Fisheries, Louisiana Agricultural Experiment Station.
ABSTRACT
Adjusting truck tire inflation to changing road and load conditions has been demonstrated to improve road conditions and is thought to decrease truck maintenance costs. Good roads will minimize the future cost of utilizing forest resources.
In this study, the various effects of both low-pressure and high-pressure truck tires on the transportation vehicle were examined in terms of seat vibration. The data collected by the US Army Corps of Engineers, Waterways Experiment Station (WES), for the USDA Forest Service in 1989, were used to perform the analyses. Analysis of the data pertaining to road failure is fairly complete. However, a significant portion of the truck data still needs to be analyzed.
Vibration levels were higher in the truck with high tire-inflation pressure, but the differences in vibration levels between low- and high-pressure trucks were not as high as expected. Although vibration levels were higher in 10 out of 15 road sections in the high-pressure truck, two sections had significantly reversed results.
Keywords:Variable tire inflation, central tire inflation, log truck, vibration.
INTRODUCTION
Since 1983, the USDA Forest Service has been testing the feasibility of Central Tire Inflation (CTI) technology. A modern CTI system allows a driver to adjust individual tire pressures to obtain an appropriate tire contact length while the vehicle is in motion. The resulting optimal tire "footprint" reduces stresses applied to both the road surface and the vehicle, improves traction, decreases tire bounce on hard surfaces and reduces washboarding on soft surfaces. With CTI, tire pressures can be varied to realize the maximum benefit for any given load, speed, or road condition. Benefits derived from an optimum tire footprint include potential cost savings in road construction and maintenance, lower vehicle maintenance costs, increased vehicle mobility and traction, extended hauling seasons, and improved health and safety for drivers [6].
The vast majority of the forest roads in the National and private forests consist of single-lane gravel and native surfaced roads. This road system generally lends itself to low-speed and reduced-tire- pressure operations. The primary reasons for utilizing CTI are to reduce applied aggravating stresses, thus allowing for reduction in sub-base thickness needed to support traffic loads, reducing road maintenance costs. Because tire contact area is longer, the thickness of aggregate needed to spread the load to a pressure appropriate for subgrade material is reduced [9].
The use of CTI-equipped trucks can increase the number of vehicle operating days due to enhanced vehicle traction and flotation. The USDA Forest Service in Idaho, Alabama, and Alaska showed that hauling could be done under wet road conditions that would normally have been prohibitive [1, 3, 14]. The Forest Engineering Research Institute of Canada (FERIC) measured an average reduction of 67% in rut depth resulting from the use of low tire pressures on a thawing, native soil track in the northern Alberta [5].
In addition to direct benefits, environmental benefits can be realized by lowering the tire pressures. Research studies conducted over five years indicate that dramatic reductions in sediments from road surfaces can be expected by using lower tire pressures on heavy-haul vehicles. The roads with the most dramatic reductions in road surface sediment are those with no surfacing material or surfaced with aggregates that produce a high degree of fine material during hauling operations. Research conducted in Lowell, Oregon, concluded that lowering tire pressures on heavy-haul vehicles reduced road surface sediment an average of 80% over a three-year test period on a forest road [7, 12]. Tire pressures were lowered from highway pressures, 90 pounds per square inch (psi), to 30 psi in the drive tires while empty and to 50 psi in the drive and trailer tires when fully loaded while cruising up to 35 miles per hour.
Almost all drivers involved in the CTI tests have commented on the improvement in vehicle ride and reduced fatigue after a day of driving. Driver safety can also be improved with CTI because tire pressures can be adjusted to provide optimum tire performance on any given road condition. Optimal pressures improve driver safety by allowing better vehicle control and better braking capabilities. Stopping distances for loaded logging trucks improve on both dry pavement and gravel surfaces as tire pressure is lowered. There are fewer failed climb-related breakdowns, fewer tire failures, and better monitoring of tire pressures [6].
The Nevada Automotive Test Center (NATC) study found that low tire pressures transmitted 85% less shock and vibration to the suspension of the truck, damage to truck components was reduced by as much as 87%, and repair costs were reduced by 83% [13]. FERIC's year-long operational study indicated that a truck using CTI required 30% fewer repairs than the standard fleet average and that 91% less time was spent repairing cracks in frames and other components [4]. Both Weyerhaeuser and FERIC detected fewer vibration-related repairs, ranging from 20 to 75% [4, 10].
OBJECTIVE AND SCOPE
Empirical evidence and truck driver testimonies leave little doubt that lowered tire pressures improve the ride for the driver. The purpose of this study is to quantify the effect of lowered tire pressure on driver seat vibration levels in comparison to driver seat vibrations in a log truck with high tire pressures. The implications are reduced maintenance cost, less fatigue, and reduced medical problems with truck drivers. In a related study, the authors attempted to quantify the most significant truck-related factors that transmit or cause vibrations in the driver's seat [2].
METHODS
In 1988 through 1993, the US Army Corps of Engineers conducted a study for the USDA Forest Service to evaluate the effect of lowered tire pressures on road longevity. They built a test track at the Waterways Experiment Station (WES) facility in Vicksburg, Mississippi. The track consisted of a two-lane continuous loop of 0.7 mile in circumference divided into fifteen sections. Sections 1, 2, 13, 14, and 15 were surfaced with aggregate, and sections 4 to 12 were surfaced with asphalt. Each section was covered with different thickness of surfacing material. Section 3 consisted of native soil (no surface layer added). Two identical log trucks (White Western Star trucks with pole semi-trailers loaded with utility poles) were run on the track, one with "high" tire pressures (i.e., the normal tire pressures recommended by the tire manufacturers), and one with lowered tire pressures. The trucks were fitted with accelerometers on each axle and on the drivers' seats. Each test section was monitored until failed. While the road effects were analyzed by the researchers at WES [8, 15], no attempt was made to analyze the data from the trucks.
This paper utilizes the truck data from the accelerometers on the drivers' seats. The unit given by the WES researchers is absolute power in watts and is described as a filtered average of the accelerations on the drivers' seats, indicating the ride of the vehicle. The amplitudes of these vibrations were compared statistically using an incomplete block design. Only the first fifty laps of each test section were used in this study to minimize the vibrations due to lane effect. Each lap was considered an independent replication because the conditions were not the same from lap to lap.
The investigators were advised that if an accelerometer recorded "0" readings, it can be suspected that it was not operating properly. Suspect data was removed, resulting in the deletion of 1564 observations out of 19,344.
Hypothesis Testing
Two hypotheses were tested:
a) The average amplitude of the vibration on the driver's seat on the truck with high-pressure tires is equal to that on the
truck with the low- pressure tires.
b) The above hypothesis holds true for all of the test track sections.
Stated more briefly:
a) H01: High pressure = Low pressure.
HA1: High pressure Low pressure.
b) H02: All sections are the same.
HA2: Some or all of the sections are different from one another.
Analysis of covariance tests were performed at the a = 0.05 level. Because of the incomplete nature of the data set, Type III Sum of Squares (Type III SS) were used in evaluations [4]. This analysis was performed on all of the sections (as 15 different treatments), repeated on the aggregate-surface sections, and repeated again on the asphalt sections. The native soil section was included in the all-sections and asphalt-sections models because the vibration levels of the native section were very similar to that of the asphalt sections (the soil is a loessial silty loam with very little stoniness).
RESULTS
Findings on All-Sections Model
Tire pressure, section number, pressure by section number interaction, and pressure by section number interaction nestled in lap number were used as independent variables and interaction terms in the model. Speed, torque, vertical acceleration in axles 1, 2, and 3, and their two-way interactions (either among themselves or with independent variables) were used as covariate terms in the model. Axle 1 is the front axle. Vertical acceleration in axles 4 and 5 on the semi-trailer were excluded because they did not have any significant effect on the vibration levels in the driver seat.
The model was run two times because of the possibility that some of the terms in the model were insignificant. In the first attempt, the covariates torque, vertical acceleration in axle 1 and axle 3, and speed by torque two-way-interaction terms produced relatively insignificant results with the probabilities of rejection of 0.6047, 0.4825, 0.1085, and a = 0.05 level.
The Effect of Tire Pressure on Ride Quality
The first two null hypotheses, H01 and H02, were rejected with the results of the second test, leading to the conclusions that when all sections were considered, the response of high-pressure tires on absolute power was entirely different from that of low- pressure tires, with the probability of rejection of 0.0001, a= 0.05. The responses of some of the road sections on the vibration of the driver seats were also highly different from the others with the probability of rejection of 0.0001. As covariates, speed, torque, and vertical acceleration axles 1, 2, and 3 had considerable effects on ride measurements.
Section by Section Comparisons
The average vibration in the driver seat was significantly higher in the high-pressure truck in two aggregate sections, the natural section and seven asphalt sections. There was no significant difference in sections 2, 5, and 9. In sections 14 and 15 (aggregate), the situation was reversed. In section 15, vibration in the driver seat was five times higher in the low-pressure truck. Except in sections 2, 5, 6, and 9, section number by pressure interaction was extremely significant.
Findings on Aggregate Sections
The same technique was used in testing the five aggregate sections (sections 1, 2, 13, 14, 15). The covariates torque, speed by vertical acceleration in the axle 3, torque by vertical acceleration in axle 1 and speed by torque two-way-interaction terms were relatively insignificant, with the probabilities of rejection of 0.0506, 0.5879, 0.2481, and 0.8205, respectively. Among the interaction terms in which torque contributed, only torque by section number and torque by pressure two-way-interaction terms were significant. The rejection of torque may be arguable, but it was rejected since there were other terms with much greater significance.
The Effect of Tire Pressure on Ride Quality
In the second run, with the exclusion of the non-significant terms from the model, every term came out highly significant, and the two null hypotheses were rejected again. We conclude that when only the aggregate sections were considered, the absolute power on the driver seat from the high pressure tires was different from that of the low-pressure tires with a probability of rejection of 0.0001; and that some of the sections were also different from the others, with a probability of 0.0001. Speed and vertical accelerations in axles 1, 2, and 3 were also significant, with the probabilities of rejection of 0.0001, confirming the results held in the hypothesis testing of all sections.
Section by Section Comparisons
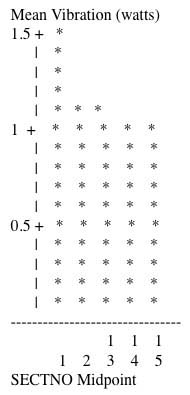
The findings in the sections 1, 13, 14, and 15 confirmed the results held in the all-sections testing. However, while in all-sections testing the vibration levels in section 2 were not significantly different in the two trucks, the situation changed in the aggregate-sections model . The truck with lower pressure tires experienced higher vibration (Figures 1 and 2).
Figure 1. Plot of vibration in the driver seat by section number in aggregate sections of high-pressure truck.
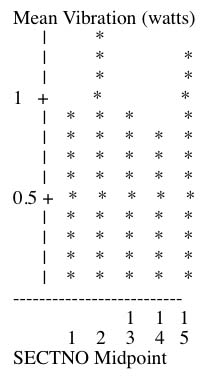
Figure 2. Plot of vibration in the driver seat by section number in aggregate sections of low-pressure truck.
Findings on Asphalt Sections
No changes were made to the model used in testing the first four hypotheses. The data set was run two times to eliminate
any non- significant term
from the model. In the first trial, covariate torque came out relatively non-significant, with the probability of rejection of
0.0969, as in two previous test results. Vertical accelerations were also non-significant in axle 3, torque by vertical
acceleration in axle 2, speed by vertical acceleration in axle 1, and axle 2 two-way-interaction terms with the probabilities
of rejection of 0.3933, 0.2326, 0.1042, and 0.1570, respectively.
The Effect of Tire Pressure on Ride Quality
With the exclusions of these insignificant terms, the model was run again, producing highly significant results for all of the terms left in the model. Therefore, the null hypotheses were rejected again, leading to the conclusion that the results obtained from the high-pressure tire use were significantly different from those of the low-pressure tire use with the probability of rejection of 0.0015, and that some of the sections were different from the others, with the probability of rejection of 0.0001. All covariate terms were also highly significant at the a= 0.05 level. In sections 5 and 9, the vibration levels were not significantly different in the two trucks, confirming the results of the first test.
Section by Section Comparisons
Section number by pressure interaction effect were not significant in sections 4, 5, 6, and 9, confirming the results in the all-sections model in the sections 5, 6, and 9. The vibration levels are shown in Figures 3 and 4.
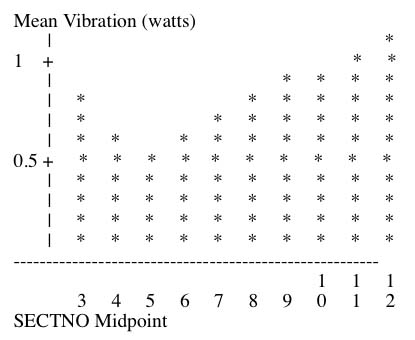
Figure 3. Plot of vibration in the driver seat by section number in asphalt sections of high pressure truck.
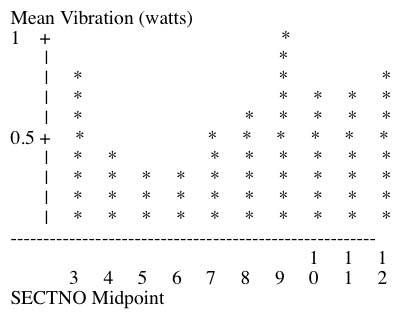
Figure 4. Plot of vibration in the driver seat by section number in asphalt sections of low- pressure truck.
Duncan's Multiple Range Test showed that the native section (3) had similarities with sections 7, 8, and 12.
DISCUSSION
How accurate were the data? This question will remain unanswered until some other parts of the entire WES truck data are analyzed. Because of the comments by the truck drivers that vibration levels were noticeably less in the low-tire-pressure truck, logic would tell us that absorbed power measured in the driver seat should have been consistently lower in the low-pressure truck.
As expected, vibration levels changed noticeably between high and low-pressure s, indicating that tire pressure is an important consideration in controlling the vibration levels. It had been expected that in all of the sections the driver seat vibration levels would have been higher in the sections of the lane run by the high-pressure truck, and the majority of the results showed that the vibration levels were indeed higher in the high-pressure truck. When all of the sections were tested together without separating aggregate sections from asphalt ones, it was found that in 10 of the 15 sections, the vibration levels were higher in the high-pressure truck. In section 2 (aggregate), 5 and 9 (asphalt), there was not a big difference in the vibration between the high- and low-pressure trucks; the similarity of vibration levels in sections 5 and 9 may be explained by the fact that both sections contain curves. When both trucks were about to enter the curves, the drivers were slowing the trucks down to safely turn through the curve. Section 2 had a built-in 12% slope. However, in sections 14 and 15 the vibration levels were higher in the low-pressure truck, which was unexpected. These two sections had the thickest overall aggregate surfacing material, with 6" and 9", respectively. Since 2 of the 15 road sections produced results that are different from what had been expected, it became necessary to separate the aggregate sections from the asphalt ones and then to test them independently.
The sections were then separated as five aggregate and ten asphalt sections (section 3, a native soil section, was included in the asphalt category). In the aggregate-sections test, the results confirmed the conclusion reached in the all-sections test except in section 2, in which no significant difference in vibration levels between the two trucks had been noticed. In the all-sections test, the situation changed. The vibration levels were higher in the low-pressure truck. In the asphalt-sections test, the results confirmed the results of the all-sections test.
Although section 2 had a 12% built-in slope, slope did not have any effect on vibration. On the other hand, sections 14 and 15 had the thickest overall aggregate material surfacing on them, which were double and triple the thicknesses of sections 1 and 13, respectively. In the low-pressure truck, section 13 was fairly different from the others. Only two sections, 1 and 14, produced similar vibration levels in the driver seat. The 12% grade and thick aggregate surfacing may have made a difference in the low-pressure truck because the tire footprint was larger than that of a high-pressure tire, so it grabbed the pavement in the slope and positioned itself in the thickest pavement material much better than a high-pressure tire could. In section 14, a sudden thickness change in the surfacing probably made the truck lose speed, producing the same level of vibration as section 1.
In the high-pressure track of the asphalt sections, an interesting one was section 3, native soil. While it was expected to be different from all the asphalt sections, it gave the same vibration level as asphalt sections 7 and 8. Although the thickness of the asphalt made a difference in the driver seat vibration levels, the base course did not contribute to this difference.
In the low-pressure truck of the asphalt sections, the base course did not make a difference, either. Similar vibration levels were obtained in the sections having the same thicknesses of asphalt surfacing. The vibration in section 3 (natural) matched the vibration in section 12, which had 5" of asphalt (no base).
When both high- and low-pressure trucks on the aggregate sections were considered, usually vertical accelerations in axles 1 and 2, and sometimes axle 3, were the factors affecting driver seat vibration levels. Since those were the three axles in close proximity to the vehicle's cabin, the axle vibration effect on driver seat vibration made relatively good sense. However, vibration in the trailer axles had almost no effect.
The situation was almost the same in both tracks of the asphalt sections. Vertical acceleration in axles 1, 2 and 3 had the greatest effect on vibration levels in the driver seat. However, torque had greatest effect in the high pressure truck in sections 6, 7, 8, 9, and 12. In sections 12 and 6, torque might be the main reason for driver seat vibration because those were the two sections where the trucks were driven through a 12% grade.
CONCLUSIONS
The data obtained from the US Army Corps of Engineers, WES, and partially analyzed in this study support the following conclusions:
1. Tire pressure, in the forms of high and low, affected the driver seat vibration in different ways.
2. Low tire pressure use appears to decrease vibration levels in driver seats from 10 to 25%.
3. The varying pavement thickness and surface types had different effects in driver seat vibration levels.
4. Vertical accelerations in axles 1, 2, and 3 were the main reasons for the driver seat vibration levels in both high- and low-pressure tire trucks. The trailer axles had no significant effects.
5. The variable nature of the data led to conclusions that are unreliable to generalize. The results presented in this study are valid only for the portion of the data analyzed here.
These data failed to produce an exclusive conclusion. The experiment was designed to test the effects of tire pressure on road surfaces. While the effects on the truck were being measured, they were not the primary concern. Since the two trucks ran in different lanes, the effect of the variability between those lanes may have been much greater than anticipated. Measurements at the bumps in each lane were taken at infrequent intervals and in such a manner that it would be difficult (if even possible) to relate them to truck vibrations. Integrating data on road surface bumps, washboards, pot holes, etc., is far beyond the scope of this investigation.
If more reliable correlation between road conditions and axle (seat) vibration levels can be established, it would be possible to develop a simulation model that can estimate the optimum tire pressures at various speeds and road conditions at the real time. Such a model could be used to automate a CTI system, allowing for optimum tire pressures under most conditions without necessitating manual control by the driver. This would help optimize tire, truck, and road longevity, and driver ergonomics.
If a similar study is performed again, there are some changes than can be made in the experimental design that would make the truck data more credible while maintaining a sound road effects design. Following are some recommendations:
1. Design the road in an "8" shape, making both lanes and the sections in equal length (Figure 5).
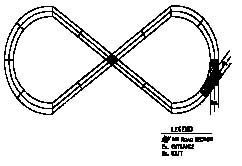
Figure 5. Recommended road.
2. Continue recording the data until each truck reaches the end of the test road. If it is absolutely necessary to interrupt data recording before trucks reach the end of the road, interrupt the recording in the same section in every lap, then collect the data for the remaining sections.
3. Swap the trucks at the end of each day. Changing the trucks will help reduce the truck-to-truck variation.
4. Swap the drivers on the second day after the trucks change lanes. This will help eliminate or reduce the driver-to-driver variation.
5. Have the number of each surfacing category (native soil, crushed aggregate, and asphalt bituminous, etc.) be equal, if possible, in order to make the comparisons more efficient.
LITERATURE CITED
[1] Ad Hoc Central Tire Inflation Applications Team. 1988. "Operation Bigfoot" technology application plan: a plan for applying Central Tire Inflation/Variable Tire Pressure (CTI/VTI) technology. Sand Dimas, CA: USDA Forest Service, Technology and Development Center (SDTSC). 54 p.
[2] Altunel, A.O. 1996. The effect of low-tire pressure on the performance of forest products transportation vehicles [Master's thesis]. LSU, School of Forestry, Wildlife and Fisheries. 109 p.
[3] Ashmore, C. and D.L. Sirois. 1987. Influence of the central tire inflation system on log truck performance and road surfaces. Michigan: Society of Automotive Engineers. Paper No. 87-1057. 27 p.
[4] Bradley, A.H. 1993. Testing a central tire inflation system in western Canadian log-hauling conditions. Vancouver: Forest Engineering Research Institute of Canada, Western Division. Technical Note: TN-197. 11 p.
[5] Bradley, A.H. 1993. Using variable tire pressure technology to reduce forest road costs. Vancouver: Forest Engineering Research Institute of Canada, Western Division. Annual meeting, WSI 3305 (bi) FDC 375.5. 5 p.
[6] Brown, C. and J. Sessions. 1995. Variable tire pressures for tropical forests? A synthesis of concept and applications. [Unpublished]. 28 p.
[7] Folz, R.B. 1994. Sediment reduction from the use of lowered tire pressures. SAE Technical Paper Series, 942244. 5 p.
[8] Grau, R.W. 1993. Effects of variable tire pressure on road surfacings. Volume 1:Design, construction, behavior under traffic, and test results. Vicksburg, MS: US Army Corps of Engineers, Waterways Experiment Station, . Technical Report GL-93-20. 30 p.
[9] Greenfield, P.H. 1993. Central tire inflation: USDA Forest Service Program. Washington, DC: USDA Forest Service, Engineering Staff. Engineering Field Notes. Volume 24. 15 p.
[10] Keller, R.R. 1993. Operational testing of central tire inflation systems proves the benefits of low tire pressure in logging operations. SAE Technical Paper Series, 933056. 6 p.
[11] Kuehl, R.O. 1994. Statistical principles of research design and analysis. Belmont, CA: Duxbury Press. Wadsworth Publishing Company, 94002. 686 p.
[12] Moore, T., R.B. Foltz and L. Cronenwet. 1995. Central Tire Inflation (CTI) reduces sediment up to 84%. San Dimas, CA: USDA Forest Service, Technology and Development Center. Watershed / Fisheries Engineering. Technical Tips. 2500/2600/7700. 9535 1303-SDTDC. 1 p.
[13] Nevada Automotive Test Center, A Division of Hodges Transportation, Inc. 1987. Final report: central tire inflation. Prepared for the USDA Forest Service, San Dimas Technology and Development Center. 82 p.
[14] Powell, B. and B. Brunette. 1991. Reduced tire inflation pressure - a solution for marginal-quality road construction rock in southern Alaska. Washington, DC: Transportation Research Board, National Research Council. Transportation Research Record 1291. 5 p.
[15] Smith, D.M. 1993. Effects of variable tire pressure on road surfacings. Volume 2: Analysis of Test Results. Vicksburg, MS: US Army Corps of Engineers, Waterways Experiment Station, Technical Report GL-93- 20. 66 p.