July, 1998, vol.9 no.2
D. Fjeld
Norwegian Forest Research Institute
Bergen, Norway
A. Granhus
Agricultural University of Norway
Ås, Norway
The authors are, respectively, Senior Scientist and Research Fellow.
ABSTRACT
Mechanical injuries were examined after single-tree selection harvesting in multi-storied stands of Norway spruce. Randomised block studies were used to compare the effect of two operating systems and three harvest intensities upon the injury rate to the residual stand. The average injury rate for mechanised shortwood harvesting was higher than for motor-manual cutting and cable skidding. The largest differences between these two systems were found at high harvest intensities in densely stocked stands. A number of variables were used to quantify this interaction. The variable which best explained the risk for injury in the individual stand was the ratio between removed vertical crown projection and horizontal crown-free projection before harvest. The higher injury rate for mechanised harvesting is attributed to the greater proportion of the stand which is impacted by the handling of trees.
Keywords:selection harvesting, Norway spruce, mechanical injuries, operating system, harvest intensity.
INTRODUCTION
The landscape is a mediator of our societies' goals and values. The forest landscape must, therefore, also be managed to produce a variety of non-timber goods such as flora, fauna, water, and aesthetic experience. In some areas, this requires that even-aged production forestry be supplemented with management practices aimed at a lower production intensity and disturbance frequency. Uneven-aged management of existing multi-storied stands may be one such supplement. However, the use of this silvicultural system also requires suitable operating systems if its biological principles are to be successfully applied.
Norway spruce [Picea abies] is a climax species which often dominates moister sites in the Nordic countries. It is moderately shade tolerant and occasionally forms multi-storied stands. Uneven-aged management of these stands requires an active maintenance of the stand structure through repeated selective harvesting. Because Norway spruce is readily infected by fungi such as Stereum sanguinolentum and Heterobasidion annosum [5], it is important that stand entries have a low injury rate. Studies in the Nordic countries conclude that the amount of advance regeneration in these stands is often low and may therefore be a limiting factor of their future production [6]. Because of these considerations selection harvesting must be done with operating systems which minimise the risk of injury to both the main stems and the advance regeneration of the residual stand.
Clearcutting with the shortwood system is the dominant logging practice in the Nordic countries. The development of harvesting technology in the Nordic countries has been aimed at these practices. Harvesting in industrial forestry is now dominated by one-grip harvesters and forwarding, while farm forestry has maintained a large component of motor-manual cutting and cable skidding with agricultural tractors. The same systems are used for the small amounts of selection harvesting which is done. Previous studies of harvesting in two-storied shelterwood stands have shown that injury rates may vary between machine types [7], however the variation between whole operating systems may be more difficult to show [11]. Studies of damage after selection harvesting [4] have shown that injury rates may also vary with harvest intensity.
The goal of this study is to compare the risk of injury to the residual stand during single-tree selection in multi-storied Norway spruce, with two operating systems under varying harvest intensities.
METHODS
The goal of this study is fulfilled through two separate experiments. The first experiment is designed to quantify the influence of harvest intensity upon the risk for injury. The second experiment is designed to isolate the effect of different operating systems, under otherwise identical conditions.
The injury rates are estimated by the percent of trees damaged in the residual stand. The percent of trees injured is calculated upon the basis of a post-harvest sample. Each tree in the post-harvest sample was examined for mechanical damages of three types: bole damages, crown damages, and lean. The damages were recorded if they were over a minimum level. For bole damages the minimum level was set at 15 cm2 of bark or fibre puncture. For crown damage, the minimum level was set at 15% of green crown removal. Trees with damages exceeding either of these levels, or having a lean in excess of 15 degrees from vertical, were defined as injured.
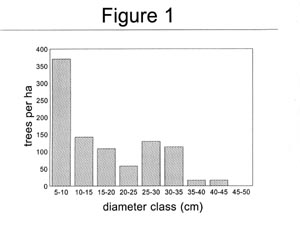
All replications were placed in multi-storied spruce stands. An example of the diameter distribution for one of these is shown in Figure 1. The stands were situated on Eu-Piceetum myrtilletosum (bilberry) and Eu-Piceetum dryopteridetosum (small fern) sites at altitudes between 400 and 600 m. The stands were distributed throughout Hedmark, Oppland, Trondelag, and Buskerud counties in mid and southeastern Norway. The standing volume and basal area in these stands varied from 131 to 396 m3 per ha and 22 to 45 m2 per ha, respectively.
In order for stands to be used in this study they had to have terrain conditions which were judged as suitable for ground-based harvesting systems. Terrain conditions were defined according to the classification system of the Forest Operations Institute of Sweden [1] where class 1 represents very easy conditions and class 5 indicates very difficult conditions. Acceptable terrain for this study was defined as bearing capacity classes 1 to 3, surface evenness classes 1 to 3, and ground slope classes 1 to 3.
There were two operating systems used: motor-manual cutting followed by cable skidding, and a one-grip harvester followed by forwarding. For the motor-manual system, most trees were felled towards the striproad, and in a herringbone pattern consistent with the direction of skidding. The trees were then delimbed and, in most cases, cut into two logs. The reduced length made it easier to swing the logs into the direction of transport after being winched to the striproad. The remainder of the crosscutting was done at the landing. For the mechanised system most trees were felled away from the striproad. Occasionally, the harvesters drove into larger stand openings in order to reach the trees farthest away. The logs were crosscut into 3 to 6 m lengths and stored in bunches at the edge of the striproad.
Five logging teams participated in the studies of motor-manual harvesting, while four logging teams participated in the studies involving mechanised harvesting. A single logging team of the required type was used per replication. The motor-manual cutting was done with 45 to 55 cm3 chainsaws with 33 to 38 cm bars. The mechanised cutting was done with 88 to 155 kW one-grip harvesters with 8.5 to 10 m reach. The cable skidding was done with 40 to 80 kW agricultural tractors (with forestry winches) and cable skidders. The forwarding was done with 80 to 100 kW forwarders with 10 to12 tonne load capacity.

Figure 1.The diameter distribution in a multi-storied stand of Norway spruce. This example is from the replication in Oppland county.
Estimating the Influence of Harvest Intensity
The study of harvest intensity was designed as a randomised block experiment with nine replications. Each replication included three treatment units of varying harvest intensities. Each treatment unit was 36 m x 60 m, and had a striproad spacing of 24 m. The striproads were 3.5 to 4.0 m wide. Harvest intensity was expressed in terms of the percent removal of basal area, and all trees to be harvested were marked before the cutting started. Three of the replications were harvested with motor-manual systems and six replications were harvested with mechanised systems. The harvesting was done under winter conditions in the period of November to February.
A number of descriptive measures were collected prior to harvest. This was so that different variables could be tested as alternative indicators of the risk for injury. First, a horizontal coordinate system was established. Then the X and Y coordinates of all trees taller than 0.5 m, together with their diameter at breast height, were recorded. For every tenth tree the height, live crown length, and crown diameter at its widest point were also registered. Stand density, basal area, and height over diameter curves were calculated from these data, as well as tree volume and crown projection.
In principle, injury rates are expected to be proportional to the probability for contact between the moving elements of the harvesting operation [trees or machines] and the residual stand. One way to assess this probability for contact is to compare the projected work area for the felled trees to the tree-free area which is available to do the work upon. This ratio of these two may be approximated using the removed vertical crown projection (RVCP in m2 per ha) and the horizontal crown-free projection before harvest (HCFP in m2 per ha).
Both vertical and horizontal crown projections were calculated using GIS (Geographic Information System)software. The calculation of vertical crown projection is based upon the representation of the crown, from the side, as a triangle. The horizontal crown projection is based upon the representation of the crown, from above, as a circle (Figure 2). The calculation of the horizontal crown-free projection takes into account the overlapping of the circles. The circle radius was assumed to be equal to the half the crown diameter at its widest point, and the triangles' height was assumed to be equal to the live crown length. The principle for the calculation of projection per ha is shown below.
RVCP =S(CL x CR)
for all harvested trees.
HCFP = 10,000 m2/ha - S(P x CR2) - CO
where
CL = live crown length [m]
CR = crown radius at widest point [m]
CO = crown overlap [m2/ha]
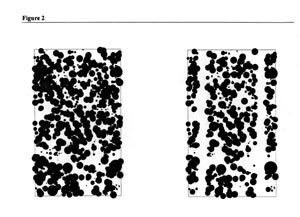
Figure 2.An example of crown projection before and after selection harvesting in a multi-storied spruce stand [seen from above]. The horizontal crown projection is shown as the dark area and the horizontal crown-free projection is shown as the white area.
The post-harvest sample was based upon four rectangular sample plots per treatment unit (Figure 3). These were 4 m wide and 24 m long, and stretch from striproad centre to striproad centre. All trees taller than 3 m were included in this assessment. Their diameter at breast height and distance from nearest striproad were recorded.
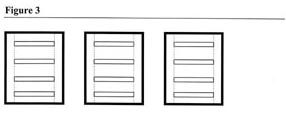
Figure 3. Experimental design for the study of harvest intensity. The three treatment units of varying harvest intensity are bordered by thick solid lines. The striproad centres are shown by the thin dotted lines and the post-harvest sample plots are shown by the thin solid lines.
Estimating the Influence of Operating Systems
The study of operating systems was designed as a randomised block experiment with four replications. Each replication contained two treatment units of equal harvest intensity, one for each operating system. The harvest intensity was 45% of basal area and the trees to be removed were marked in advance. The harvesting was done under winter conditions during the months of February and March. Both treatment units within each replication were harvested at the same time.
In this study the size of each treatment unit and its striproad spacing were adjusted to the characteristics of the operating system. The treatment units for motor-manual cutting and cable skidding were 36 m wide and 70 m long. The striproad was located in the middle, giving an effective striproad spacing of 36 m. The treatment units for mechanised cutting and forwarding were 72 m wide and 70 m long, with the striproads located at 24 m spacing. The striproads for both systems were 3.5 to 4.0 m wide.
A number of measures were collected in a pre-harvest sample. This sample was based upon six systematically placed circular plots (7.98 m radius) per replication. The number of trees ( 0.5 m high) within each plot was recorded together with their diameter at breast height. The height of every tenth tree was also measured. Stand density, basal area, height over diameter curves, and standing volume were calculated from this data.
The post-harvest sample was based upon four-m- wide rectangular sample plots stretching between striproad centres (Figure 4). There were five of these for the motor-manual system and 10 for the mechanised system, per replication. All trees over 0.5 m in height were included in the post-harvest assessment.
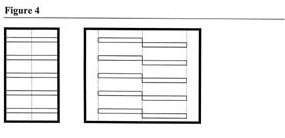
Figure 4.Experimental design for the study of operating systems. The treatment unit [thick solid line] for the motor-manual harvesting is on the left, and treatment unit for the mechanised harvesting is on the right. The striproad centres are shown by the thin dotted lines and the post-harvest sample plots are shown by the thin solid lines.
Statistical Analysis
The calculation of injury rate was based on the occurrence of injured trees within the post-harvest sample. A tree was judged as injured if the damages per tree exceeded a pre-defined level. All trees were given an equal weight in the calculation of the injury rate.
Statistical analysis was done with the SAS computer package (SAS Institute, Inc., USA). A number of different procedures were used, including PROC GLM and PROC REG [9]. Levels of statistical significance are denoted with stars (* for p0.05, ** for pless than 0.01, and *** for p less than 0.001).
RESULTS
The Influence of Harvest Intensity
The average injury rate for the study of harvest intensity was 11.4% (n=1160 trees). A GLM analysis of variance found that the injury rate varied significantly between replications (REP***), harvest treatments (TR***), and tree size (SZ**).
Sixty-two percent of the injured trees had damage to the bole. Thirty-six percent of the trees with bole damages also had crown damages. The average area of bark or fibre damage was 79 and 105 cm2 for small (dbh 10 cm) and large trees (dbh 10 cm), respectively. Only 12% of the injured trees had damages located on the root system.
Fifty-five percent of the injured trees had damage to their crowns. The average green crown removal for trees with damaged crowns was 54 and 37% for small and large trees, respectively. Sixteen percent of the injured trees had been pushed over during harvesting, and failed to return to a vertical position. This group consisted of small trees only.
Because of the variation in harvest intensity, site index, and forest conditions between replications, the values for harvested volume and crown projection per ha varied considerably. The harvested volume had an average value of 116 m3 per ha and varied from 58 to 203 m3 per ha. The removed vertical crown projection [removed crown projection when seen from the side] had an average value of 7011 m2 per ha and varied from 4486 to 11,199 m2 per ha. The horizontal crown-free projection (crown-free projection before removal, when seen from above) had an average value of 3620 m2 per ha and varied from 2435 to 5537 m2. The average values of percent removed basal area, removed volume (m3 per ha), and the ratio between removed vertical crown projection and horizontal crown-free projection before harvest are shown in Table 1.
Table 1.Three alternative variables for quantifying harvest intensity in multi-storied spruce stands: percent removal of basal area [% BA], removal volume per ha [VOL], and the ratio of removed vertical crown projection to horizontal crown-free projection [RVCP/HCFP].
| Harvest intensity | low | med | high |
| % BA | 34 | 43 | 54 |
| VOL | 86 | 125 | 136 |
| RVCP/HCFP | 1.74 | 2.18 | 2.41 |
While the analysis of variance (n=27 treatment units) showed that the injury rates varied significantly with harvest treatment, the highest coefficient of determination (R2) for a single independent variable was achieved by the interaction of harvest intensity and operating system (where OP=0 for motor-manual systems, and OP=1 for mechanised systems). Three alternative interaction variables were tested. They included: percent removal of basal area (%BA x OP*), removal of volume (VOL x OP**), and the ratio of crown projections (RVCP/HCFP x OP***). These three could explain 22, 29, and 40% of the observed variation in injury rate, respectively.
A regression model was made, based upon the ratio of crown projections. In this model the intercept was not significantly different from zero. Since this is also a logical condition, the intercept was restricted to zero in the analysis. This restriction did not have any significant effect upon the model. It does, however, result in an overestimation of the coefficient of determination. The function is shown below and the model is shown graphically in Figure 5.
injury rate = 2.686 [RVCP/HCFP]
+ 3.418 [RVCP/HCFP x OP]
R2 = 0.77, pless than 0.0001
The Influence of Operating Systems
In the study of operating systems the average injury rates were 8.7 and 13.7% for motor-manual and mechanised harvesting, respectively (n=1030 trees). According to a GLM analysis of variance, the factors with the most significant influence upon the injury rate were the distance from the striproad (cutting zone, ZN****), and an interaction between the cutting zone and operating system (ZN x OP***).
The injury rates for each system and cutting zone are shown in Figure 6. For motor-manual and mechanised harvesting, 20 and 48% of the residual trees, respectively, were located in the cutting zones closest to the striproad.
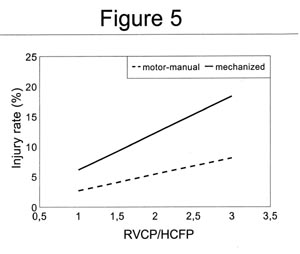
Figure 5.The influence of harvest intensity upon the injury rate after single-tree selection harvesting in multi-storied spruce stands. The harvest intensity is represented by the ratio between the removed vertical crown projection per ha (RVCP) and the horizontal crown-free projection per ha (HCFP).
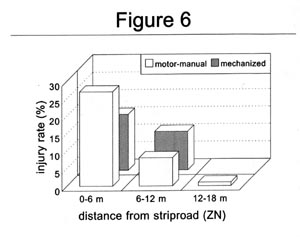
Figure 6.The influence of the operating system upon injury rates after single-tree selection harvesting in multi-storied spruce stands. The varying distances from the striproad centre are indicated by the three cutting zones (ZN) on the x-axis.
The injury rate was again found to vary with tree size (SZ**). The average injury rate was 13.0% for small trees (dbh 10 cm) and 7.5% for large trees [dbh 10 cm]. With respect to specific damage types, the largest difference in injury rates between operating systems was for the crown damages. The occurrence of this particular type of damage was highest for small trees (SZ**) and mechanised harvesting (OP**).
The average severity of bole damage was higher for mechanised (165 cm2 per tree) than motor-manual harvesting (93 cm2 per tree), however, this difference was not found to be statistically significant. Damage to the roots or root collar was found only after mechanised harvesting. The average severity of crown damages (portion of green crown volume torn off) was also slightly higher for mechanised (58%) than for motor-manual harvesting (45%). This difference was not found to be statistically significant. The distribution of crown damage severity is shown in Figure 7.
DISCUSSION
The results show that the injury rate for single-tree selection in multi-storied spruce stands is influenced by both operating systems and harvest intensity. However, the single most significant variable is the interaction between these two factors.
These effects are quite important for the economic result of uneven-aged management of Norway spruce. Previous studies [5] show that the incidence of decay in Norway spruce is very high, and that the rate of spread is higher than for many other species. The same studies found that both the rate of spread and eventual growth reductions are correlated with the size of bole damages. Studies of regeneration mortality after harvesting show that both bole damage and lean angle are relevant to survival [8], and that a combination of these may be particularly important [10]. Our present study also includes criteria related to green crown removal. This is because of the common occurrence of this type of damage while harvesting at low temperatures.
Logically, the risk for injury should be highest where the probability for contact with the residual stand is highest. This probability should increase proportionally with the amount of movement or handling in the stand. The results of this study support this explanation. The amount of handling was quantified in three ways: percent basal area, cubic meters per ha, and the ratio between the removed vertical crown projection and horizontal crown-free projection. The percent removal of basal area could only describe the relative increase in handling per ha, and, it therefore explained the least of the observed variation in injury rates. The removal of cubic meters per ha indicated the absolute level of handling, which includes the increase in handling with harvest intensity. This variable could therefore explain more of the variation. The best statistical performance was attained by the crown projection ratio, because this variable indicates not only the absolute level of handling per ha, but defines this in terms of the probability for contact during handling under the specific stand conditions.
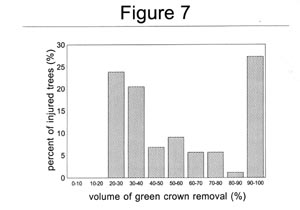
Figure 7. The distribution of crown damage severity, for trees with injured crowns, after selection harvesting in multi-storied spruce stands. Crown damage severity is expressed in terms of the portion of green crown volume lost during harvesting.
The fact that the crown projection ratio gave improved statistical performance is also related to the criteria and definitions used in this study. Because of the nature of uneven-aged management, the criteria for damage were focused just as much upon the crowns of the small trees as the bole of the main stems. The structure of these stands, with a few large trees with wide crowns and many smaller trees with weak crowns, leaves the smallest trees exposed to impact from the felling and handling of the largest trees around them. While large trees may often be felled upon or brushed by other large trees on their descent through the upper canopy, the slightest contact with the smaller trees at lower levels will easily result in the breakage of tops or thin branches, particularly when these are made brittle by cold weather. The high number of small trees in these stands, and the stringent damage limits used in this study, gives this type of damage a strong influence upon the average injury rate.
Within the observed data there exists a distribution of severity for each damage type. Because of this, the level of the calculated injury rates will vary with the chosen level of damage criteria. Therefore, if there are differences in average damage severity between the different operating systems, varying the minimum damage criteria may also cause the difference in injury rates between operating systems to vary. To which degree the difference can vary depends upon the distribution of damage severity.
In general, the highest injury rates were found closest to the striproad. This is because most handling occurs in this area. However, there are two basic differences between motor-manual and mechanised harvesting when it comes to tree handling. The first is the amount of handling per tree which is required during conversion and transport. The second is the speed of handling during these activities. These differences are likely causes for the observed variation in injury rates and severity.
For motor-manual cutting, the tree is delimbed, crosscut, and stored in the same position as it falls. For mechanised cutting, since the tree is felled away from the striproad, it may have to be dragged some distance before it is close enough to the harvester for processing. Temporary storage beside the striproad requires the disturbance of yet a new area, in addition to those already impacted during felling and processing. Therefore, there is a greater amount of handling per tree during mechanised cutting and this handling is distributed throughout a larger proportion of the stand. Furthermore, during motor-manual cutting the trees are often felled into areas which are already harvested. Falling into already harvested areas may, in effect, give the motor-manual forestry worker a larger margin of error than the harvester operator. This, in turn, results in a lower probability for contact in the impacted areas.
The transport sub-operation may have reduced the difference in injury rates created during cutting. Cable skidding after motor-manual cutting is often considered to increase the projection of the handling area. This is because of the necessity of changing the logs' direction of travel between the stand and the striproad. This may be part of the explanation for the higher injury rates for cable skidding in the zone closest to the striproad [Figure 6]. However, the longer distance between striproads which this operating system allows results in a lower injury rate for the stand as a whole. In addition, the ground forces for cable skidding were apparently not large enough to produce the type of root damages found after forwarding.
The differences in damage severity between the two operating systems may be attributed to the differences in how the trees are handled. Even though the severity of crown and bole damages were not found to differ significantly between operating systems, the fact that mechanised operations had higher average values for both damage types is unlikely to be a coincidence. This is because when contact between some part of the harvesting operation and the residual stand is first made, one would expect that the operating system with the highest momentum during handling [mechanised] would result in the greatest impact force and largest damages. However in some cases, for example crown damage which is shown in Figure 7, a statistical treatment is not straightforward. This is because the calculated averages fall between the predominance of small or very large damages.
Concluding Remarks
In this study, the largest differences in injury rates between operating systems were found at the sites where the silvicultural prescription created the greatest risk for injury. The greatest risk for injury was found at high harvest intensities in densely stocked stands, which left little room for the movement of trees or machines. This aspect has been successfully represented by a simple geometrical model based upon the contact surface of trees in the stand. The different injury rates for the two harvesting systems is attributed primarily to the different proportion of areas which are exposed to each system's respective activities.
In general, the results of this study have been presented as aggregated averages for certain units or zones. A better approach may be to delimit different impact area for each operating system's handling pattern, and then estimate the injury rate specifically for each area. If these processes are analysed in more detail, these questions may be answered by a purely mathematical approach.
This study found that the least damage to the residual stand was provided by the system with the lowest degree of mechanisation. However, in the Nordic countries, it is the high degree of mechanisation which has kept harvesting costs at an acceptable level and ensured profitability throughout a long period of increasing labour costs [2]. The costs of selection harvesting with different degrees of mechanisation must therefore be included in the analysis before any final recommendations are made.
ACKNOWLEDGEMENTS
This study was supported by grants from the Nordic Council for Forest Research and the Norwegian Research Council. The study plan was the result of a cooperation between Prof. Oddvar Haveraaen, Prof. Birger Solberg, senior scientist Kjell Andreassen, and the authors. The field work was co-ordinated by research technician Hans Nyeggen and the calculation of crown projection ratios was done by research fellow Terje Gobakken.
REFERENCES
[1] Anonymous. 1991. Terräängtypsschema föör skogsarbete. Forskningsstiftelsen Skogsarbeten. 28 p.
[2] Berg, S. 1993. Cost trends in silviculture. SKOGFORSK Redogöörelse 5/93. 36 p.
[3] Fjeld, D. 1995. Forest operations in a multiple-use forest landscape - some basic trends for norwegian conditions. In: Heding, N. [ed.] Forest operations in multiple-use forestry - a NSR project. Denmark: Danish Forest and Landscape Research Institute. 103 p.
[4] Hagströöm, S. 1994. A study of logging damage to ingrowth in selection logging. (M.Sc. Thesis). Umeåå: Swedish University of Agricultural Sciences. 22 p.
[5] Isomääki, A. and T. Kallio. 1974. Consequences of injury caused by timber harvesting machines on the growth and decay of spruce. Acta Forestalia Fennica 137:1 -24.
[6] Lundkvist, L. 1989. Use of the selection system in Norway spruce forests changes in the stand structure, volume increment, ingrowth and regeneration of experimental plots managed with single-tree selection [Dissertation]. Umeåå: Swedish University of Agricultural Sciences 22+25+21+18+15+4 p.
[7] Määkela, M. 1992. Drivningsteknik i naturlig bestååndsfööryngring. Metsääteho Katsaus 6/92. 4 p.
[8] Ruel, J.-C., R. Doucet and J. Boily. 1995. Mortality of balsam fir and black spruce advance growth three years after clear-cutting. Canadian Journal of Forest Research 25(9):1528 -1537.
[9] SAS Institute Inc. 1988. SAS/STAT users guide, release 6.03 edition. Cary, NC: SAS Institute Inc. 1028 p.
[10] Tesch, S.D., C. Baker-Katz, E.J. Korpela and J.W. Mann. 1993. Recovery of douglas-fir seedlings and saplings wounded during overstory removal. Canadian Journal of Forest Research 23(8):1684 -1694.
[11] Westerberg, D. and S. Berg. 1994. Felling of standards: trial method for determining productivity, costs and damage to advance growth. SKOGFORSK Redogöörelse 10/94. 26 p.