
Display large image of Figure 1
January, 2000, vol.11 no.1
D. Fjeld
Norwegian Forest Research Institute
Bergen, Norway
L. Hem and T. Eikebrokk
Norwegian School of Economics
and Business Administration
Bergen, Norway
ABSTRACT
This study examines the role of forest operations strategies in sector development for Norway�s fjord region. The paper starts with an examination of forest owner attitudes and perceptions in relation to their harvesting behaviour, use of contractor harvesting and road net extension. The influence of forest owner decisions, contractor mechanisation and road net extension standards on operational efficiency is examined in a simple deterministic model of the regional wood chain. Average wood procurement costs are calculated for increasing sector capacity. Direct and indirect harvesting costs are also followed throughout this development.
Keywords: forest owners, forest operations, regional wood chain, deterministic model.
The authors are, respectively, Senior Scientist, Research Fellow and Associate Professor.
INTRODUCTION
Forest exploitation has a long history in western Norway. Already during the Bronze Age a rising population of farmers started to utilise timber for firewood, buildings and fencing materials. The exploitation of native Scots pine forests increased with the introduction of water-powered frame-saws in the 1500�s and growing exports to other European markets. These exports ceased, however, in the 1700�s when access to large dimensions close to the fjords began to decline [36].
By the beginning of the 1900�s increased demands for building materials resulted in the initiation of regional afforestation programs. Today between 15 and 20% of the productive forest area consists of introduced Norway- and Sitka spruce, which have a volume production well over five times the native Scots pine and Downy birch. While the present annual growth is 370% above harvesting levels, self-sufficiency for building materials and the wood processing industry is only 20% and 25%, respectively [13]. There is, therefore, a clear potential for development of the forest sector in western Norway but this development must be supported by forest operations strategies giving efficient and sustainable access to the resource base.
Forestry in western Norway
The average forest ownership in western Norway is under 50 ha in size and is normally part of an agricultural holding that provides only part of the owner�s income. The small size means that annual harvest activity is limited. Typically, only one in five ownerships harvest timber in a given year. When they do, these operations have an average volume of 80 m3 of which a large portion is used for upkeep of the property.
Forest conditions vary considerably within this region. Over half of the productive forest area has an inclination greater than 30%. The steepest slopes and deepest fjords are found in the inner coast where glaciers have scoured valleys with an average slope length of over 400 m. The average truck road density in this region is between 4 and 5 m/ha productive forest, while the density of tractor roads is just under 10 m/ha [9].
Contractor harvesting capacity is still low but developing. In 1978 approximately 30% of the harvest volume was cut by persons others than the forest owner. By 1988 this had increased to 39%. At present 70% of harvesting enterprises consist of part-time contractors working with chainsaws and forestry-equipped agricultural tractors. The remaining 30% have at least one single-purpose forestry machine [7].
Approximately 55% of the timber volume harvested for sale in the fjord region is delivered to local sawmills. Most of the remaining volume is shipped to the pulp and paper industry located in neighbouring regions. A typical county has one medium-large (30,000 m3/yr) sawmill, 5-6 medium-sized (10-15,000 m3/yr), and over 100 smaller, farmer-owned mills (<1000 m3/yr). The optimal capacity for a central sawmill in western Norway has been estimated at 60,000 m3/yr of roundwood consumption [25].
Forestry and rural development
Forestry is often assumed to provide positive effects for rural populations, simply because of their proximity to the resource base. This view is based upon traditional studies of regional competitiveness emphasising economy of scale and comparative advantages [33]. These theories have been found to be most applicable to basic industries such as forestry, resulting in clear relationships between manufacturing activities and settlement patterns. In many forestry-dominated regions, however, the consequences of post-war specialisation and mechanisation has been depopulation, if not accompanied by an increase in local wood processing [1]. In this context, the employment potential of the mechanical wood industry is often stressed because of its low investment requirement, limited economy of scale and ability to serve local or regional markets. Market growth is therefore seen as the most serious constraint, particularly where high transport costs prevent deliveries to other regions. In contrast to other markets, however, the only barrier to entry is access to raw material [14]. Therefore, even though western Norway�s forest sector does not have a dominant economic role, the region�s low harvest volumes make the sawmill industry a suitable wood chain to follow when examining development potential.
Goals
In non-industrial private forestry, timber availability is often more limited by the forest owner�s willingness to sell than growth or allowable cut volumes [19]. Even though certain aspects of forest operations strategies, such as forest roads standards or the degree of mechanisation, may be determined by forest service or forest owner association policy, the decision to initiate road net extension or contractor harvesting is made by the forest owner. This study has therefore two goals:
Goal 1 - To develop a framework comparing the influence of forest owner attitudes and perceptions upon the decisions regarding timber sales and forest operations strategy.
Goal 2 - To quantify the effects of decision outcomes upon wood procurement costs for sawtimber, with particular attention to terrain difficulty, contractor capacity and road net extension.
METHODS
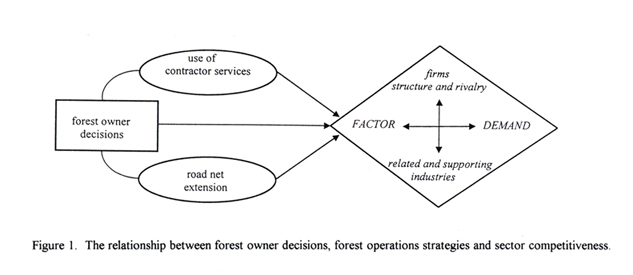
The development of the forest sector is ultimately based upon the competitiveness of its products. Competitiveness, as described by the Porter diamond model [17] is correlated with the presence of 4 types of conditions (Figure 1). The first two are termed factor and demand conditions. Factor conditions may be further subdivided into basic and advanced factors. Natural resources are termed basic conditions while labour, skills, managerial knowledge, transport infrastructure and capital availability come under advanced factors. The other two conditions, structure of firms and rivalry and related and supporting industries include the degree of vertical and horizontal support and form the foundation for successful industrial clusters.
Because of the afforestation history in this region, many forest owners are inexperienced. For this reason, factor conditions for forest products firms are, in part, determined by the development of forest owner management skills. A mix of methods from social science and operational efficiency was therefore chosen for this study.
Applying multiple research methods to the same problem is one way to strengthen the conclusions of a study [20]. Multiple methods have also been used in an analysis of regional factors� influence on harvesting contractor viability in western Norway. Fjeld and Løvik [8] examined contractor viability from the perspective of capacity utilisation and operating costs while Eikebrokk and Hem [3] examined from the perspective of contractor attitudes and satisfaction. Fjeld, Hem and Eikebrokk [7] made an analysis of viability combining methods from operational efficiency and social sciences. In this case factors that achieved a high ranking by both methods were used to identify development opportunities.
Display large image of Figure 1
FIGURE 1 - The relationship between forest owner decisions, forest operations strategies and sector competitiveness
Forest owner decisions
Attitudes have for several decades been the dominating concept in explaining and predicting human behaviour. In this context attitudes may be defined as �a learned predisposition to respond in a consistently favourable or unfavourable manner with respect to a given object� ?5?. This definition emphasises that attitudes are learned and, therefore, that forest owner behaviour can be perceived as a result of attitudes and prior knowledge. This is the perspective adopted in this paper.
The study of forest owner decision-making was divided into two phases. The first phase consisted of personal interviews with the aim of finding the range of factors which forest owners themselves considered relevant to their situations. The second stage consisted of a confidential questionnaire study, which was aimed at quantifying the influence of the different explanations upon harvesting behaviour and choice of forest operations strategy.
Personal interviews
One hundred and thirty-eight forest owners were interviewed in the first phase. These were geographically spread between the four counties of western Norway. The personal interviews examined owner attitudes and knowledge through various elicitation methods including ranking, projective techniques and free word association [18]. The elicitation methods chosen made it possible to capture a wide range of variables and to collect a complete set of possible explanations for different decisions outcomes. All interviews were recorded on tape for later review and registration of themes and formulations to be used in the questionnaire.
Questionnaires
In the quantitative part of the research a correlation design was chosen. 2382 of the region�s 16,686 forest owners (forests > 10 ha) were sent questionnaires in the mail. 1146 of these (51.8%) returned completed forms. The questionnaire collected two basic kinds of information: descriptive statistics and questions relating to the attitudes elicited in the personal interviews.
The descriptive statistics included: distribution of income, owner participation in forest operations, productive area, species and age distribution, current harvesting and timber sales, amount of forestry equipment owned, frequency of road net extension and use of contractor services. The percent of annual increment harvested for sale was calculated according to the average rates shown in county inventories [21,22,23,24].
The questionnaire included 90 formulations aimed at four main themes of owner attitudes and perceptions. These themes included: forestry knowledge, the state of forestry on the ownership, the local forestry institutions and general aspects of forestry in western Norway. The replies were given on a standardised scale of 1 to 6 where complete disagreement and agreement with a formulation were given values of 1 and 6, respectively. A more complete specification of the questionnaire may be found in Eikebrokk and Hem [4].
Forest operations strategies
According to NOU [21] there are three main challenges to further development of the forest sector in western Norway. These include: difficult terrain, low harvesting contractor capacity and low road net density. The state of harvesting mechanisation and contractor capacity in western Norway has already been examined by Fjeld, Hem and Eikebrokk [7]. The two remaining aspects, terrain difficulty and forest road network extension, are therefore chosen as the themes for this study.
The influence of road density upon skidding distances has been studied in other areas of Norway by Samset [27]. A number of studies, including Von Segebaden [35] show that the relationship between road density and average skidding distance varies with terrain difficulty. The rank-exact relationship between road density and skidding distance is defined in Samset [28] by the road net factor (f) with the following formula:
Formula 1:
sk = (2.5*f)/V
sk = average skidding distance (km)
V = road density (m/ha)
f = road net factor
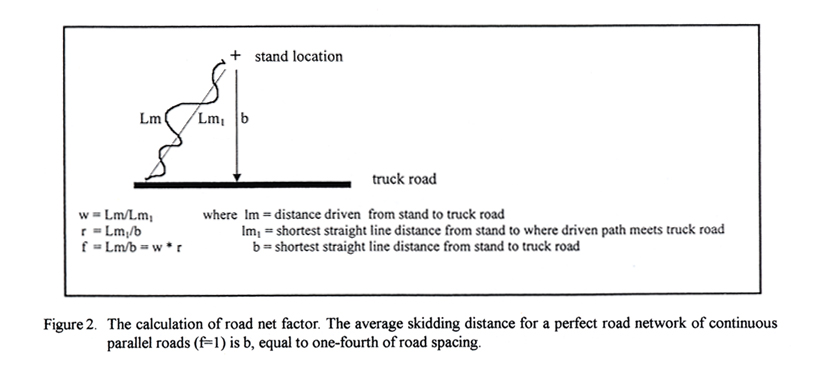
Samset specifies that the road net factor (f) is a product of road factor (r) and wander factor (w) as defined in Figure 2 below.
The study of terrain�s influence on road net factor (f) is therefore divided into two phases: the first examining the wander factor (w) and the second examining road factor (r). Because of the high tractor road density in this region there are two different road net factors that must be estimated; one for the truck road net alone (f1) and one for the truck and tractor net together (f1+2).

Display large image of Figure 2
FIGURE 2. The calculation of road net factor. The average skidding distance for a perfect road network of continuous parallel road (f=1) is b, equal to one-fourth of road spacing.
Wander factor
The study of wander factor (w) was based on 18 ground-based harvesting operations in Hordaland County. These operations included a variety of forestry-equipped agricultural tractors and single-purpose forestry machines. Each operation had 5-10 transport paths, making for a total of 134 observations. For each path both the driven distance (Lm) and horizontal straight-line distance (Lm1) to where the skidding path intersects the nearest permanent road was recorded. The horizontal straight-line distance was calculated trigonometrically based upon chaining, compass and clinometer measurements. The driven distance was measured with a disposable thread spooler.
Terrain conditions were recorded for each terrain unit in a systematic sample of 15 sample plots per unit. These recorded terrain inclination, bearing capacity and surface structure. The inclination measurements were made at eye-to-eye level over a distance of 25 m. The average terrain inclination varied from 2 to 50%.
Road factor
The study of road factor was based on 12 study areas located in Hordaland County. While the study of wander factor was done on active ground-based logging operations, the study of road factor was based on past or planned harvesting operations. The areas varied from 74 to 254 ha and had road networks with clearly defined coverage. Two of these were located on the outer coast, four in the middle coast and six in the inner coast. This was according to the average distribution of productive forest area in these zones. The areas were further sub-divided into 27 terrain units.
The permanent truck and tractor road network for each study area was mapped on a scale of 1:5000. These maps were then covered with a grid, locating 25-30 sample points per area for a total of 334 observations. The transport alternatives from each point to the nearest landing were first planned in the office, viewed from a local vantage point in the field and then found in the terrain where the chosen alternative was followed and marked on the map.
After the fieldwork was complete the horizontal distances (b, Lm1) were measured on the map with rulers and map measuring wheels. The driven distance (Lm) was divided into two separate components: the distance driven in the terrain and the distance driven on the permanent tractor road. For ground-based harvesting systems the distance driven in the terrain was calculated by multiplying the horizontal straight-line distance (sample point to tractor road) with the appropriate wander factor. For cable-harvesting systems this wander factor was defined as the inverse cosine of the terrain inclination. Every fifth skidding path utilising tractor roads was measured in the field with a measuring wheel in order to convert the horizontal map distance to the actual driven distance.
The terrain at each sample point was measured in the same way for both the wander- and road factor studies. The average inclination in the road factor study varied from 10 to 54%. A more complete specification of the study areas may be found in Fjeld, Nordby and Nyeggen [9].
The regional wood chain
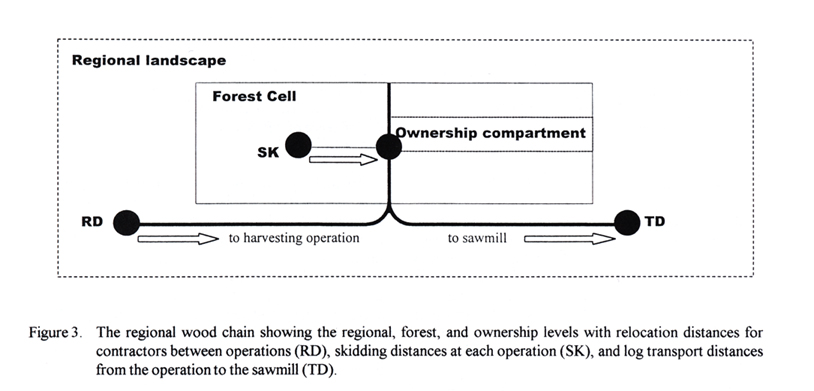
The synthesis of forest owner decisions and forest operations strategies was made with a simple deterministic model of the regional wood chain (Figure 3). The wood chain is set in a regional framework of variable conditions for forest production, terrain, contractors and sawmills. In this framework one of the most important aspects of forest owner harvesting decisions is their influence on the regional harvesting intensity (m3/km2/yr) and consequences for the various transport distances required to move contractors between operations and deliver processed logs to sawmills (TD).
The flow of timber in the wood chain is followed through three levels: the regional landscape, the forest cell and the forest ownership. The landscape is defined to have a certain distribution of productive forest and other land-use areas. The productive forest area is then defined to consist of forest cells of specified size, species composition and terrain conditions. Each cell is then defined to include a certain number of ownership compartments with a defined harvesting activity (proportion of annual increment). The regional harvesting intensity per square kilometre of total area is then approximated according to formula 2.
Formula 2:
HI = PP * AI * HA
HI = regional harvesting intensity (m3/km2/yr)
PP = proportion of land consisting of productive forest
AI = annual increment of productive forest (m3/km2/yr)
HA = proportion of annual increment harvested to sale
The wood chain includes two main activities: contractor harvesting and long-distance truck transport. Two different levels of mechanisation for harvesting contractors are considered (Table 1).

Display large image of Figure 3
FIGURE 3. The reagional wood chain showing the regional, forest, and owndership levels, and ownership levels with relocation distances for contractors between operations (RD), skidding distances at each operation (SK), and log transport distances from the operation to the sawmill (TD).
TABLE 1. Mechanisation alternatives for harvesting contractors in the regional wood chain. ML=0 for forestry-equipped agricultural tractors and ML=1 for single-purpose forestry machinery.
| Ground-based | Cable harvesting | |||
| ML | felling/processing | Transport | felling/processing | Transport |
| 0 | motor-manual | agricultural tractor
w/log trailer (7 m3 load) |
motor-manual | agricultural tractor w/ high-lead winch (150 m/0.67m3 load) |
| 1 | 1-grip harvester | medium-sized forwarder (11 m3 load) |
motor-manual felling mechanised processing |
medium-size cable crane (350 m/1.3 m3 load) |
The time consumption for transport operations is calculated as a function of average skidding distances and terrain conditions. For ground-based harvesting systems these are done according to formulas from Furuberg-Gjedtjernet [12] and Samset [28] and for cable harvesting systems from Dale et al.[2] and Fjeld [6]. Transport times between the truck road and harvest unit (for motor-manual cutters and harvesters) use driving and walking speeds, which are specific for terrain and tractor road travel. Hourly costs for forest machines were calculated according the investment-based formulas in Samset [28].
It is assumed that relocations for light equipment are done by driving the hachines between operations while heavy equipment is assumed to be moved by trucks with semi-trailers. The time consumption for relocation is defined as a function of terminal times and relocation distance. The average distance between operations is calculated as a function of the side length of a square with an area providing the specified volume per operation (Formula 3).
Formula 3:
RD = S ((HI * CP)/(NC * HV))0.5
RD = average shortest distance between contractor harvesting operations (km)
HI = regional harvesting intensity (m3/km2/yr)
CP = proportion of harvesting done by contractors
NC = number of locally competing contractors
HV = annual harvest volume per operation (m3)
S = wander factor for public road network
Harvesting costs include both direct operating costs as well as indirect costs for road network extension and maintenance. It is assumed that road construction costs vary with road standard and terrain inclination according to regional statistics. Construction costs are amortised over a period of 20 years where 50% of the sum of construction and maintenance costs are charged to forest harvesting and distributed over the available harvest volume.
Long-distance transport from the landing to the mill is assumed to be done with a truck and trailer combination with an average load volume of 36 m3 shortwood. The time consumption and hourly costs were calculated according to calculations from TFO [31]. Driving speeds are specific to each road standard. The distance driven on forest roads is set to half the total truck road length per forest cell. The average distance on the state highway (TD) is estimated as the average transport distance for a hexagonal procurement area providing the sawmills� defined roundwood consumption (Formula 4).
Formula 4:
TD = 0.3772 * S ((HI * SP)/(NS * SC))0.5
TD = average transport distance for logs travelling to the sawmill on state
highways (km)
HI = regional harvesting intensity (m3/km2/yr)
SP = proportion of roundwood sales to sawtimber
NS = number of locally competing sawmills
SC = annual sawmill consumption of roundwood (m3/yr)
S = wander factor for public road network
RESULTS
Results with a statistical significance level of p < 0.05 are presented. Analysis of forest owner decision-making was done in the SPSS statistical package with linear and log-likelihood regression. Statistical analysis of road net factor was done in the SAS statistical package with GLM (generalised linear models) and REG (linear regression) procedures.
Forest owner decisions
The questionnaire results yielded a number of correlations with harvesting activity and choice of forest operations strategies. The slopes of these correlations were estimated with a standardised beta coefficient (b) so that the influence of different reply scores could be compared and ranked.
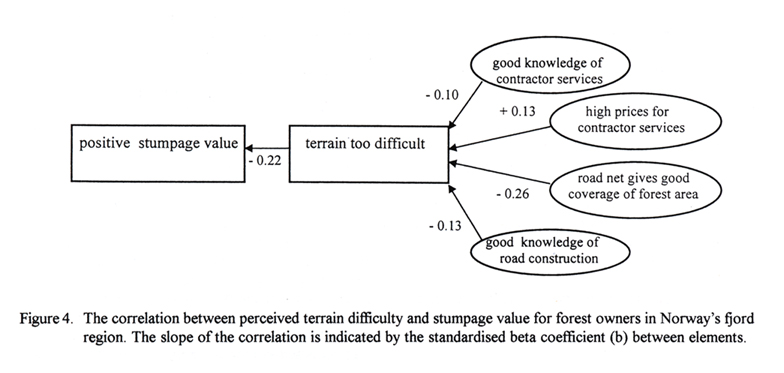
One reply assumed to be relevant to harvesting activity was the owner�s perception of the forest holding�s stumpage value. The reply with the highest ranking after correlation with perceived stumpage value, was whether or not the owner judged the terrain as too difficult for forest operations (b=0.22). A number of other replies were then, in turn, found to be significantly correlated to the scores for perceived terrain difficulty. The reply which achieved the highest ranking for terrain difficulty (b=- 0.26) was the owners opinion of the how well the road network provided contact with the holding�s forest area (Figure 4).
The harvesting activity on each ownership (percent of annual increment) was also found to be correlated with operations-related scores. While perceptions of both contractor prices (b=0.08) and road net efficiency (b=0.08) had a significant effect upon harvesting activity, the factor with the highest ranking consisted of an interaction between two other replies. This interaction was between the owners� perceived level of dependence upon timber revenues and the total level of timber purchase and consumption at local mills (b=0.20).
Regression analysis of the log likelihood (LOGIT) of the owner�s choice of forest operations strategies also resulted in a number of significant results. The use of contractor harvesting was positively correlated with the interaction between the owner�s dependence upon timber revenues and knowledge of contractor services (b=0.10). The frequency of contractor harvesting was negatively correlated with the interaction between timber revenue dependence and whether or not the owner had sufficient forestry equipment to do the harvesting alone (b= -0.10). The occurrence of road net extension was positively correlated with two factors. These included the owner�s understanding of the subsidy system (b=0.16) and farmer�s ownership of sufficient forestry equipment (b=0.23).

Display large image of Figure 4
FIGURE 4. The correlation between perceived terrain difficulty and stumpage value for forest owners in Norway's fjord region. The slope of the correlation is indicated by the standardised beta coefficient (b) between elements.
Forest operations strategies
The field studies showed that for ground-based harvesting systems, the wander factor (w) and road factor (r) for the truck road net varied with average terrain inclination and its variation. The road net factor (product of wander factor and road factor) varied correspondingly (Table 2).
A regression analysis yielded the results shown below (Formula 5).
Formula 5:
f1 = 1.22+ 0.0334567(INC)+0.05523(INC*VAR)
R2 = 0.17 n = 286
The above calculations of road net factor (f1) are based on the sample points included in the roads area of �perfect� coverage. These points were geometrically delimited by a line drawn perpendicular to the direction of travel at the end of each truck road. The average road net factor per terrain unit (calculated by formula 1) was 10.4 % larger than the road net factor per sample point (calculated as the product of wander and road factor).
Because of the high density of tractor roads in these areas, 60% of the skidding distance was on a permanent road surfaces. Using the average skidding distances in the terrain and on the tractor road and the corresponding truck (V1) and tractor (V2) road densities, the average road net factor for each unit�s truck road net (f1) and total road net (f1+2) was calculated by formula 1. The average ratio between the f1+2 and f1 was 1.22. This ratio increased with the proportion of total road density consisting of tractor roads and decreased with the interaction between this factor and proportion of cable harvesting in the area (Formula 6).
Table 2. The influence of average terrain inclination and its variation upon road net factor (f1) for truck roads in Norway�s fjord region. VAR=0 and 1 for areas with SD < 25 and > 25, respectively.
| Groundbased | Cable harvesting | |||
| VAR | 0-20% | 20-40% | >40% | |
| 0 | 1.69 | 2.03 | 3.52 | 1.56 |
| 1 | 2.36 | 3.90 | -- | 3.89 |
Formula 6:
f1+2/f1 = 0.8426 + 0.7267 (V2/V1+2)
- 1.8483
(V2/V1+2* % cable harvesting)
R2 = 0.44 n=22
The regional wood chain
The forest owners in this study harvested, on average, 24% of their estimated annual increment for commercial timber sales. With an average of 17.5% of the productive area per cell covered by introduced spruce, and 14% of the total land area consisting of productive forest area, the regional harvesting intensity was calculated to be approx. 10 m3/km2/yr.
Using the results from this study as well as earlier contractor studies, the harvesting- and road net extension costs were calculated for varying classes of terrain inclination (Table 3).
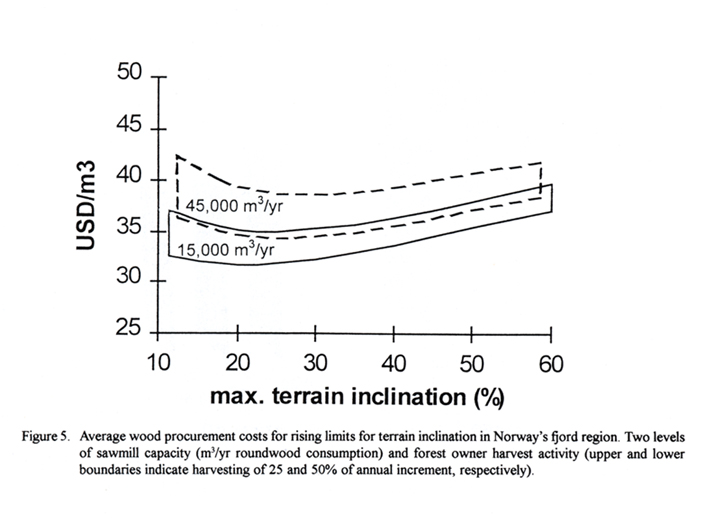
The total wood procurement costs forward to the sawmills were also calculated. This was done for rising limits of maximum terrain inclination for harvesting operations. The distribution of annual increment per inclination class was used to model the resulting influence of increasing harvest intensity (m3/km2/yr) on contractor relocation distances, skidding distances and log transport distances. The results for two levels of sawmill capacity and forest owner harvest activity are shown below (Figure 5).
While direct and indirect harvesting costs increased by over 60% with increasing terrain inclination, average wood procurement costs increased by less than 10%. The highest procurement costs were found for mills of high capacity (45,000 m3/yr) buying timber from forest owners with low harvest activity (25% of annual increment) in the easiest terrain only (<10% inclination). For mills of low capacity (15,000 m3), however, the highest cost level was found when buying timber from forest owners harvesting in all terrain types. Increasing the forest owners harvest intensity from 25 to 50% resulted in cost reductions of 10-15 %, alone.
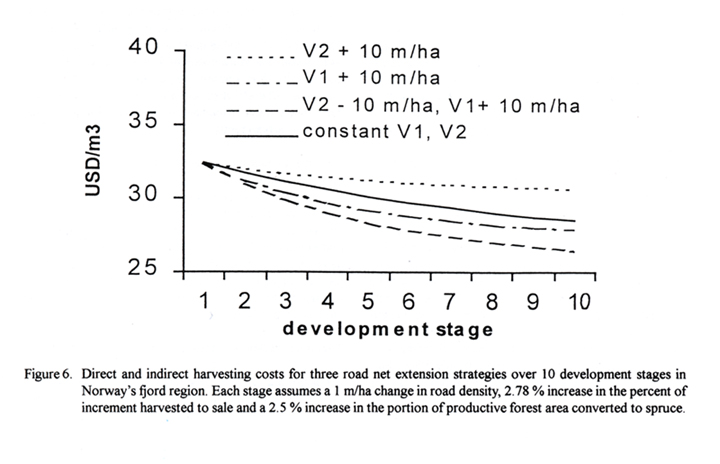
The above results build upon today�s level of road net density. Rising volumes of harvest mature spruce are expected to increase forest owner harvesting activity and further increases in the area of introduced spruce will provide the foundation for investment in a more cost-efficient transport infrastructure. The direct and indirect costs for harvesting at different stages of this development were therefore calculated, for three alternative strategies of road net extension (Figure 6).
The first strategy (A), aiming at a 10 m/ha increase in tractor roads, gave the poorest economic result while the second (B), aiming at a 10 m/ha increase in truck roads, gave a better result. The most cost-effective solution, however, was given by the third alternative (C), which aims at maintaining today�s level of total road density (15 m/ha) with an upgrading of 10 m/ha tractor roads to truck standard. However, since only a portion of the secondary road net is suitable for upgrading, and the most realistic alternative will lie somewhere between the strategies B and C.
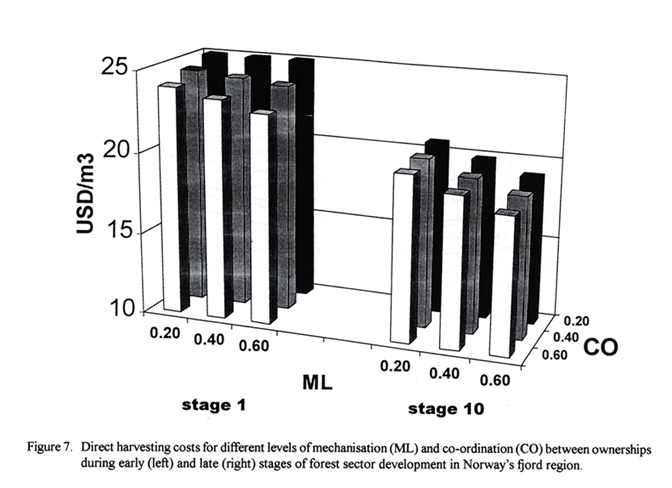
Direct harvesting costs were also calculated for three levels of mechanisation (ML) and co-ordination of harvesting between ownerships (CO = % of ownerships in a cell utilising the same contractor for consecutive operations) during the early (stage 1) and late (stage 10) stages of development. The results, assuming road net extension strategy C, are shown in Figure 7.
The influence of mechanisation upon harvesting costs also varied with the stage of development. Increased mechanisation in today�s situation achieved no clear reduction of direct harvesting costs. However with better co-ordination of harvesting operations, increased mechanisation could achieve a cost reduction of 5-10 %. This reduction would grow to be as large as 25-30 % at a later stage of development where afforestation and infrastructure investments neared their goal values.
Table 3. Direct and indirect harvesting costs in USD per harvested cubic meter for different classes of terrain inclination in Norway�s fjord region.
| 0-20% | 20-40% | >40% | |
| Harvesting (USD/ m3) | 21.3 | 25.4 | 31.8 |
| Roads (USD/ m3) | 4.6 | 6.3 | 10.7 |

Display large image of Figure 5
FIGURE 5. Average wood procurement costs for rising limits for terrain inclination in Norway's fjord region. Two levels of sawmill capacity (m3/yr roundwood consumption) and forest owner harvest activity (upper and lower boundaries indicate harvesting of 25 and 50% of annual increment, respectively.

Display large image of Figure 6
FIGURE 6. Direct and indirect harvesting costs for three road net extension strategies over 10 development stages in Norway's fjord region. Each stage assumes a 1 m/ha change in road density, 2.78% increase in the percent of increment harvested to sale and a 2.5% increase in the portion of productive forest are converted to spruce.

Display large image of Figure 7
FIGURE 7. Direct harvesting costs for different levels of merchanisation (ML) and co-ordingation (CO) between ownerships during early (left) and late (right) stages of forest sector development in Norway's fjord region.
DISCUSSION
Both the behavioural studies of forest owners and efficiency studies of road net extension demonstrated the challenges which terrain poses to sector development in the fjord region. And while the operational efficiency of road network extension decreased in difficult terrain (Table 2) the calculations of average wood procurement costs showed that the least expensive solution was often to accept slightly higher average harvesting costs in return for lower average truck transport costs (Figure 5).
Forest owner decisions
A large number of attitudes and perceptions from the personal interviews were tested for their correlation to harvesting activity. While no decision tree has yet been formulated, basic differences were found in the way certain perceptions were correlated to forest owner behaviour. The main difference was in the way the effects interacted with the forest owner dependence upon timber revenues. Two fundamental types could be identified: barrier- and efficiency-related effects. Barrier-type effects were those that were correlated with reduced harvest activity and included, for example, the perceived difficulty of learning log quality regulations and delivery periods. These had their greatest influence on forest owners with a low dependence upon timber revenues. Efficiency-type effects were those that were correlated with increased activity and included, for example, the perception of low contractor prices. The effect of these increased with increased dependence upon timber revenues. It is primarily these, which this article reports.
Of the 13 factors that were originally identified to be correlated with the perception of terrain difficulty, principal component analysis identified 5 main components. The first component, related primarily to forest operations knowledge, accounted for 21% of variance, and the second component, related primarily to owner�s degree of dependence upon revenues from timber sales, accounted for 12% of variance. Interestingly enough, of all the factors that were examined the single most influential was the interaction between forest owners and local industry.
Forest operations strategies
For ground-based harvesting systems the road net factor for the truck road net (f1) increased with average terrain inclination and its variation within the area (Formula 5). The influence of terrain inclination upon road net factor in many of the study areas may be explained by the length of tractor roads required to gain elevation where their maximum grade is limited by regulated specifications. This explanation is particularly relevant in those areas where tractor roads are built to truck road limits in order to facilitate later improvement to truck road standards, a practice common in afforestation areas. The interaction of average inclination with inclination�s variation may be explained by the increasing degree which microtopography forces forest machines to deviate from the shortest path in steep terrain. The argument for this is that the steeper the terrain is, the closer these systems must follow a path which is perpendicular to contour lines in order to retain stability.
The effects of road net extension upon skidding distances were a result of the road net geometry that is typical for this region. Because of the low truck road density, many truck roads are limited to a primarily length-wise function of gaining elevation and enabling access to remote areas, while tractor roads take over the cross-wise function, collecting timber from the surrounding area and enabling efficient transport to the truck road. The ratio between the road net factor for the entire road net (f1+2) and truck road net alone (f1), increased with the proportion of total road density consisting of tractor roads (Formula 6). This may be explained by two factors: first, the higher wander factor for tractor roads and second, the tractor roads function being primarily length-wise, while having alignment almost perpendicular to the truck roads and thus resulting in a less efficient transport geometry for the total road net.
The observed reduction in road net factor for cable harvesting (Formula 6) is logical given the basic fact that yarding cables travel in straight lines. The limited occurrence of uneven microtopography in steep terrain may also have enabled a straighter road alignment, thereby contributing to the low road net factor and requiring fewer meters of road to penetrate the same distance into the area.
The regional wood chain
This study used average values from the forest owner studies as input variables in a deterministic model of forest operations. Integrating forest owner decision-making directly into the wood chain model could further develop this approach. One way to do this is by equating cost reductions to increased timber prices. The influence of reduced costs upon harvest intensity could then be calculated by applying their effect to price elasticity for timber supply. Another alternative could be to apply the effects of cost reductions to a correlation between real revenues and perceived income dependency. While the validity of such as approach is unexplored, this could be one way of including the more subtle aspects of interaction between forest owners and local industry.
The calculations of wood procurement costs (Figure 5) are based upon two simplified assumptions. The first simplification is as follows: the maximum terrain inclination assumed to be harvested in the model was approximated as twice the average terrain inclination for newly regenerated areas taken from county statistics. The cumulative distribution of annual increment over maximum terrain inclination was then fitted with a linear function which slightly overestimates (by approx. 5 %) the annual growth available in areas under 20 % inclination. County statistics, however, also show that the average inclination of newly harvested areas is slightly less (one-fourth) than the average inclination for the whole forest area. This simplification should, therefore, be acceptable.
The second simplification regards the assumed shape of the wood procurement area around the sawmill. This study assumes a hexagonal shape because this is the form closest to a circle, which theoretically allows 100 % coverage of an area [11, 30]. Since most of the sawmills in the fjord region still have relatively small procurement areas and are located in the inner coastal zone, this assumption should be acceptable. For sawmills with larger procurement areas on the outer coast, however, a half-circle (as represented by a half-hexagon) would be more appropriate. The revision of this assumption would increase the average transport distance, leading to a trade-off between harvesting and transport costs which, in comparison to Figure 5, gives an optimal solution with more harvesting in the steep terrain. Other less geometrically effective procurement area shapes will result in longer truck transport distances, also leading to optimal solutions with more harvesting in the steep terrain.
The ranking of alternative road extension strategies (Figure 6) showed that the reduction of harvesting costs by reduced skidding distances was not always enough to compensate for the increased road construction costs. This is partially because of the high road construction costs in this region (58 and 32 USD per meter for truck and tractor roads, respectively). Another contributing factor is that the cost per ha of these roads may only be partially offset by the higher volume production in spruce stands because of their limited distribution. These results do not, however, detract from the fact that a large proportion of the steep terrain will remain physically inaccessible without a denser road network.
As a final comment, it is important to note that the comparison of the alternative road extension strategies is based upon the average annual incomes and costs for a typical year within the road net�s amortisation period, and not the net present value of all future incomes and costs. Calculated optimums for road density and distribution of standards will vary between assumptions and calculation methods. For a more complete treatment of this subject including planning periods and age distributions see [30].
Concluding remarks
In order to compare European positions with respect to forestry and social development Koch and Rasmussen [15] made a cluster analysis of the production and service objectives for rural and forestry development. Norway, together with Sweden, Finland, and Switzerland were grouped as having primarily production-oriented rural development and forestry development policy orientation.
In Norway, total employment in primary production reached its peak in the 1930�s and employment in secondary production had also peaked by the end of the 1970�s [34]. This is the same pattern as observed in other countries where increased productivity has released labour to secondary production, and subsequent rationalisation in secondary production had made possible further expansion of the service sector [32]. These developments have had consequences for forest operations research. In regions where production functions are still the foremost concern, forest operations research remains focussed on rationalisation and optimisation of machine applications. In regions where population density and alternative income sources are further developed, research has shifted its focus to integrating the forest�s production with service and protection functions. The regional perspective is therefore highly relevant to the role of forest operations in a development context.
Because of the spatial character of forestry activities, they impact employment and social conditions in rural areas and population distribution. This is the main reason why forestry is often viewed as a means to promote desirable social developments [26]. A wealth of theories is now being applied to analyse the relationship between forestry and regional development. The core of this relationship, however, still consists of two basic components: investment decisions and introduction of new technology. While being only one of many alternatives in a pool of analytical approaches, forest operations is one of the few disciplines with a sufficiently detailed knowledge of working processes to examine and predict the dispersal of labour requirement and settlement patterns for varying production forms. Living up to this potential demands that our work extend beyond the forest edge and into the relationships between the wood chain and the society it serves.
ACKNOWLEDGEMENTS
This study was supported by grants from the Norwegian Forestry Development Foundation. The forest owner interviews were done by consultant Haakon Innset. The field work in the study of road net extension was done by consultant Helge Nordby and research technicians Hans Nyeggen and Leif Kjøstelsen. The study plan for road net extension was the result of cooperation with Professor Dr. Ivar Samset.
REFERENCES
[1] Andersen, E.S. 1996. Theories of resource-based growth and development
� from Marshall to new evolutionary economics. In: Hyttinen, P., Mononen,
A. and P. Pelli (eds.) 1996. Regional development based on forest resources
� theories and practices. European Forest Institute Proceedings No. 9:
5-16.
[Return to text]
[2] Dale, Ø., Kjøstelsen, L., Lisland, T., Nitteberg,
M., Sørhagen, O. And A. Winsents 1990. Laboratories- og feltforsøk
med Igland 350 interlock. Norsk institutt for skogforskning Aktuelt Nr.
4/1990. 26 pp.
[Return to text]
[3] Eikebrokk, T. and L. Hem 1997. Forestry logging contractors
and rural development. Electronic proceedings from FORWARD mid-term meeting
. European Forest Institute. 15 pp.
[Return to text]
[4] Eikebrokk, T. and L. Hem 1998. Skogeiere på Vestlandet
� en analyse av aktivitetsvariasjoner som grunnlag for tiltak. Stencil.
Norwegian School of Economics and Business Management. 56pp.
[Return to text]
[5] Fishbein, M. and I. Ajzen 1975. Belief, attitude, intention
and behaviour. An introduction to theory and research. Addison-Wesley.
[Return to text]
[6] Fjeld, D and A.Laukeland 1996. Slepebanelunning på Vestlandet.
Norsk Skogbruk Nr. 2/1996:28-29.
[Return to text]
[7] Fjeld, D., Hem, L. and T. Eikebrokk 1997. Entreprenørenes
framtid i Vestlandsskogbruket. Norsk Skogbruk Nr. 4B/5 1997:54-56.
[Return to text]
[7] Fjeld, D., Hem, L. and T. Eikebrokk 1997. Entreprenørenes
framtid i Vestlandsskogbruket. Norsk Skogbruk Nr. 4B/5 1997:54-56.
[Return to text]
[7] Fjeld, D., Hem, L. and T. Eikebrokk 1997. Entreprenørenes
framtid i Vestlandsskogbruket. Norsk Skogbruk Nr. 4B/5 1997:54-56.
[Return to text]
[8] Fjeld, D. and J. Løvik 1996. Mekanisering på Vestlandet. Norsk
Skogbruk Nr. 4B/5 1996:64-65.
[Return to text]
[9] Fjeld, D., Nordby, H. and H. Nyeggen 1997. Veinettets effektivitet i fjordlandskapet.
Norsk Skogbruk Nr. 9/1997: 81-83.
[Return to text]
[9] Fjeld, D., Nordby, H. and H. Nyeggen 1997. Veinettets effektivitet i fjordlandskapet.
Norsk Skogbruk Nr. 9/1997: 81-83.
[Return to text]
[10] Fjeld, D., Nyeggen, H. and H. Nordby. 1998. Vestlandsskogbruket
-�kostnader kan reduseres 30%. Norsk Skogbruk Nr. 4B/5/1998:10-11.
[Return to text]
[11] Fohlin, P. and M. Silver 1997. Kvantitativa modeller för
lokalisering av sågverk med tillämpning på Norrbottens
län. Institutionen för Industriell ekonomi och samhållsvetenskap.
Luleå Tekniska Universitet Licentiatuppsats 1997:42.119 pp.
[Return to text]
[12] Furuberg-Gjedtjernet, A.-M. 1989. Timber transport with tractors
in Norwegian forest terrain. Agricultural university of Norway Doctoral
thesis 1989:11. 264 pp.
[Return to text]
[13] Hauge, E. 1997. Development of the sawmill industry in Hordaland
county. In: Fjeld, D. (ed.) 1997. COST Action E3 � Forestry in the context
of rural development. Proceedings from the 7th meeting. Aktuelt fra Skogforsk:
Nr. 9-97: 26-27.
[Return to text]
[14] Kärkkäinen, M. 1996. How to develop forest-based
industry. In: Hyttinen, P., Mononen, A. and P. Pelli (eds.) 1996. Regional
development based on forest resources � theories and practices. European
Forest Institute Proceedings No. 9: 65-70.
[Return to text]
[15] Koch, N.E. and J.N.Rasmusen (eds.) 1998. Forestry in the
context of rural development. Final report of COST action E3. Danish Forest
and Landscape Research Institute. 249 pp.
[Return to text]
[16] Lammi, M. 1996. The Forest Cluster - 500 and still swinging.
In: Hyttinen, P., Mononen, A. and P. Pelli (eds.) 1996. Regional development
based on forest resources � theories and practices. European Forest Institute
Proceedings No. 9: 49-64.
[Return to text]
[17] Lammi, M. and P. Rouvinen 1996. A view on Porter�s diamond
model. In: Hyttinen, P., Mononen, A. and P. Pelli (eds.) 1996. Regional
development based on forest resources � theories and practices. European
Forest Institute Proceedings No. 9: 37-48.
[Return to text]
[18] Lewis, J.R., Bates, B.C. and S. Lawrence 1994. Empirical studies of projection:
a critical review. Human Relations Vol. 47 No. 11: 1295-1319.
[Return to text]
[19] Liden, E. 1995. Forest machine contractors in Swedish industrial forestry.
Doctoral dissertation. Swedish University of Agricultural Sciences. Department
of Operational Efficiency Report No. 195. 43pp.
[Return to text]
[20] McGrath, J.E. and D. Brinberg (1983). External validity
and the research process: a comment on the Calder/Lynch dialogue. Journal
of Consumer Research 10 (June):115-124.
[Return to text]
[21] NIJOS 1990. Landsskogtakseringen � Sogn og Fjordane. Norsk Institutt
for Jord- og Skogkartlegging. 112 pp.
[Return to text]
[21] NIJOS 1990. Landsskogtakseringen � Sogn og Fjordane. Norsk Institutt
for Jord- og Skogkartlegging. 112 pp.
[Return to text]
[22] NIJOS 1991. Landsskogtakseringen � Hordaland. Norsk Institutt for
Jord- og Skogkartlegging. 113 pp.
[Return to text]
[23] NIJOS 1992. Landsskogtakseringen � Rogaland. Norsk Institutt for
Jord- og Skogkartlegging. 113 pp.
[Return to text]
[24] NIJOS 1993. Landsskogtakseringen � Møre og Romsdal. Norsk
Institutt for Jord- og Skogkartlegging. 113 pp.
[Return to text]
[25] NOU 1987. Trelasindustrien på Vestlandet. Norges Offentlige
Utredninger 1987: 31. 56pp.
[Return to text]
[26] Opheim, T. 1997. Goals and strategies for forestry and rural development
in Norway. In: In: Fjeld, D. (ed.) 1997. COST Action E3 � Forestry in the
context of rural development. Proceedings from the 7th meeting. Aktuelt
fra Skogforsk: Nr. 9-97: 26-27.
[Return to text]
[27] Samset, I. 1975. Skogterrengets tilgjengelighet og terrengforholdenes
innflytelse på skogtilstanden i Norge. Meddr. Nor. Inst. Skogforsk.
32:1-92.
[Return to text]
[28] Samset, I. 1995. 150 år i forsøksskogen. Rapport Skogforsk
9/95:1-302.
[Return to text]
[28] Samset, I. 1995. 150 år i forsøksskogen. Rapport Skogforsk
9/95:1-302.
[Return to text]
[28] Samset, I. 1995. 150 år i forsøksskogen. Rapport Skogforsk
9/95:1-302.
[Return to text]
[29] Solberg, B. 1988. Choice of technology in less industrialised countries
with particular reference to forestry and sawmilling. Agricultural University
of Norway. Department of Forest Economics. Report No. 3/1988. 328 pp.
[Return to text]
[30] Sundberg, U. and R. Silversides (eds.) 1988. Operational
efficiency in forestry. Volume 1:Analysis. Kluwer Academic Publishers.
219 pp.
[Return to text]
[30] Sundberg, U. and R. Silversides (eds.) 1988. Operational
efficiency in forestry. Volume 1:Analysis. Kluwer Academic Publishers.
219 pp.
[Return to text]
[31] TFO, unpubl. Consultant cost calculations for long-distance truck
transport of logs in western Norway. Transportbrukernes Fellesorgan � avd.
Skog. 6 pp.
[Return to text]
[32] Tykkyläinen, M., Hyttinen, P. and A. Mononen 1997. Theories
of regional development and their relevance to the forest sector. Silva
Fennica 31(4):447-459.
[Return to text]
[33] Vartianin, P. 1996. New perspectives in industrial geography and regional
development theory. In: Hyttinen, P., Mononen, A. And P. Pelli (eds.) 1996.
Regional development based on forest resources � theories and practices. European
Forest Institute Proceedings No. 9: 17-26.
[Return to text]
[34] Vennesland, B. og B. Solberg 1998. Skog og byde-/næringsutvikling.
En litteraturstudie. Stencil. NISK. 45pp.
[Return to text]
[35] Von Segebaden, G. 1964. Studies of cross-country transport distances
and road net extension. Studia Forestalia Suecica Nr. 18/1964. 69 pp.
[Return to text]
[36] Øyen, B.-H. 1997. Growth patterns of Scots pine in western Norway.
Meddr. Skogforsk 1997/47.18:1-24.
[Return to text]