
Display large image of Figure 1
January, 2000, vol.11 no.1
Joseph F. McNeel
West Virginia University
Morgantown, WV, USA
ABSTRACT
Two Madil 046 skyline yarders, rigged as slackline systems and equipped with Ballenger motorized carriages, were studied by field crews from the University of British Columbia - Forest Operations Group for approximately six months at sites on the west coast of Vancouver Island in British Columbia. A continuous turn element time study, using handheld data recorders was employed to collect data throughout the study. Mean cycle times for the two operations ranged from 11.5 to 13.5 minutes per cycle. Delays contributed at least 20 percent of the cycle time for both operations and were primarily caused by carriage related problems. Average piece size differed by more than 56 percent and created significant differences in overall system productivity. While average cycle time for the two systems differed by at least two minutes, the system with the longer cycle time had higher mean production due to the larger volume per piece and per cycle. The study results strongly suggest that maximizing volume per cycle is critical to maintaining productivity and minimizing costs, even though cycle time may be increased. In this case, one system was able to capitalize on larger average piece size to significantly improve hourly production, even though cycle times for this yarder were higher. More effort is needed during operations to monitor volume (or weight) per cycle and consistently maintain the maximum volume per cycle for existing conditions.
The author is the Director, Division of Forestry, College of Agriculture and Forestry,
INTRODUCTION
Although longline yarding was common on the coast of British Columbia at the turn of the century, this approach to yarding operations has declined in use, due to high manpower requirements and efficiencies available through other systems, such as the grapple yarder [Conway, 1986; Howard, 1991]. However, longline yarding has recently received more attention in the coastal region of British Columbia, due in part to the environmental advantages associated with its use [Milroy, 1991]. Longline yarding systems are well suited for harvesting operations on sensitive sites where roads or backspar trails are either impractical or potentially detrimental to the site. Because these systems can reach well beyond the maximum yarding distance of conventional grapple yarders, they are particularly well suited for use in the undeveloped mountainous terrain common to coastal British Columbia.
Longline systems generally reduce road building requirements and minimize the environmental impacts common to other harvesting systems, while maintaining high productivity and reasonable extraction costs [Peters, 1973; Hemphill, 1991; Letourneau and Rahn, 1997]. Modern longline systems are relatively new to British Columbia and their potential is not well quantified under conditions common to the coastal region where many have been placed into service. Concerns over productivity, stand and site effects, and other factors have encouraged further study of these systems under actual field conditions.
This study, conducted by the University of British Columbia - Forest Operations Group, evaluated two longline systems operating in the Franklin River Division of MacMillan Bloedel Limited near Port Alberni on Vancouver Island, British Columbia, Canada. Two Madill 046 yarders configured as slackline systems and equipped with similar radio-controlled, self-clamping Ballenger carriages were subjected to a long-term study with the following objectives:
1) Define and compare productivity levels of two similar yarders operating on similar sites through detailed timing study, and
2) Determine, through predictor models developed from the timing study, what effect changes in the operation would have on productivity for these two machines.
METHOD OF ANALYSIS
Yarding operations were subjected to time and motion studies on three sites over a five-month period. Timing operations were conducted using hand-held computers programmed with a continuous timing program specifically designed to measure elemental yarding times and record the data in DOS-based files for later analysis.
Site Conditions
Site conditions were similar in all cases. The timber on each of the three sites was mixed old-growth comprised of western hemlock (Tsuga heterophylla), Douglas-fir (Pseudotsuga menziesii), and western red cedar (Thuja plicata) in varying concentrations. Terrain conditions were common for the region, with steep slopes that ranged from 40 to 100 percent on each site. Piece size varied substantially between sites with average piece size ranging from 1.6 m3 to 2.6 m3. Falling and bucking operations had been completed on all sites prior to the study. Both sites were harvested using even-age silvicultural management that emphasized clearcut harvesting.
Machine Characteristics
The yarding was conducted with two Madill 046 slackline yarders mounted on rubber tire carriers and manufactured by S. Madill Logging Equipment of Kalama, Washington. This type of yarder is equipped with three yarding drums; a skyline, a mainline, and a haulback drum. Line sizes, capacities, and line pull estimates for the 046 are summarized in Table 1. The carriage used in the study was the Ballinger self-clamping carriage.
Table 1. Approximate line length, line speed, and line pull characteristics of the Madill 046 skyline skidders under study1.
| Drum | |||
| Item | Skyline | Mainline | Haulback |
| Line Size (mm) | 38 | 29 | 25 |
| Line Capacity (m) | 488 | 600 | 1200 |
| Line Speed (m per min) (Bare drum - Hi spd) |
316 | 455 | 667 |
| Line Pull (kg) (Bare drum - Low spd) |
31,980 | 20,485 | 15,168 |
| 1Source: S. Madill, Inc. Kalama, Washington | |||
Both machines operated in an uphill yarding configuration with adequate deflection. Each system was rigged as a live skyline, where the skyline may be lowered or raised as needed to improve clearance. A maximum of three chokers per cycle was used for both systems throughout the study.
Each machine incorporated a crew of seven. These included a hooktender, rigging slinger, yarder engineer, landing chaser, and three choker setters. The rigging slinger would assist the choker setters as needed, but typically, these three individuals had the primary responsibility for setting chokers during the study. Chokers were not pre-set during the study.
The carriage used with both machines was the Ballinger radio controlled, hydraulically driven carriage weighing approximately 2131 kg. The tongline drum contains approximately 300 meters of 22 mm diameter tongline. Logs can be yarded laterally to the carriage while the carriage is simultaneously being hauled back to the landing, reducing lateral yarding time in clearcut operations.
All yarding was laid out using a fan-shaped configuration as defined by Binkley [1965], with yarded logs being deposited at a central landing located above the harvested site. A haulback line was required for all settings in the study. In most cases the tension in the skyline was reduced prior to setting the chokers, reducing the amount of time required to lower the empty tongline. After the logs had been choked, or attached to the tongline, the skyline and tongline were raised simultaneously. This reduced the amount of time required to lower the tongline, but made it difficult to completely separate lateral yarding times from inhaul times.
Data Collection and Analysis
Observations of cycle elements, components of the total yarding cycle, were collected using handheld computers that timed each cycle element separately and automatically recorded the elapsed time and associated variable(s) for later downloading to a micro-computer. A computer-based statistical package was then used to develop descriptive statistics and to conduct regression analyses on the elemental times.
Productive cycle elements included Outhaul, Lower Tongline, Choke, Raise Tongline, Raise Skyline, Inhaul, Unhook, and Deck. Non-productive elements, those operations that do not contribute to productivity, included Move and Delays. Details regarding the sequence of operations assigned to each cycle element are available from the author.
Each data set was subjected to statistical analysis. Regression analysis was used to identify statistically significant relationships between elemental times and independent site variables collected in conjunction with the timing study.
Total cycle time equations, or models, were constructed using elemental regression equations where possible. Observed means were used for those elements where no regression equations could be obtained. These total cycle time models were used to predict production over scheduled time and to evaluate the effect of different variables, such as volume per cycle and outhaul/inhaul distance, on productivity for these yarders across different site and stand conditions.
No costing information was developed for the study. A machine cost of $400 (US) per scheduled hour was assumed for the cost analyses. This cost information is just an assumed cost used in the example and was not based on any observations.
RESULTS
Table 2 details statistics for the independent variables associated with the study of the two yarders. Moderate variations were noted in the values of most of the independent variables. However, the piece size for logs yarded with Yarder A averaged 56 percent larger than for logs yarded with Yarder B.
Table 2 - Summary of observations for independent variables in the study.
| Independent Variable |
Number | |||
| Mean | Std. Dev. | of Obs. | Range | |
| Outhaul Distance (m)1 | ||||
| (Yarder A) | 256 | 104 | 120 | 58-440 |
| (Yarder B) | 206 | 78 | 483 | 15-385 |
| Inhaul Distance (m)1 | ||||
| (Yarder A) | 239 | 109 | 103 | 50-470 |
| (Yarder B) | 203 | 78 | 453 | 15-420 |
| Vertical Distance (m) | ||||
| (Yarder A) | 30 | 12 | 121 | 6- 55 |
| (Yarder B) | 27 | 12 | 471 | 1- 66 |
| Lateral Distance (m)1 | ||||
| (Yarder A) | 15 | 7 | 172 | 5- 35 |
| (Yarder B) | 12 | 6 | 389 | 4- 35 |
| Pieces Per Cycle | ||||
| (Yarder A) | 2.8 | 1.2 | 184 | 1 - 6 |
| (Yarder B) | 3.0 | 1.2 | 434 | 1 - 8 |
| Piece Size (m3)2 | ||||
| (Yarder A) | 2.5 | N/A | ||
| (Yarder B) | 1.6 | N/A | ||
1 Horizontal Distance
2 Piece size data was obtained from MacMillan Bloedal Research Division
Delays associated with carriage failure or breakdown were substantially greater for Yarder A (Table 3). While no exact method exists for determining the cause of this higher proportion of delays from field data, it should be noted that both crews and the maintenance staff had little experience with longline systems, generally increasing downtime for both yarders when mechanical problems were encountered.
Table 3 summarizes the mean elemental times observed from the data. In comparing the elemental times for the two yarders, substantial differences were observed for Outhaul, Lower Tongline, Choke and Raise Tongline times. Generally, the observed times for these productive elements differed only slightly during the study, but high variability did exist for the time elements Outhaul, Lower Tongline, Raise Tongline, Deck, and the non-productive elements Delay and Move.
Delay time, defined as the unscheduled interruption of the productive cycle, was derived from intermittent observations of the delay element. The maximum observed delay for Yarder A was 336 minutes and, for Yarder B, the maximum was 223 minutes. The mean delay per occurrence for Yarder A was 4.7 minutes with a standard deviation of 14.6 minutes, while Yarder B had a mean observed delay time of 3.6 minutes with a standard deviation of 15.2 minutes. Much of the additional delay associated with Yarder A was directly related to carriage breakdowns and repairs. A total of 143 delays were observed for Yarder A and 323 delays were observed for Yarder B. When converted to a per cycle basis, the means and standard deviations are as presented in Table 3.
TABLE 3. Summary of mean time elements
| Timing Element | Mean Time per Cycle (min) | Std. Dev. (min) | Number of Observations |
| Outhaul | |||
| (Yarder A) | 0.798 | 0.324 | 123 |
| (Yarder B) | 0.676 | 0.222 | 492 |
| Lower Tongline | |||
| (Yarder A) | 1.260 | 0.637 | 124 |
| (Yarder B) | 0.903 | 0.468 | 485 |
| Choke | |||
| (Yarder A) | 4.067 | 2.022 | 179 |
| (Yarder B) | 3.988 | 1.645 | 397 |
| Raise Tongline | |||
| (Yarder A) | 0.528 | 0.420 | 192 |
| (Yarder B) | 0.344 | 0.182 | 898 |
| Raise Skyline | |||
| (Yarder A) | 0.107 | 0.288 | 180 |
| (Yarder B) | 0.083 | 0.180 | 481 |
| Inhaul | |||
| (Yarder A) | 1.237 | 0.442 | 77 |
| (Yarder B) | 1.223 | 0.436 | 457 |
| Unhook | |||
| (Yarder A) | 0.888 | 0.373 | 185 |
| (Yarder B) | 0.900 | 0.386 | 445 |
| Deck | |||
| (Yarder A) | 0.238 | 0.648 | 180 |
| (Yarder B) | 0.191 | 0.327 | 481 |
| Total Productive Cycle Time (production minutes): | |||
| (Yarder A) | 9.123 | ||
| (Yarder B) | 8.308 | ||
| Delay 1 | |||
| (Yarder A) | 3.697 | 11.560 | 180 |
| (Yarder B) | 2.427 | 10.202 | 481 |
| Move 1 | |||
| (Yarder A) | 0.520 | 6.977 | 180 |
| (Yarder B) | 0.237 | 8.373 | 481 |
| Total Scheduled Cycle Time (scheduled minutes) | |||
| (Yarder A) | 13.340 | ||
| (Yarder B) | 11.392 | ||
1 Non-Productive Time (minutes)
Move times, times associated with moving the tailspar to a new yarding path or road location, were derived in a manner similar to delay times. The maximum move time for Yarder A was 94 minutes, while Yarder B had a maximum move time of 211 minutes. The mean move time for Yarder A on a Aper cycle@ basis was 0.52 minutes with a standard deviation of 7.0 minutes, while Yarder B averaged .65 minutes per cycle with a standard deviation of 8.4 minutes (Table 3). Only eight observations were made of move time during the detailed timing study and times were highly variable.
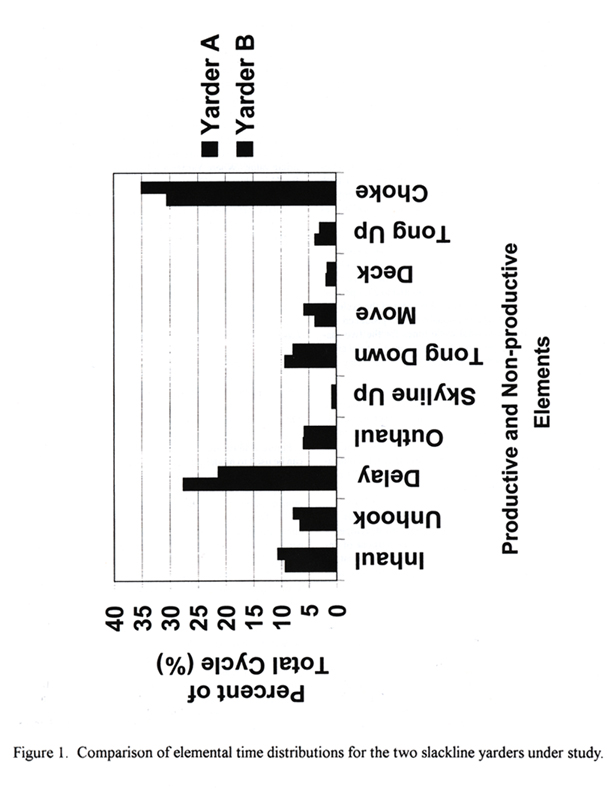
A comparison of the distribution of the elemental times for the two machines is provided in Figure 1. For both machines, the elements comprising the largest percentages of total cycle time were the choke and delay elements.
The choke element for Yarder A contributed approximately 30 percent of the total cycle time, while the choke element for Yarder B comprised 35 percent of the total cycle time. The delay element contributed to 27.7 percent of the cycle for Yarder A and 21.3 percent of the cycle for Yarder B. As indicated previously, delays produced significant differences in total cycle times for the two machines. At least 65 percent of the difference in total cycle time for the two machines is attributable to the delay element.
Further illustration of the impact of delay on machine productivity is indicated when estimating machine utilization rates. When delay time is combined with the other non-productive component, Move, the average utilization rate for Yarder A is 68 percent. In contrast, the utilization rate for Yarder B during the study averaged 73 percent, a difference of 6.6 percent.
In most studies, regression or predictor models are unique to the machine for which they are developed - which limits the utility of the model. The purpose of developing these models is to produce a single equation that can predict total cycle time for a given machine with some level of accuracy.
To minimize the need for separate elemental models, statistical testing using chi-square distribution tests was used to determine if data could be pooled to produce a single model for both machines. Pooling was possible in all but one case (Lower Tongline) and most of the models for elemental times provided in Table 4 can be used to predict times for either machine. Where the data could not be pooled, a dummy variable was incorporated to separate the models. Regression models were developed for the elements Outhaul, Lower Tongline, Choke, Inhaul, and Unhook.
All other cycle elements were found to be statistically unrelated to the independent variables collected during the study and no regression model could be developed for these cycle components. In these cases, mean times were the best estimators of elemental times and were used to estimate four elements; Raise Tongline, Deck, Delay, and Move. The mean values presented in Table 4 also incorporate dummy variables to allow rapid estimation of the mean time to complete an element of the yarding cycle regardless of which machine is being analyzed. In those cases where Yarder B is analyzed, the dummy variable, Z1, is set to one (1) to adjust the estimated time to the appropriate value. Where Yarder A is being analyzed, the value for Z1 is set to zero (0).
Total cycle times in scheduled minutes for either Yarder A or B can be predicted using the equation presented in Table 4. The following variables are used to estimate total cycle time:
| Dist | = | Horizontal distance in meters from the yarder to the point in the field where logs are to be choked, |
| Latdist | = | Lateral horizontal distance in meters between the point where the tongline drops from the carriage to the logs being choked, |
| Vdist | = | Vertical distance in meters between the suspended carriage and the ground, |
| Pieces | = | Number of pieces being choked during the cycle. |
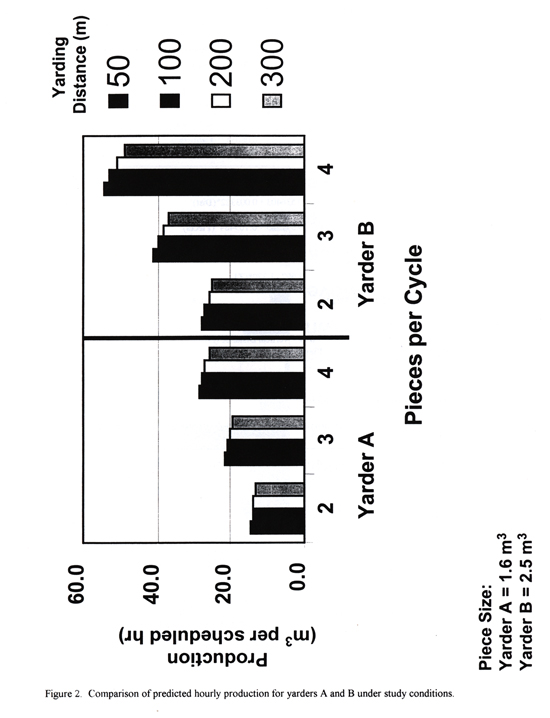
Figure 2 illustrates how the total cycle time equation can be used to model yarding productivity over a range of operating conditions for either machine. The model provides production estimates based on changes in distance, number of pieces and changes in the average volume per cycle. Distance was ranged from 50 to 300 meters, the number of pieces varied from 2 to 4 per cycle, and volume per piece was assumed to equal the average observed values of 2.5 m3 for Yarder A and 1.6 m3 for Yarder B. Thus, the range of volumes analyzed for each model differed slightly, with Yarder A having, on average, larger volumes per cycle.
A comparison of the graphed production rates indicates that the larger loads per cycle for Yarder A significantly improved production per scheduled machine hour. Therefore, increasing the volume per cycle within the limits of the yarder and the carriage will substantially improve yarding productivity. This could be accomplished in several ways, including the use of different bucking strategies that would produce greater volume in each piece, or by increasing the number of pieces removed in each cycle.
Display large image of Figure 1
Figure 1. Comparison of elemental time distributions for the two slackline yarders under study.

Display large image of Figure 2
Figure 2. Comparison of predicted hourly production for yarders A and B under study conditions.
TABLE 4. Regression models to predict elemental times associated with two slackline yarders.
| Element | Model | R2 | |
| Outhaul: | 0.365052 + 0.001576*(Dist) | 0.302 | |
| Lower Tongline: | 0.705177 + 0.01836*(VDist) - 0.011080*(Z1*VDist) |
0.125 | |
| Choke: | 3.005095 + 0.080542*(Latdist) | 0.079 | |
| Raise Tongline: | 0.528490 - 0.18430*(Z1) | N/A | |
| Inhaul: | 0.536403 + 0.003322*(Dist) | 0.404 | |
| Unhook: | 0.571783 + 0.109484*(Pieces) | 0.126 | |
| Deck: | 0.238 - 0.047*(Z1) | N/A | |
| Delay: | 3.697 - 1.270*(Z1) | N/A | |
| Move: | 0.520 + 0.137*(Z1) | N/A | |
| ________________________ | |||
| Where:
Dist = Horizontal Distance (m) LatDist = Lateral Distance (m) Z1 = Dummy Variable1 |
VDist = Vertical Distance (m) Pieces = Number of Pieces (m) |
||
| Total Scheduled Cycle Time (scheduled minutes): | |||
| TC = 10.167 = 0.00490*(Dist) - 0.011080*(Z1*VDist) + 0.080542*(Latdist) + 0.109484*(Pieces) - 1.18*(Z1) | |||
1 Dummy Variable: If evaluating for Yarder B, then set Z1 equal to 1, otherwise set Z1 equal to 0
Further, the results graphed in Figure 2 indicate that Yarder A, even with similar cycle times, produced 46 percent more volume per cycle. If Yarder B could have attained these higher cycle volumes, the hourly production for these two machines would have been roughly equivalent. Instead, the modeled production suggests that Yarder A was able to generate approximately 37 percent more volume per scheduled machine hour under the studied site conditions. While the observed difference was due principally to the larger piece volumes yarded by Yarder A, the results do suggest that yarding payloads are rarely maximized in stands where average piece size is small. Where yarding equipment comprises a significant component of harvesting costs, as in the case with longline yarders, yarder payload should be a major concern.
The cost effectiveness of increased payload may be illustrated in the following example using the study data. Assume that ownership and operating costs for the two Madill 046 yarders averages $400 per scheduled machine hour and that all other factors in the example systems are similar. The only difference from a production standpoint is the difference in machine cycle time and machine hourly production as observed in the study. Based on the noted differences, the cost per cycle ranges from $89 for Yarder A to $75 for Yarder B. However, payload differences would yield an additional 6.2 cubic meters of wood per hour for Yarder A. The added cost of yarding this additional volume per scheduled hour with Yarder A averages less than $14 or $2.25 per m3. Further, this load weight can be achieved in most settings where proper engineering and layout provides adequate deflection for yarding operations.
CONCLUSIONS
These study findings suggest that the cycle times for the two Madill 046 slackline machines, when using the same type of carriage and on similar sites, are relatively equal. Productive cycle times measured for the two machines on similar settings in the Franklin River region were within 0.8 minutes of each other, with the difference in time generally attributable to differences in observed times for the Lower Tongline and Delay elements.
Study results suggest that reduction in cycle time may be possible if efforts are focused on minimizing delays. Through improvements in preventive and emergency maintenance activities, delays may be significantly reduced and corresponding improvements in productivity may be possible. However, the study also shows that longer cycle times are not necessarily bad, if volume per cycle can be increased to offset these higher cycle times.
In any yarding operation, significant effort should be made to maximize payload. With longline systems, where cycle times often average more than ten minutes or more per cycle, the effect of reduced payload can lead to substantial added costs. Neither of the machines in this study was equipped with a tension meter to measure payload weight relative to the maximum allowable weight for existing conditions. Nor was there any effort to increase the number of chokers used per cycle to increase payload, even on sites where average payload was known to be below the maximum.
Differences in volume per cycle resulted from differences in the number of pieces yarded per cycle and the piece size of yarded logs. Regardless of these site-related differences, the model results suggest that these machines are capable of yarding substantially larger volumes per cycle than was observed for Yarder B. More emphasis should be placed on maximizing the volume per cycle, as under-utilization of the yarder will lead to lower production and higher costs.
Cost estimates based on the developed regression equations suggest that even minor differences in yarded load weight will substantially affect delivered wood costs. With these longline yarders, even small changes in productivity can affect the profitability of the harvest operation. In cases where these systems might be used for partial harvests, yarded load weight will be an even more critical factor and must be maximized to insure reasonable wood costs.
The combined regression model developed for these machines is applicable within the limits of the data provided and should prove useful for operational planning, scheduling, and estimating production on western coastal sites. While longline systems may also prove useful in partial harvests, the developed models should not be considered accurate for predicting the productivity and cost of longline systems in this type of harvest.
LITERATURE CITED
[1] Binkley, V. 1965. Economics and design of a radio-controlled
skyline yarding system. USDA Forest Service, Pacific Northwest Research
Station, Seattle, WA. Research Paper PNW-25. 30 p.
[Return to text]
[2] Conway, S. 1982. Logging Practices: Principles of Timber Harvesting
Systems. Miller Freeman Pub., San Francisco, CA. p. 198.
[Return to text]
[3] Hemphill, D. 1991. Successful applications of skyline
logging in British Columbia. IN Forest operations in the 1990s;
Challenges and solutions - Proceedings of the 14th Annual Meeting of the
Council on Forest Engineering. July 22-25, 1991, Nanaimo,
B.C. pp. 89-91.
[Return to text]
[4] Howard, A.F. 1991. Production equations for grapple
yarding in coastal British Columbia. Western Jrnl Applied For. 6(1):7-10.
[Return to text]
[5] Letourneau, L. and D. Rahn. 1997. Back to the future.
Business Logger. 7(9):34-37.
[Return to text]
[6] Milroy, R. 1991. A giant in the woods. Canadian
Forest Industries, April, 1991. pp. 9 - 10.
[Return to text]
[7] Peters, P. 1973. Estimating production of a skyline
yarding system. IN Planning and decision making as applied to forest
harvesting: A Symposium. September 11-12, 1972. School of Forestry,
Oregon State University, Corvallis, Oregon. pp. 7-14.
[Return to text]