
Display large image of Figure 1
Vol. 11 No. 2 July 2000
Bruce Hartsough
University of California
Davis, CA USA
Raffaele Spinelli
Wood Research Institute
Florence, Italy
Steve Pottle
Boise Cascade Corporation
Wallula, WA USA
John Klepac
US Forest Service Southern Research Station
Auburn, AL USA
ABSTRACT
This study determined how much wood was potentially available from short rotation hybrid poplar, and how much was actually recovered when trees were delimbed and debarked with chain flails and chipped. 31 groups of five trees each were measured and then processed.
For trees larger than 50 kg total dry weight, potentially recoverable wood averaged 75% of total weight. Over 95% of this wood was converted into chips. Losses due to breakage by the flails, which show up in the bark discharge, amounted to 0.8 dry kg per tree and were relatively independent of tree size. Chipper reject wood losses averaged 2.3 dry kg per tree, but increased in almost direct proportion to tree size, from 1.2 kg for 50 kg trees, to 3.2 kg for 120 kg trees.
For trees less than 50 kg total dry weight, potentially recoverable wood fraction was highly variable _ from 50 to 75% of total weight. Because of breakage of small stems by the flail, wood recovery was also relatively low, ranging from 40 to 95%. Most of the wood loss for smaller trees showed up in the bark discharge rather than as chipper rejects.
For larger trees, the chipper rejects represent the biggest opportunity for improving the recovery of wood fiber. Sharp chipper knives appear to be important for minimiz ing losses. Beyond that, it is not clear whether wood in the chipper rejects is the result of bole damage by the flail or chipper design characteristics.
Keywords: Short rotation forestry, wood losses, processing.
The authors are Professor, Biological and Agricultural Engineering; Head, Harvesting Research Group; Fiber Farms Harvesting Supervisor; and Research Engineer, Harvesting Research Project.
INTRODUCTION
Chain flail delimbing and debarking has proven to be the most popular means of separating residues from high-quality wood chips for trees grown on short rotation (less than 10 years) in western North America. This contrasts with the situation in the eastern US. There, woodrooms and satellite chipping mills are equipped with drum debarkers for processing the small trees that contribute a large fraction of the fiber supply. On the west coast, pulp mills have traditionally relied on sawmill residues derived from slabs and reject lumber, so no debarking facilities were required at the pulp mills.
Flails can effectively handle smaller trees simultaneously, and can reduce bark levels in chip furnish to less than the one percent specified by many pulp mills. There have been concerns about loss of white wood fiber caused by flails (as well as by other means of processing small trees, notably irongate delimbing and drum debarking). The "blunt force trauma" approach ¾ the basis for wood-bark separation by chain flails ¾ can in theory result in wood loss by breaking sections of white wood into chunks too small to reach the chipper.
Numerous studies have investigated the production rates of flails and/or the quality of the chips produced, including bark content [1,4,7,17]. Several studies have reported on chip yields as percentages of total material in when processing trees with flails [11,13,14,15]and two have compared yields for a number of harvesting systems, including those using flails at roadside [8,16]. Only one of these explicitly looked at yield as a function of tree size, and it found that the BDU output of chips per cubic meter of stem volume increased with tree diameter [2]. This study considered spruce and pine, with DBH apparently ranging from about 5 to 20 cm. Only a few studies have looked at how much useful wood fiber (versus bark, branches and foliage) is lost in the flailing process. One reported losses in the range of about 3 to 5% [10]; a second reported losses on the order of 3 percent for sugar maple and yellow birch averaging about 70 kg total dry weight [12]. We are not aware of any previous published studies of fiber loss with short-rotation hardwoods.
Objectives
The objectives of the study were to:
APPROACH
The trials were conducted in one of Boise Cascade's hybrid poplar plantations south of Boardman, Oregon, from 14-19 October 1998. Temperatures during this period ranged from _4 to 19 degrees C (daily averages ranged from 6 to 12 and averaged 9), daily average wind speeds from 1 to 4 m/s (averaging 2), and dew point temperatures from _2 to 3 degrees C (average 2). The fall timing was selected so that drying of materials between processing, weighing and sample collection would be minimal. Since the percentage yield of chips and the recovery percentage were expected to increase with tree size, stems of similar size were tested together. Trees less than or equal to 15 cm DBH were measured on the 14th, while larger trees were measured on the 15th, 16th and 19th. On the 14th, trees were processed almost immediately after felling. Because the trials slowed the processing operation, trees tested on later days had been on the ground for up to three days.
Trees were cut by a feller/buncher and forwarded to the landing with a front-end loader in the normal operational manner. At the landing, individual trees within the day's diameter specification were selected at random from the turns and measured. Total length (to nearest 2.5 cm), DBH (nearest 0.25 cm) and total green weight (nearest 0.5 kg) of each tree were measured with a tape measure, diameter tape and pair of electronic load scales, respectively. The scales were supported on stands so that the branches of the tree being weighed did not touch the ground.
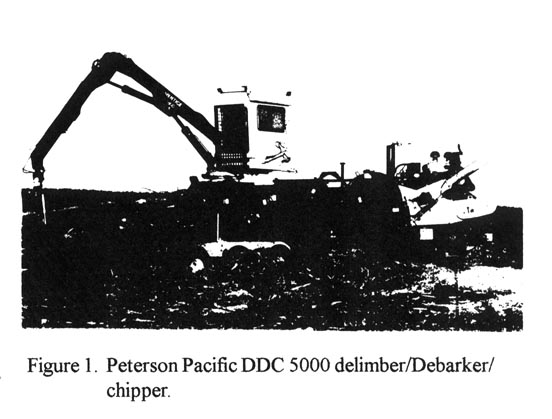
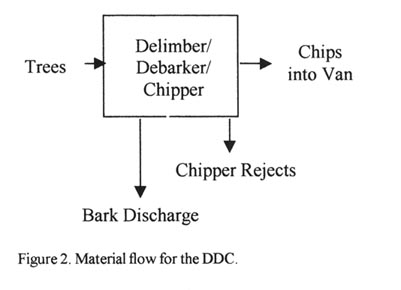
Groups of five measured trees were processed by a Peterson Pacific DDC 5000 equipped with a 600 kW engine (Figure 1). Groups rather than single trees were tested because multiple stems are normally processed together to maximize production. (In normal operations, new groups of stems are fed in while the previous batch is still being processed, which spreads the flail energy over more stems. We did not do this, so our results may be biased, but we feel the differences are relatively small.) The DDC was configured with the specifications normally used to obtain the standard required bark content of one percent in the chips going into the van. The three flail drums were each equipped with 42 chains, with 8 oval links of 16 mm material diameter and 41 mm inside pitch per chain. Flails #1 (in front and on the bottom) and #2 (on the top) were run at 576 rpm (85% of their maximum speeds), and flail #3 (in back and on top; the chains on this drum sweep opposite the direction of tree flow) at 334 rpm (35% of its maximum). Feed speed of the chipper was 0.56 m/s. The flow streams into and out of the DDC are shown in Figure 2.
Figure 1: Peterson pacific DDC 5000 delimber/Debarker/chipper.
Display large image of Figure 1
Before a group of measured trees was processed, the DDC was shut down, all residues were removed from within the flail and bark discharge path, and residues on the ground were cleared away from the bark discharge outlet and chipper reject spout. Then two tarps were placed to capture all materials from the discharge outlet and reject spout. After each group of five measured trees was processed, the DDC was shut down and all residues were again removed from within the unit and added to those on the bark discharge tarp.
Figure 2: Material flow for the DDC.
Display large image of Figure 2
The material from the bark discharge was separated into two categories:
a) potentially recoverable white wood, i.e. pieces
from sections of the tree that were at least 5 cm in
diameter under bark, and
b) all other material: bark, foliage, and all sections of
the bole and branches less than 5 cm in diameter
inside bark. For conciseness, this other material is
called "bark."
The 5 cm diameter break was somewhat arbitrary, but was considered reasonable because it is practically impossible to recover the small diameter material with any mechanized delimbing and debarking methods.
Hand-held scrapers were used to separate intact bark from the sections of white wood.
The chip rejects were also separated into white wood and bark components. Each of the four residue components (bark discharge wood, bark discharge bark, chip reject wood, and chip reject bark) was weighed on a platform scale (to the nearest 0.1 kg), and a representative sample of each was placed in a ziploc plastic bag for bone dry content determination. Separation, weighing and sampling were completed within an hour of processing each group of trees.
Immediately after a group of test trees was chipped, a sample of chips was collected from the van and bagged for bone dry content analysis. Bark contents were evaluated by operational sampling of material from each van when it arrived at the pulp mill.
In addition to typical experimental errors, there were three possible sources of bias error associated with the delimbing/debarking/chipping process: 1) Some limb and top (bole<5 cm in diameter) material probably does get chipped and therefore inflates the total recoverable wood and recovery percentage based on the 5 cm bole specification. 2) Some residues may "leak" from the flail through small gaps in housings that allow material to drop to the ground beneath the DDC. 3) Fine materials leaving the chip reject spout may be blown off of the collection tarp.
We assume that the first is the largest error, but estimate it to be less than a tenth of a percent of total tree weight.
Bone dry (BD) contents were determined by oven drying of approximately 600 g (green) portions of each bagged sample. Green and dry weights were measured to the nearest gram.
After all the data were available, dry weights of each component were calculated. First, green weight of chips into the van was calculated by subtraction: green tree weights in less residue weights out. Then the operational bark content was used to calculate green weights of clean chips and bark. Green weight of each component was multiplied by the respective bone dry percentage to obtain dry weights. Dry weights of the wood in the two residue streams were added to that of clean chips to find total potentially recoverable wood.
Appropriate statistical analyses (t-tests and regression) were used to evaluate the data.
RESULTS
Thirty-one groups of five trees each were tested over the span of four operating days. Data on one group was excluded because the lower flail broke down while the trees were being processed, resulting in abnormally low separation of bark from wood.
Bone Dry Contents of Wood
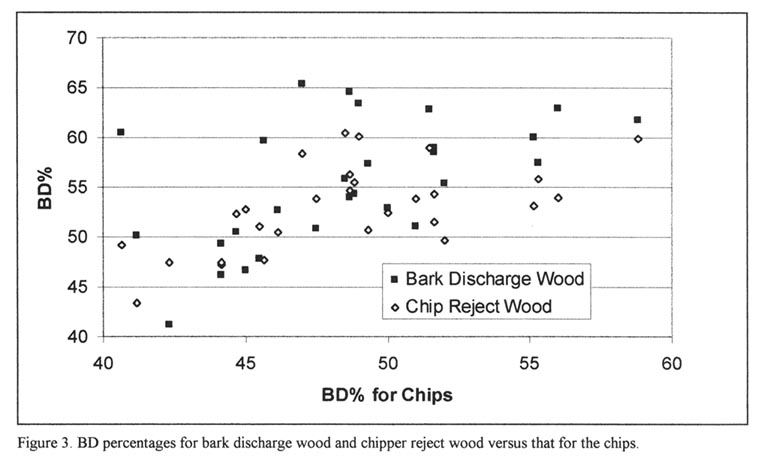
Paired t-tests showed that the BD percentages of the bark discharge wood, chip discharge wood and chips were all significantly different, with the bark discharge BD% > chip discharge BD% > chip BD%. The BD percentages for all wood components were, in general, simultaneously high or low (Figure 3), and in almost all cases were higher for the discharge materials than for the chips. More of the bark discharge material is from the outer and upper parts of the tree, while clean chips are weighted to the innermost portion. Drying between felling and processing would affect the outer and uppermost sections first. Also, the chipper rejects tended to be oversize slivers from the periphery of the bole, which would dry faster than the interior of the tree.
If air-drying of chipped material was significant, smaller material with higher surface-to-volume ratio would dry faster. Since the smaller chip discharge material had lower BD% than the chunks from the bark discharge, the results suggest that drying during the hour between processing and bagging of the samples must not have been a big factor. The chips were sampled immediately after chipping, so no significant drying would have taken place.
There was a lot of tree-group-to-tree-group variability in the BD percentages for each type of material. For example, the BD content for chips ranged from 39 to 59%, and the calculated BD values for the whole trees ranged from 42 to 58%. The variability may have been related to moisture differences between tree sizes, or by a moisture gradient within the stand. We doubt that it relates to dry
Figure 3: BD percentages for bark discharge wood and chipper reject wood versus that for the chips.
Display large image of Figure 3
ing between felling and processing, because other work in the same plantation indicates that BD percentages of felled trees increase by only about a percent per day in early fall.
Bark Contents
Estimates of bark contents in the chip vans were highly variable. The operational samples taken at the mill (five samples for each of the four days) from the same vans ranged from 1.4 to 7.1% and averaged 2.7%. The variability in both sets of samples probably reflects the small sample size rather than operational differences. There were no significant differences between the means of the operational bark contents for each of the four days, so the overall average of 2.7% was used. This value _ higher than the desired 1% - could be reduced by running the flail at higher speed, reducing the number of trees fed per group, or by slowing the feed rollers.
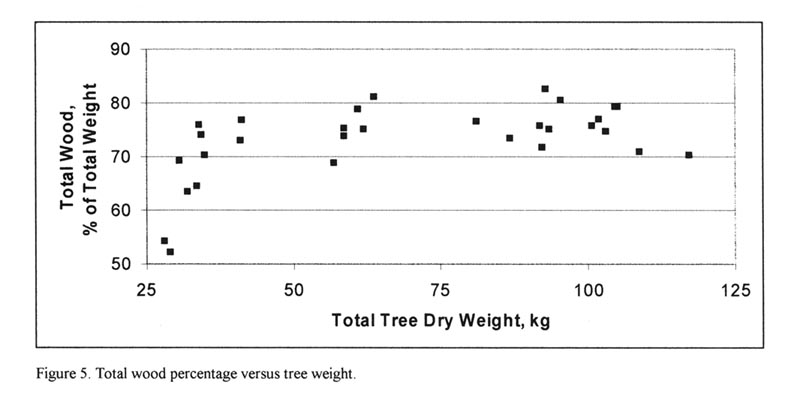
Wood Potentially Available
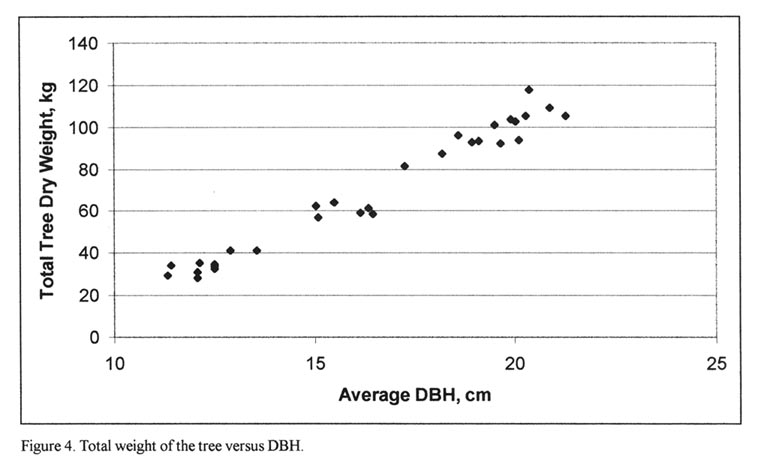
Figure 4 shows the total dry tree weight by diameter, and Figure 5 shows the total wood available per tree _ as a percentage of total tree weight — over the range of total dry tree weight. As was expected, the proportion of wood in the trees increased with tree size at the low end of the size range. For the larger trees (50 kg and up), total wood averaged 75% of total tree dry weight.
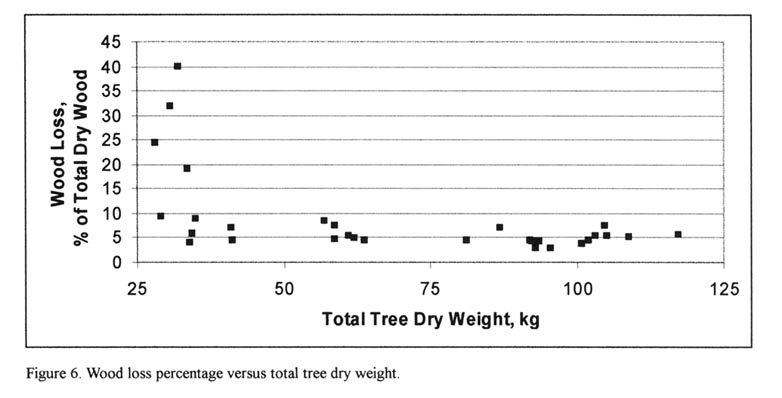
Wood Recovery and Losses
For all the test trees, over 95% of the potentially available wood made it into the chip vans. Wood loss percentage was highest for the smallest trees, but roughly a constant 5% for trees larger than about 50 kg (Figure 6). Proportionally more wood is wasted by the flail when it treats small trees because there is a higher percentage of smaller and readily breakable material in the small trees. On a qualitative note, the limbs, tops and foliage in the bark discharge stream were more "chewed up" when derived from larger trees. This may be due to the "anvil effect" of the larger stems.
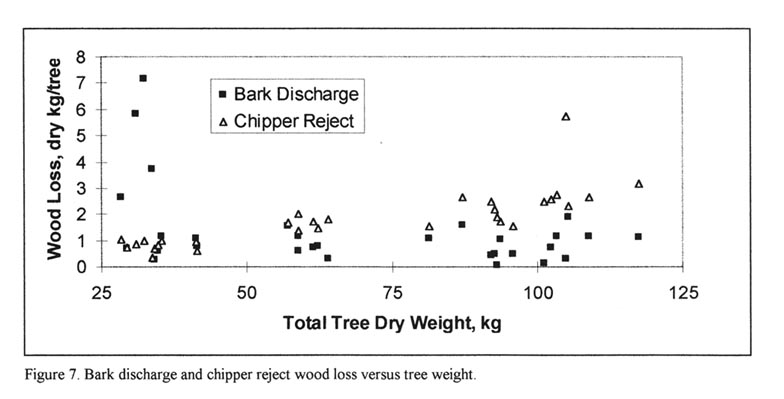
Bark discharge loss, in absolute terms, was high for the smallest trees, but was almost a constant for trees larger than 35 kg (Figure 7). This seems logical since bark discharge loss is mostly due to breakage of the small diameter section of the bole.
Chip reject loss increased with tree size, which makes sense as the amount of stringy material produced is probably related to the projected surface area of the tree. The percentage loss averaged 3.5%, and was not significantly different over the full range of tree size. The one obviously high loss value, of almost 6 kg (7% of total wood weight), was apparently caused by dull chipper knives, which were changed just after the observation. Dull knives would produce more material that would not pass through the slots in the chipper disk. In this case the knives blunted quickly because the previous loss values in the sequence did not "ramp up" to the high one.
Figure 4: Total weight of tree versus DBH.
Display large image of Figure 4
Figure 5: Total wood precentage versus tree weight.
Display large image of Figure 5
Figure 6: Wood loss percentage versus total tree dry weight.
Display large image of Figure 6
Figure 7: Bark discharge and chipper reject wood loss versus tree weight.
Display large image of Figure 7
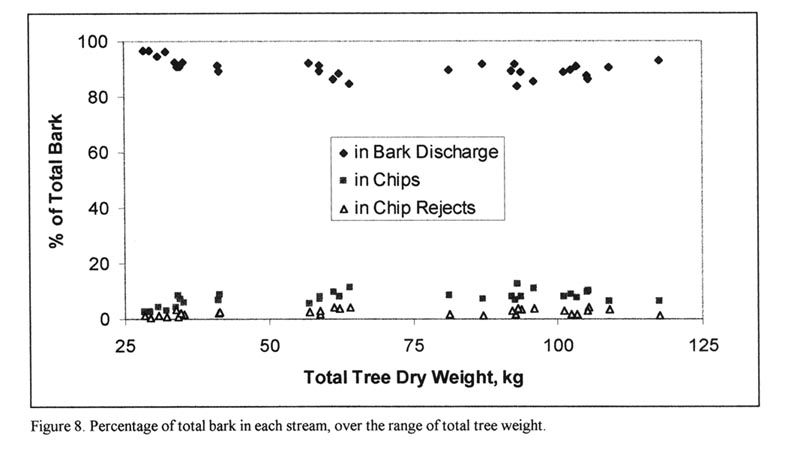
Bark Separation
A primary function of the two sorting mechanisms — the flail and the chipper reject scheme — is to separate bark from the chips. Figure 8 shows percentages of total bark in the three streams. About 90% of the bark was removed by the flail and ended up in the bark discharge stream. About 3% was separated out with the chip rejects, and 7% escaped into the chip van.
On average, for trees over 50 kg, over 95% of the material in the bark discharge stream was bark, while only 20%of the chip reject material was bark (Figure 9). The primary purpose of the chip reject mechanism is to separate oversize material that does not pass through the chipper disk. We did not measure the size distribution of the chipper rejects. However, most of the chipper reject material is wood, and that stream appears to be the most promising one to focus on for improving wood recovery. While sharpness of chipper knives appears to have a major impact on amount of wood in the chipper reject stream, it is not clear whether the losses with sharp knives are due to chipper design and fabrication parameters such as clearances between the chipper disk and housing, or due to bole damage caused by the flail.
Figure 8: Percentage of total bark in each stream, over the range of total tree weight.
Display large image of Figure 8
Figure 9: Bark percentage of the bark discharge stream and the chip rejects stream, dry basis, versus total tree weight.
Display large image of Figure 8
A caution regarding the potential of recovering wood from the chipper rejects: the 20% bark content in the chip rejects was fairly close to the 25% value for the total tree. Therefore, cleaning up the chip rejects to an acceptable bark content may be no easier than cleaning whole tree chips, a task that has proven difficult.
CONCLUSIONS
For trees larger than 50 kg dry weight, potentially available wood constituted 75% of the total tree weight. On average, the chain flail delimber-debarker-chipper delivered over 95% of the potentially available wood into the chip van. Recovery was substantially less for trees smaller than 50 kg dry weight, because loss due to top breakage represented a large fraction of wood in the smaller trees.
Bone dry contents for groups of five trees varied substantially, from 42% to 58%. This may be related to tree size or a moisture gradient within the stand. The BD contents for the bark discharge wood and chipper reject wood were significantly and consistently higher than those for chips.
Of the total bark — defined as all material other than potentially available wood — about 90% was removed by the flail and went into the bark discharge stream. About 3% showed up in the chipper rejects, and the rest made it into the van
Three-fourths of the wood loss showed up in the chipper rejects, of which 80% were wood (versus 5% wood in the bark discharge). The chipper rejects may be the best opportunity for improving recovery. Keeping chipper knives sharp appears to be very important. Beyond that, it is not clear what contributes to the chipper reject loss: bole damage caused by the flail, or chipper design parameters. The effect of flail damage could be tested, e.g., by chipping flailed and unflailed green peeler cores.
This study was conducted during the growing season. Wood-bark adhesion increases during the winter [3,6] and with drying [5,9], so the results would be somewhat different under different conditions. Boise Cascade has found that fresh poplar foliage causes problems during the growing season: it tends to ball up and clog the bark discharge on the delimber/debarker/chipper. Their operators prefer to process dormant trees, or growing trees that have partially dried.
ACKNOWLEDGMENT
We would like to thank Boise Cascade's staff, including Tom Agens and Evan Purser, Research Technicians, and Teresa Yeager, Research Assistant, for their assistance in collecting data; and the harvesting crew. This project was supported in part by the USDA Forest Service Southern Research Station under Cooperative Agreement SRS-30-CA-96-058.
AUTHOR CONTACT
Bruce Hartsough can be contacted by e-mail at --
brhartsough@ucdavis.edu
REFERENCES
[1] Araki, D. 1994. Observations of the Peterson Pacific DDC 5000 log delimber-debarker-chipper. Technical Note TN-214. FERIC. Vancouver, BC. 8 pp.
[2] Araki, D. 1996. Recovery of wood chips from low grade fiber sources. Special Report SR-115. FERIC. Vancouver, BC. 2 pp.
[3] Berlyn, R.W. 1965. The effect of variations in the strength of the bond between bark and wood on mechanical barking. Research Note No. 54. Pulp and Paper Research Institute of Canada. Montreal. 22 p.
[4] Creelman, R. 1992. A comparison of flailing at the stump versus roadside. Canadian Forest Industries (April): 19-21.
[5] Duchesne, I. And M. Nylander. 1996. Measurement of the bark/wood shear strength: practical methods to evaluate debarking resistance of Norway spruce and Scots pine pulpwood. Forest Products Journal 46(11/12):57-62.
[6] Einspahr, D.W. and M.L. Harder. 1983. Wood/bark adhesion measurements assist in drum debarker development. Forest Products Journal 33(5):21.
[7] Franklin, G.S. 1992. Model 23 Flail Chiparvestor delimber-debarker-chipper: productivity and chip quality in hardwood. Technical Note TN-187. FERIC. Pointe Claire, PQ. 6 p.
[8] Gingras, J.-F. 1992. Fibre recovery efficiency of wood harvesting systems. Technical Note TN-186. FERIC. Pointe Claire, PQ. 12 pp.
[9] Kubler, H. 1990. Natural loosening of the wood/bark bond: a review and synthesis. Forest Products Journal 40(4):25-31.
[10] Raymond, K.1989. Fibre loss during debarking. Field Note No. Processing-9. FERIC. Pointe Claire, PQ. 2 p.
[11] Raymond, K.1990. Peterson-Pacific DDC 5000 delimber-debarker-chipper. Field Note No. Processing-16. FERIC. Pointe Claire, PQ. 2 p.
[12] Raymond, K.A. and G.S. Franklin. 1990. Chain flail delimber-debarkers in eastern Canada: a preliminary assessment. Technical Note TN-153. FERIC. Pointe Claire, PQ. 8 p.
[13] Sauder, E.A. and A.W.J. Sinclair. 1989. Trial of a double-drum flail delimber/debarker processing small-diameter frozen timber: phase I. Special Report SR-59. FERIC. Vancouver, BC. 34 p.
[14] Stokes, B.J. and W.F. Watson. 1988. Flail processing: an emerging technology for the South. Paper No. 88-7527. American Society of Agricultural Engineers. 18 p.
[15] Stokes, B.J. and W.F. Watson. 1989. Field evaluation of in-woods flails in the southern United States. IN: Proceedings of the IEA/BA Task VI, Activity 2 Meeting. New Orleans, LA. May 29-June 1. pp. 99-111.
[16] Stokes, B.J. and W.F. Watson. 1991. Wood recovery with in-woods flailing and chipping. Tappi Journal 74(9):109-113.
[17] Stokes, B.J., W.F. Watson, A.A. Twaddle and I.C. Carte. 1989. Production and costs for in-woods flail processing of southern pines. Paper No. 89-7592. American Society of Agricultural Engineers. 13 p.
APPENDIX I. Statistics for all sampled trees.
| Parameter | Mean | Std. Dev. | Range | Count |
| Components, dry kg/tree | ||||
| Chip wood | 48.44 | 23.89 | 11.62-79.01 | 30 |
| Chip bark | 1.33 | 0.12 | 0.32-2.17 | 30 |
| Bark discharge wood | 1.35 | 1.60 | 0.06-7.12 | 30 |
| Bark discharge bark | 16.13 | 6.38 | 7.57-32.72 | 30 |
| Chipper reject wood | 1.78 | 1.06 | 0.33-5.72 | 30 |
| Chipper reject bark | 0.43 | 0.25 | 0.08-1.03 | 30 |
| Total wood | 51.58 | 23.95 | 15.25-83.24 | 30 |
| Total bark | 17.89 | 7.05 | 8.33-35.28 | 30 |
| Total tree | 69.47 | 30.06 | 28.38-117.56 | 30 |
| Bone dry percentages | ||||
| Chip | 47.9 | 4.9 | 38.8-58.8 | 31 |
| Bark discharge wood | 55.3 | 6.3 | 41.2-65.3 | 30 |
| Bark discharge bark | 52.9 | 3.9 | 46.0-60.3 | 30 |
| Chipper reject wood | 52.7 | 4.3 | 43.3-60.5 | 30 |
| Chipper reject bark | 51.2 | 4.2 | 42.7-59.2 | 30 |
| Total tree | 49.5 | 4.1 | 42.4-58.3 | 30 |
APPENDIX II. Statistics for trees larger than 50 kg total dry weight.
| Parameter | Mean | Std. Dev. | Range | Count |
| Components, dry kg/tree | ||||
| Chip wood | 62.66 | 14.50 | 35.92-79.01 | 20 |
| Chip bark | 1.72 | 0.40 | 0.98-2.17 | 20 |
| Bark discharge wood | 0.84 | 0.51 | 0.06-1.89 | 20 |
| Bark discharge bark | 19.07 | 5.74 | 10.42-32.72 | 20 |
| Chipper reject wood | 2.28 | 0.96 | 1.37-5.72 | 20 |
| Chipper reject bark | 0.56 | 0.19 | 0.29-1.03 | 20 |
| Total wood | 65.78 | 14.96 | 39.12-83.24 | 20 |
| Total bark | 21.35 | 6.04 | 12.31-35.28 | 20 |
| Total tree | 87.13 | 19.63 | 57.11-117.56 | 20 |
| Bone dry percentages | ||||
| Chip | 49.9 | 4.6 | 38.8-58.8 | 20 |
| Bark discharge wood | 57.3 | 4.8 | 47.8-64.6 | 20 |
| Bark discharge bark | 53.9 | 3.3 | 48.2-60.3 | 20 |
| Chipper reject wood | 53.6 | 3.9 | 47.5-60.5 | 20 |
| Chipper reject bark | 52.8 | 3.6 | 48.3-59.2 | 20 |
| Total tree | 50.9 | 3.9 | 42.4-58.3 | 20 |
APPENDIX III. Wood loss relationships for trees larger than 50 kg total dry weight.
A. Bark Discharge Wood, dry kg/tree (not significantly affected by tree size)
B. Chip Reject Wood, dry kg/tree
= -0.16 + 0.0280*TotalTreeDryWeight, kg r2 = 0.33 p = 0.008
C. Total Wood Loss, dry kg/tree
= 0.69 + 0.0279*TotalTreeDryWeight, kg r2 = 0.28 p = 0.017
D. Total Wood Loss, % of total dry wood (not significantly affected by tree size)
mean = 4.86, std.dev. = 1.49, n = 20, 95% confidence interval = 4.2 to 5.6