
Display large image of Figure 1
Vol. 11 No. 2 July 2000
Maarten Nieuwenhuis
University College Dublin
Ireland
Caroline Nugent
Green Belt Ltd.
Virginia Co., Cavan, Ireland
ABSTRACT
Coillte Teoranta (the Irish Forestry Board) harvested approximately 2.0 million m3 in 1994. By the year 2000 this annual harvest is projected to increase to approximately 2.8 million m3 and to 3.7 million m3 by the year 2011. To facilitate the management of these increased timber flows more efficiently and effectively, the Harvest Scheduling System (HSS) was developed.
In order to evaluate the HSS's solutions, five case studies were carried out, two of which are presented in this paper. Initially, the HSS model was solved without any management constraints, resulting in a theoretical maximum net present value (NPV) (case study 1). Subsequently, the effect of imposing national and regional level volume fluctuation constraints was examined (case study 2).
The investigations in the "no constraints" study resulted in a theoretical optimal harvest schedule for Coillte over the period 1998 to 2002. The solution showed great volume fluctuations from year to year, in terms of total volume, species, harvest type and product. It would be impossible to implement such a schedule, due to management, harvesting resources and industry requirements. However, the NPV achieved was used as a base to estimate the cost of applying management constraints in the second case study. This second study also showed that Coillte's production smoothing process results in harvest schedules that are not feasible, as no adjustments for volume are included.
Keywords: harvest scheduling, decision-support, constraints, optimisation.
The authors are, respectively, Senior Lecturer, Department of Forestry and Forester.
INTRODUCTION
The total forest area in the Republic of Ireland has increased from 100,000 ha at the beginning of the century to 570,000 ha or 8% of the land area in 1998. The national timber supply is expected to grow from 2.2 million m3 in 1997 to 3.8 million m3 by 2010 and, provided current planting levels are maintained, should grow to about 10 million m3 by 2030 [2].
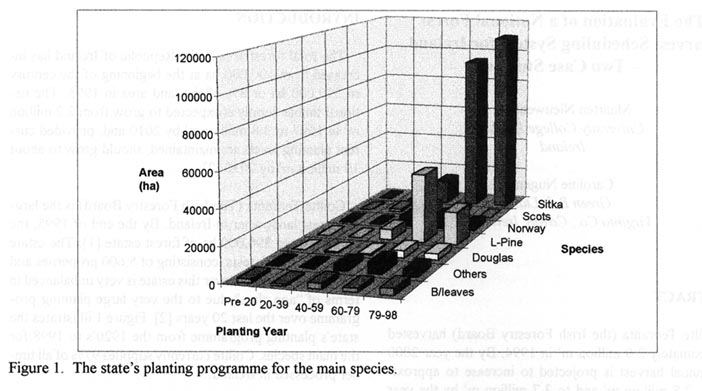
Coillte Teoranta (The Irish Forestry Board) is the largest forest landowner in Ireland. By the end of 1995, the Board owned 390,000 ha of forest estate [1]. The estate comprises 117 forests, consisting of 5,600 properties and 125,000 stands. However this estate is very unbalanced in terms of "age class" due to the very large planting programme over the last 20 years [2]. Figure 1 illustrates the state's planting programme from the 1920's to 1998 for the main species. Coillte currently supplies 97% of all timber processed in Ireland.
The increasing volume of timber harvested and the more specific requirements of the processing industry have made current planning procedures inadequate. Traditionally timber harvest scheduling has been conducted in isolation from timber allocation and no optimisation techniques have been used. The production of an efficient and cost effective harvest schedule that takes into account the forest management constraints, the processing sector requirements and the location of the demand and supply, has become an extremely difficult task.
To facilitate the effective and efficient management of these increased and more complex timber flows, new integrated management procedures for harvest scheduling are required. Currently a Harvest Scheduling System (HSS) prototype, incorporating timber allocation procedures, is being evaluated as a decision-support tool. The model has been formulated within the framework of linear programming (LP) and mixed integer programming (MIP) to produce optimal solutions. The model is linked to ARCINFO (a geographic information system) which extends the post-allocation analysis and interpretation capabilities of the HSS and combines the output with the existing information systems.
During the development of the HSS, research carried out on similar type systems internationally was analysed to identify components that could be of relevance in the Irish situation. The systems studied included MELA [13,14,15] in Finland, FOLPI [3,4,5] and REGRAM [6,7] in New Zealand and LOGPLAN [8,9] in the United States of America.
Figure 1: The state's planting program for the main species
Display large image of Figure 1
The objectives of the current research project are:
The following studies have been carried out with a view to evaluate the HSS [6a]:
· The "no constraints" study: The objective was to see what the maximum NPV and the associated NPV/m3 is that can be attained when no management constraints are applied.
· Models that conform to Coillte's harvest forecast: The objective was to see if the HSS could produce a forecast that is in line with Coillte's harvest forecast and to determine the associated decrease in NPV and NPV/m3 as compared with the "no constraints" study.
· Periodic fluctuating volume constraints: The objective was to produce an even supply of timber volume over all periods within each region and to determine the associated decrease in NPV and NPV/m3 as compared with the "no constraints" study.
· Periodic increasing volume production models: The objective was to create an increasing supply of volume from year to year within each region and to determine the cost of imposing these constraints when compared with the "no constraints" study.
· Regional study: The objective was to produce detailed harvest schedules for one of Coillte's 7 regions.
This paper presents the results of the first two studies.
THE HARVEST SCHEDULING SYSTEM
Past Development
Williamson [17] developed the Harvest Scheduling System prototype which is used in this study. The HSS has been formulated within the framework of LP and mixed integer programming (MIP) to optimise solutions. The model is linked to ARCINFO (Geographic Information System) which extends the analysis and interpretation capabilities of the HSS and combines the output with existing information systems.
The model was developed to help optimise the allocation and transportation of Coillte's annual timber supply of 1.4 million cubic meters in 1990. The study also compared the actual timber allocation and haulage routes with the optimal routes suggested by the study [10,11]. The programme created a 38% improvement on overall transport costs [18].
The HSS was tested in a case study for a time span ranging from 1994 to 1998 [17, 19]. The system was used to produce optimal production targets, harvest schedules and timber allocation plans for the five year period. The formulation and solution of these models proved very successful. The system contains considerable flexibility in the type of industry requirement constraints and forest management constraints that can be specified and solved successfully.
To improve Coillte's current methods of production target determination and timber allocation, a number of problems were addressed in the developed Harvest Scheduling System. Firstly, the processing industry demand was included in the HSS prototype, to change the emphasis from a production driven approach to a demand driven approach. Secondly, the spatial distribution effect of the market demand and timber supply and the associated haulage cost was included in the production target determination process. Thirdly, the economic consequences of selecting a particular production year for a particular stand were evaluated with respect to value increment, harvesting cost and transport cost. In addition, the HSS provides the manager with an optimal solution, whereas in the past the production of a stand harvest schedule was a "trial and error" process.
Hierarchical Structure of the HSS
A three level hierarchical model was used in the development of the present timber Harvest Scheduling System [17]. This approach requires the production of a national level model, 7 regional level models and 117 forest level models.
The national model determines optimal regional production targets which satisfy both the requirements of the processing industry and national, regional and forest management constraints. Production targets are specified by year, product, species, harvest type and demand node. The targets that were produced in the national model are used to run the seven regional models. Each region produces optimal production targets for each forest within that region. A forest level model is produced for 117 forests. The targets that were produced in the regional models are used to produce a stand harvest schedule for each forest.
The requirements of the processing industry on a national scale are identified and grouped into 7 main demand nodes. A demand node identifies the aggregated demand of a number of mills which are located at or near the location of the node. The reason for using aggregated demand nodes instead of individual mill demand nodes was the reduction in complexity of the models, while at the same time the accuracy of the solutions was not significantly affected.
Due to the scale and complexity of the scheduling and allocation problem, it is necessary to aggregate stands, for the national and regional level models, into logical management units based on a number of factors, includ
ing species, stage of development and administrative unit. The 117 forest level models schedule individual stands and do not use aggregated management units.
The national and regional level models are formulated as linear programming (LP) problems. The forest level models are formulated as mixed integer programming (MIP) problems. In LP formulations, if an aggregated stand option is selected, stands can be partially thinned or felled. In MIP formulations, if a stand option is selected, the entire stand must be thinned, clearfelled or left untreated. It was decided to use the more computational complex and demanding MIP formulation for the stand level models as it is essential at this level of harvest scheduling that management units (i.e. stands) are treated as indivisible.
The Data Requirements
The data requirements of the model are extensive and consist of:
· Supply data;
· Demand data;
· Revenue data;
· Cost data.
The supply data consist of the forest inventory data for each stand that is potentially due for thinning or clearfelling in the planning period. Management alternatives are produced for each stand. A management alternative is an alternative production year (i.e. thinning or clearfell year) or combination of production years, from that specified in the thinning and rotation classification (TRC). The TRC is carried out by the local forest manager. The basic approach used to produce management alternatives is to calculate the production year(s) as per the TRC and to produce alternative production years either side of the TRC year(s).
For each demand node an annual round timber estimate (minimum and maximum) is required for the planning period. This should be specified by period, product, species and harvest type. The mill demand files consist of demand information for the twenty largest sawmills and the wood processing plants [16]. The delivered price of each product is also required. The delivered price of each product is the price of the product delivered at mill gate and includes the purchase price, as well as harvest and transportation costs. The prices used are based on actual recently recorded sales. The net revenue to the timber producer (i.e. Coillte) is presently calculated as follows:
Net revenue = Delivered price - (Harvesting cost + Transport cost)
Net revenue is discounted by 5% per year to obtain net present value (NPV). Transport costs were set at "0" for this study as the actual allocation of timber was considered outside of the scope of this study. The harvesting cost for a stand is determined by the harvest type and the mean tree volume. Four harvest types are identified as the basis of costing the harvesting operation. These harvest types are (1) first, (2) second, (3) subsequent thinnings and (4) clearfell. Regional harvesting cost adjustments are also included.
Constraints
Constraints are used to control the level of production and can be applied at national, regional, district and forest levels. Within each level, constraints can be applied to volume, revenue and area. For the purposes of this study all constraints were applied to volume. For example, a constraint controlling the volume of Sitka spruce sawlog from first thinnings in district 11 in period 4 can be specified. Constraints can be applied to total volume or to individual products. For the purpose of this study specific constraints were not applied to species. An example of a constraint that could be applied to revenue would be that the income obtained should increase by a certain percentage every year. Equally, a forest manager might specify that the area of clearfell in a region should be less than 70% of the total harvest area. In general terms, constraints may be internal, management related or industrial related.
Internal constraints are concerned with the formulation and structure of the LP model. One type of internal constraint ensures that the area felled does not exceed the stand area. For example, for a regional model a stand with an area of 6.3 ha with three felling options for 1996, 1997 and 1998, requires a constraint which specifies that: Areafell96 + Areafell97 + Areafell98 £ 6.3 ha.
Management constraints specify policy as regards the management of the entire forest estate, regions, districts and for forests. For example, it may be required that a certain level of production is maintained in each region throughout the planning period or that the annual production must be non-declining on a national basis.
The demand of the processing industry is expressed by means of demand constraints. Demand constraints specify the maximum and minimum annual volume requirements of a particular industry demand node for a particular product for each year in the planning period.
Evaluation Methods
Coillte supplied up-to-date inventory data and the January 1997 forecast. This forecast was used to compile the management constraint files.
Simple industry demand constraints were applied in each of the five case studies outlined previously. These constraints were applied to an aggregation of all demand nodes, as allocation was not taken into account in this project. The evaluation methods used in the two case studies presented in this paper are outlined below.
The "no constraints" study
Management constraint files were not included in this model. However internal and total industry demand constraints were included. The result is maximum net revenue which is only limited by stand management options and industry demand. The cost of imposing any amount and type of additional constraints can be ascertained when added later. The "no constraints" solution is unlikely to be acceptable, because of the total lack of organisational inputs.
Models that conform to Coillte's harvest forecast
Explicit constraint files were created using Coillte's harvest forecast. Constraints were compiled, whereby the maximum fluctuation of the HSS volumes from Coillte's harvest forecast volumes was set at ± 50%, ± 20%, ± 10%, ± 5% , ± 3%, ± 2% and ±1% .
Table 1 illustrates national volume constraints. For example, the volume produced in period 1, for the whole country, must fall between 2,617,250 m3 and 2,892,750 m3 (line 1). The second constraint illustrates that the volume produced in period 1 from thinnings (harvest type = 1) must fall between 762,850 m3 and 843,150 m3. Similar constraints were applied at regional level. Constraints are applied to all products and harvest types. For each constraint file a national model, 7 regional models and some forest models were solved and analysed.
RESULTS
As pointed out previously, Coillte Teoranta kindly supplied the authors with details of their national production forecasts which range from 1997 to 2006, along with the appropriate regional forecasts, product forecasts and species forecasts. These forecasts were used in the research reported in this paper.
Initially, the HSS model was solved without any management constraints resulting in a theoretical maximum net present value (NPV). Following the completion of the "no constraints" study, the effect of imposing national and regional level volume fluctuation constraints upon the HSS's production was examined. These constraints were compiled using Coillte's production forecast. A further objective was to examine the associated changes in NPV and NPV/m3. The planning period covered the years 1998 to 2002 (period 1 to 5).
Table 1. Section of a constraint file with volume fluctuations of ± 5%.
| Period | Product | Species | Harvest Type |
Minimum Volume |
Maximum (m3) |
Constraint Volume (m3) |
| 1 | 0 | 0 | 0 | 2,617,250 | 2,892,750 | 1 |
| 1 | 0 | 0 | 1 | 762,850 | 843,150 | 1 |
| 1 | 0 | 0 | 2 | 1,854,400 | 2,049,600 | 1 |
| 1 | 1 | 0 | 0 | 715,350 | 790,650 | 1 |
Table 2. Regional production values (m3) when no management constraints are imposed.
| Region | ||||||||
| Year | 1 | 2 | 3 | 4 | 5 | 6 | 7 | Total |
| 1998 | 715,199 | 385,961 | 354,412 | 328,911 | 415,421 | 485,844 | 314,251 | 2,999,999 |
| 1999 | 448,113 | 338,524 | 459,977 | 349,276 | 337,538 | 687,515 | 379,048 | 2,999,991 |
| 2000 | 278,973 | 284,991 | 290,209 | 896,953 | 434,280 | 455,695 | 358,898 | 2,999,999 |
| 2001 | 443,579 | 421,851 | 467,171 | 371,772 | 376,037 | 522,563 | 397,019 | 2,999,992 |
| 2002 | 419,850 | 446,023 | 451,952 | 597,618 | 172,076 | 527,180 | 385,306 | 3,000,005 |
| Total | 2,305,714 | 1,877,350 | 2,023,721 | 2,544,530 | 1,735,352 | 2,678,797 | 1,834,522 | 14,999,986 |
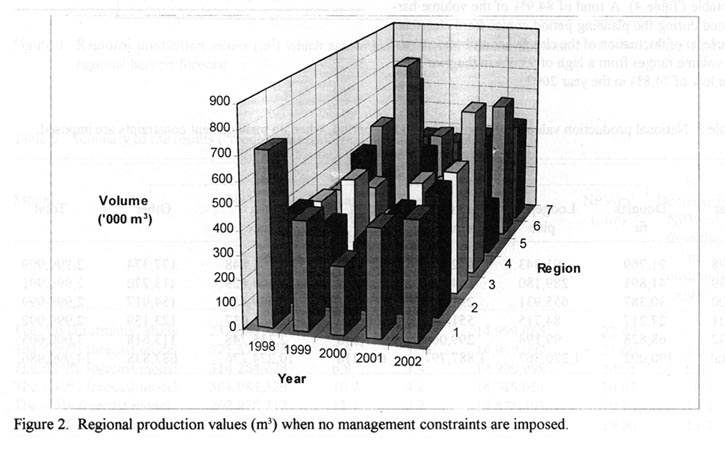
Figure 2: Regional production values (m3) when no management constraints are imposed.
Display large image of Figure 2
The "No Constraints" Study
The objective function value (NPV) of the optimal solution with no management constraints was £337.0 million. The total volume produced in periods 1 to 5 (1998-2002) was 14,999,986 m3 (Table 2) and the NPV/m3 is £22.47. The irregular volume production from year to year within each region is clearly shown in Figure 2. These fluctuations in volume production are clearly undesirable, if not unacceptable, from a management perspective, due to problems of implementing such a schedule in relation to company and contractor resources and processing industry requirements.
The periodic difference in the volume produced in the years 2000 and 1999 for region 4 is 547,677 m3 or 156.8% of the 1999 volume. The variation in the volume produced in the years 2001 and 2000 for the same region is 525,181 m3 or 58.6% of the 2000 volume.
In using the HSS for forecast purposes, not only do difficulties arise as a result of total volume production but these problems can be compounded by species anomalies (Table 3). As an example of the very large, within species fluctuations that occur, the difference in Sitka spruce volume produced between the years 2002 and 2000 is 636,434 m3 or 37.4% of the 2000 volume. In this same instance, the Lodgepole pine volume is reduced from 655,931 m3 in the year 2000 to 99,198 m3 in 2002. Finally, the sustainability of the forest industry would be adversely affected if this harvest schedule was implemented as the balance between clearfell and thinning operations is unacceptable (Table 4). A total of 84.9% of the volume harvested during the planning period comes from clearfells. The level of fluctuation of the clearfell contribution to total volume ranges from a high of 93.3% in the year 2001 to a low of 74.8% in the year 2002.
Table 3. National production values (m3), by species and by period, when no management constraints are imposed.
| Species | |||||||
| Year | Douglas fir |
Lodgepole pine |
Norway spruce |
Scots pine |
Sitka spuce |
Other | Total |
| 1998 | 21,769 | 91,343 | 432,136 | 125,529 | 2,151,848 | 177,374 | 2,999,999 |
| 1999 | 41,891 | 289,180 | 314,252 | 136,069 | 2,104,829 | 113,770 | 2,999,991 |
| 2000 | 30,387 | 655,931 | 291,337 | 168,113 | 1,699,314 | 154,917 | 2,999,999 |
| 2001 | 27,217 | 84,715 | 551,007 | 130,857 | 2,083,037 | 123,159 | 2,999,992 |
| 2002 | 68,828 | 99,198 | 299,065 | 83,548 | 2,335,748 | 113,618 | 3,000,005 |
| Total | 190,092 | 1,220,367 | 1,887,797 | 644,116 | 10,274,776 | 682,838 | 14,999,986 |
In conclusion, it is evident from these results that unless some measures (i.e. constraints) are introduced to regulate the production process, the HSS model will not produce acceptable production schedules because of the erratic supply of timber, by species, assortments and harvest types, within each region, for each period.
Models That Conform to Coillte's Harvest Forecast
In the previous section the difficulties in harvest scheduling without the imposition of constraints have been outlined. However, while the lack of constraints resulted in management difficulties, the imposition of constraints will involve a cost penalty. A series of models were solved in order to examine the impact (i.e. the reduction in NPV) of a range of constraints upon the solutions produced by the HSS.
Table 4. National production values (m3), by harvest type and by year, when no management constraints are imposed.
| Harvest Type | |||
| Year | Thinning | Clearfell | Total |
| 1998 | 467,194 | 2,532,805 | 2,999,999 |
| 1999 | 581,856 | 2,418,135 | 2,999,991 |
| 2000 | 264,649 | 2,735,350 | 2,999,999 |
| 2001 | 201,170 | 2,798,822 | 2,999,992 |
| 2002 | 755,986 | 2,244,019 | 3,000,005 |
| Total | 2,270,855 | 12,729,131 | 14,999,986 |
Table 5. Regional production values (m3) which are within the annual volume fluctuation of ± 50% from Coillte's regional harvest forecast.
| Region | ||||||||
| Year | 1 | 2 | 3 | 4 | 5 | 6 | 7 | Total |
| 1998 | 485,555 | 408,891 | 484,959 | 378,298 | 401,570 | 471,561 | 369,158 | 2,999,992 |
| 1999 | 587,603 | 345,236 | 451,246 | 430,143 | 271,872 | 542,864 | 371,042 | 3,000,006 |
| 2000 | 336,533 | 424,331 | 395,364 | 556,726 | 297,474 | 649,982 | 339,592 | 3,000,002 |
| 2001 | 307,459 | 404,826 | 501,235 | 579,212 | 329,222 | 581,081 | 296,969 | 3,000,004 |
| 2002 | 394,700 | 339,251 | 505,601 | 674,622 | 187,318 | 530,802 | 367,802 | 2,999,995 |
| Total | 2,111,850 | 1,922,535 | 2,338,405 | 2,619,001 | 1,417,456 | 2,776,189 | 1,744,563 | 14,999,999 |
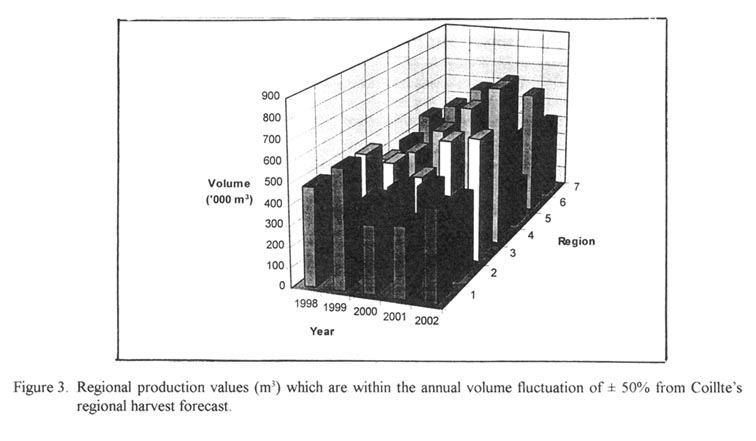
Figure 3: Regional production values (m3) which are within the annual volume fluctuation of ± 50% from Coillte's regional harvest forecast.
Display large image of Figure 3
Table 6. Summary of the results ("models that conform to Coillte's forecast").
| Model | NPV( ) | % Decrease in NPV from the "no constraints study" | % Decrease in NPV as compared with the previous model | Total Volume (m3) | NPV/m3 (/m3) | % Decrease in NPV/m3 from the "no constraints study" |
| The "no constraints" study | 337,048,444 | - | - | 14,999,986 | 22.47 | - |
| The ± 50% forecast model | 325,370,796 | 3.5 | 3.5 | 14,999,999 | 21.69 | 3.5 |
| The ± 20% forecast model | 314,264,078 | 6.8 | 3.4 | 14,999,998 | 20.95 | 6.8 |
| The ± 10% forecast model | 301,084,329 | 10.7 | 4.2 | 14,999,991 | 20.07 | 10.7 |
| The ± 5% forecast model | 292,978,312 | 13.1 | 2.7 | 14,871,303 | 19.70 | 12.3 |
| The ± 3% forecast model | 289,000,237 | 14.3 | 1.4 | 14,819,300 | 19.50 | 13.2 |
The ± 50% forecast model
Initially, the volume harvested from each region within each period was set to vary by a maximum of ± 50% from Coillte's harvest forecast. The outcome, presented in Table 5 and Figure 3, showed that the NPV obtained in this model was £325.4 million. Therefore the cost of applying these constraints represents a decrease of 3.5% from the NPV obtained when no constraints were applied. The volume harvested stayed almost constant at 14,999,999 m3 and the NPV/m3 is reduced to £21.69. This represents a decrease of 3.5% in the NPV/m3.
It is evident that the regional periodic volume fluctuations have decreased. For example, the difference in the volume produced in the year 2000 and the year 1999 for region 4 is 126,583 m3 or 29.4% of the 1999 volume (in comparison with 156.8% in the "no constraints" study). The difference in the volume produced in the year 2001 and the year 2000 for region 4 is 22,486 m3 or 4.0% of the 2000 volume (in comparison with 58.6% without the imposition of constraints).
Summary of the harvest scheduling models
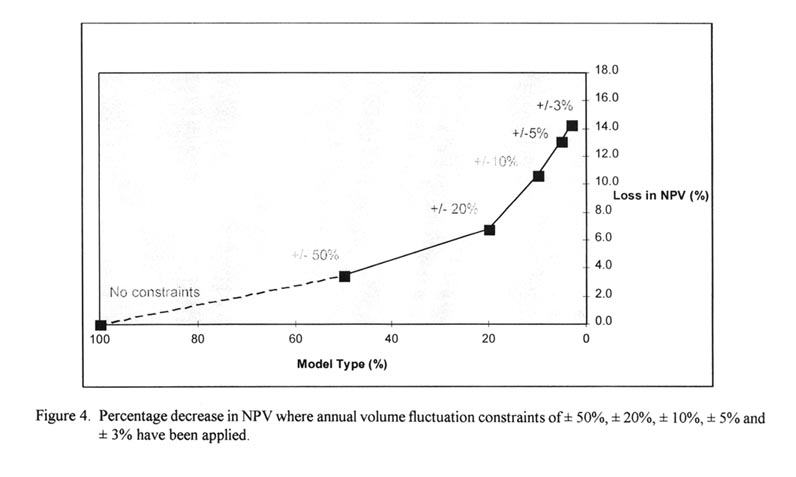
In a series of further investigations, constraint set were compiled whereby the maximum variation of the HSS volumes from Coillte's harvest forecast volumes was set at ± 20%, ± 10%, ± 5%, ± 3%, ± 2% and ± 1% of the forecast volumes. These constraints were applied on a national and a regional level for the years 1998 to 2002. A summary of these results is presented in Table 6. The ± 3% forecast model was as close to Coillte's harvest forecast as it was possible to obtain a solution. Further narrowing of the fluctuation range to ± 2% and ± 1% resulted in infeasible models, i.e. no solution could be produced.
It is evident that the total NPV decreased as more restricting constraints were applied. For each of the models the percentage decrease in NPV compared with the "no constraints" study and the percentage decrease as compared with the previous model were analysed. For example, a NPV of £301.1 million was obtained from the ± 10% forecast model. The cost of applying these constraints represents a decrease of 10.7% from the NPV obtained in the "no constraints" study and a decrease of 4.2% in NPV when compared with the ± 20% forecast model. The volume harvested has remained almost constant and the NPV/m3 is reduced to £20.07. This represents a decrease of 10.7% in the NPV/m3 from the "no constraints" study.
DISCUSSION
The main objective of this research was to evaluate solutions produced by the HSS prototype. This was achieved in the two case studies presented in this paper. This section discusses the results obtained and highlights the ability of the HSS to provide sensitivity analyses (i.e. comparisons of alternative scenarios). In addition, the relevance of the results to Coillte is discussed.
The "No Constraints" Study
The objective was to determine the maximum NPV that could be attained. A theoretical optimal harvest schedule for Coillte over the period 1998 to 2002 was produced that satisfied total industry demands, without introducing any management constraints. The solution showed that the volume fluctuations from year to year, in terms of total volume, species, harvest type and product were unacceptable. It would be impossible to implement such a schedule, due to management, harvesting resources and specific industry requirements. However, the NPV achieved was used as a base to evaluate the cost of applying management constraints in the second case study.
Models That Conform to Coillte's Forecast
The objective of this case study was to see if the HSS could produce a harvest schedule that was in line with Coillte's smoothed forecast and to determine the associated decrease in NPV as compared with the "no constraints" study. The solution from the ± 3% model was as close to Coillte's forecast as was possible to achieve. It was not possible to produce a harvest forecast that was identical to Coillte's forecast. Tentative conclusions about Coillte's forecasting process can be drawn from this result. The most likely reason for the discrepancy is that the accuracy of Coillte's smoothing process may be at fault. When using this process, the production from a stand is delayed or brought forward in an attempt to smooth out the peaks or troughs in the forecast. However, the movement of production from one year to another does not include the addition or subtraction of volume increment in the appropriate top diameter categories. In contrast, the HSS does include these volume changes in its option calculations. As a result, the two processes do not produce similar harvest schedules and volumes. The infeasibility of the ± 2% and the ± 1% models is a clear indication that Coillte's smoothing process produces forecasts that are unrealistic in terms of maximising revenues from timber harvesting.
Figure 4: Percentage decrease in NPV where annual volume fluctuation constraints of ± 50%, ± 20%, ± 10%, ± 5% and ± 3% have been applied.
Display large image of Figure 4
CONCLUSIONS
This research was very useful for a number of reasons. Firstly, it showed that Coillte's production smoothing process results in harvest schedules that are not feasible, as no adjustments for volume are included. Secondly, this study has illustrated that the HSS can provide decision-support for Coillte managers on national, regional and forest levels. Finally, the cost of applying various constraints at different levels was determined.
As it has been shown that the HSS can produce harvest schedules similar to the ones produced by Coillte, the integration of the HSS in Coillte's planning procedures should be encouraged. The HSS prototype is a complex decision-support tool. As a result a degree of specialisation is required to operate the system. It is not designed to replace forest managers but should be used as a planning tool to assist in the efficient scheduling of Coillte's harvest programme.
The potential benefits of the integration will include more feasible harvest schedules, increased profits, a less time consuming planning process and a better spatial and temporal match of demand and supply. The cost savings may well be in the order of millions of pounds, while the use of the HSS model would certainly reduce the time currently expended in manually manipulating data.
ACKNOWLEDGEMENT
This research was funded by the Council for Forest Research and Development (COFORD) and by Coillte Teoranta.
AUTHOR CONTACT
Maarten Nieuwenhuis can be reached by email at -- Maarten.Nieuwenhuis@ucd.ie
REFERENCES
[1] Anon. 1996. Growing for the Future. A Strategic Plan for the Development of the Forestry Sector in Ireland. Department of Agriculture, Food and Forestry. The Stationery Office, Dublin, Ireland. 98 pp.
[2] Carey, M. 1997. The Strategic Plan: Vibrant or Wearing Thin? - A User's View. In: Proceedings of the Irish Timber Growers Association 1997 Seminar "Commercial Forestry and Biodiversity". Dublin, Ireland. Pp 1-36.
[3] Garcia, O. 1994. A Forestry-Oriented Linear Programming Interpreter. In: Proceedings IUFRO Symposium on Forest Management Planning and Managerial Economics, University of Tokyo, Japan. Pp 293-305.
[4] Manley, B.R. and Threadgill, J.A. 1990. Use of FOLPI Forest Estate Modelling System for Forest Management Planning. In: Proceedings New Approaches to Spacing and Thinning in Plantation Forestry. Forest Research Institute, Rotorua, New Zealand. Pp 112-118.
[5] Manley, B.R. and Wakelin, S.J. 1990. Impact of Volume Constraints on the Choice of Silvicultural Regime. In: Proceedings New Approaches to Spacing and Thinning in Plantation Forestry. Forest Research Institute, Rotorua, New Zealand. Pp 275-286.
[6] McGuigan, B.J. 1992. REGRAM: a Flexible Object-Based, Harvest Scheduling, Resource Allocation and Processing Model Generator. In: IUFRO Proceedings Integrated Decision-Making in Planning and Control of Forest Operations. Christchurch, New Zealand. Pp 34-38.
[7] McGuigan, B.J. and Scott, J. 1995. REGRAM-1 _ a Flexible Forest Harvest Scheduling and Industrial Processing Global Optimisation Model. New Zealand Forestry 40(2):17-20.
[8] Newnham, R.M. 1975. LOGPLAN _ a Model for Planning Logging Operations. Forest Management Institute Information Report FMR-X-77. Canadian Forest Service. 52 pp.
[9] Newnham, R.M. LOGPLAN II: a Model for Planning Logging and Regeneration Activities. Petawawa National Forestry Institute Information Report PI-X-102. Forestry Canada. 38 pp.
[10] Nieuwenhuis, M. A., Williamson, G. P. and McCarthy, G. 1991. Timber Sales Allocation: Linking Forests and Mills. In: Proceedings The Application of Information Technology in Forest Management Planning. IUFRO S4.04.00. University College Dublin, Ireland. Pp 44-54.
[11] Nieuwenhuis, M. A., Williamson, G. P. and Gardiner, J.J. 1992. A National Integrated Timber Sales Allocation and Transport Planning Procedure. In: IUFRO Proceedings Integrated Decision-Making in Planning and Control of Forest Operations. Christchurch, New Zealand. Pp 1-10.
[12] Nugent, C. 1998. The Development and Evaluation of an Operational Spatial and Temporal Timber Harvest Scheduling System. University College Dublin, Ireland. 126 pp.
[13] Siitonen, M. 1993. Experiences in the Use of Forest Management Planning Models. Silva Fennica 27(2):167-178.
[14] Siitonen, M. 1995. The MELA System as a Forestry Modelling Framework. Lesnictvi (Forestry) 41(4):173-178.
[15] Siitonen, M., Harkonen, K., Hirvala, H., Jamsa, J., Kilpelainen, H., Salminen, O. and Teuri, M. 1996. MELA Handbook, 1996 Edition. The Finnish Forest Research Institute. 44 pp.
[16] Williamson, G. P. 1991. Development of a Timber Allocation Procedure. University College Dublin, Ireland. 123 pp.
[17] Williamson, G. P. 1994. Optimal Spatial and Temporal Timber Harvest Scheduling and Allocation. Internal Publication, Coillte Teoranta, Ireland.
[18] Williamson, G. P. and Nieuwenhuis, M. A. 1993. Integrated Timber Allocation and Transportation Planning in Ireland. Journal of Forest Engineering 5(1): 7-15.
[19] Williamson, G. P. and Nieuwenhuis, M. A. 1994. Optimal Temporal and Spatial Timber Harvest Scheduling. In: Proceedings of the 17th Annual Geographic Information Systems Seminar and the 1994 Resource Technology Symposium, Toronto, Canada. Pp 613-627.