Vol. 11 No. 2 July 2000
W.S. Abeli1
D.T.K. Shemwetta1
R.E.L. Ole Meiludie1
M. Kachwele2
1Sokoine University of Agriculture,
Morogoro, Tanzania.
2Tanzania Forestry Research Institute,
Iringa, Tanzania.
ABSTRACT
In forestry, roads are essential structures as they provide access to the forest from the establishment phase to harvesting stage. Thus it is important that roads are properly planned, constructed and maintained in order to ensure easy access, smooth transport of forest products, safety, comfort and economy on vehicle operations. For Tanzania where commercial timber harvesting in plantation forests has just started, appropriate values of parameters for road alignment and gradient, in the context of the country's settings, need to be established.
This study, which was carried out on a gravel secondary access road, established that traffic and water contribute significantly to road deterioration or loss of road surface materials. Road alignment and road gradient were found to influence the rate of soil loss. The study found that the optimal road grade and curve radii which minimized road maintenance cost in this area were grades less than 6% and radii above 100m respectively. Statistical analysis however showed that there was no significant difference between straight sections of the road and the curve sections in terms of loss of surface layer materials.
Keywords: road maintenance, surface materials, straight sections, curve sections, soil loss.
The authors are, respectively, Professor, Senior Lecturer, and Professor, Sokoine University of Agriculture, and Senior Researcher, Tanzania Forest Research Institute.
INTRODUCTION
For timber harvesting purposes, an optimal road grade is the one which minimizes construction, hauling and maintenance costs [2]. In a study carried out at Sokoine University of Agriculture Training Forest near Arusha, Tanzania [1] it was found that a roadline with a maximum gradient of 8%, compared to 6% and 10% grades, was the one which minimized the total construction and hauling costs. Although the scope of the study did not consider road maintenance cost, investigation on this aspect was recommended.
The main objective of any road maintenance operation is to restore the road to its original condition. It has been reported by [7] and [8] that lack of road maintenance increases road maintenance costs, reduce truck speed and safety, and in extreme cases, demands rebuilding the whole road. Regular road maintenance is thus necessary since weather conditions alone will cause road deformation even in the absence of traffic [2].
Most roads in Tanzania forest plantations were constructed during the establishment phase, where only access for planting and general forest protection were the concerns. Traffic density and loads during timber harvesting bring in new concerns for alignment and grade. According to [3], major soil erosions that occur in the forest are attributed to poor road planning, construction flaws and poor or inadequate road maintenance. Water, if allowed to accumulate and run on the road surface, is considered to be the worst enemy of gravel roads [6]. As water runs on the road surface, it erodes the road surface and softens the sub-grade. Once the subgrade is softened, its bearing capacity is lowered, resulting in road deformation whenever traffic goes over the road. To avoid water running on the road surface, roads are usually crowned during the construction phase so that water is drained to the sides [6].
Road maintenance can be an expensive undertaking if not done promptly and properly. On the other hand, neglect and delays in maintaining the road permit traffic and weather to change minor defects into major problems [6]. Studies have also shown that road maintenance cost depends on the frequency and the type of road maintenance undertaken. The frequency of road maintenance on the other hand depends on the road grade, quality of subgrade and surface layer materials used, road alignment, weather condition and traffic density [7].
Road gradient is considered to be one of the most important factors which influence the frequency of road maintenance, consequently road maintenance cost. As gradient increases, the water runoff speed and consequently its eroding power also increases. It is estimated that as speed of water doubles, its eroding power increases four times [1]. Furthermore, damages by vehicles increase progressively with increase in gradient since the braking in vehicles tend to dig the road surface. It has also been found that road maintenance costs and erosion problems tend to rise sharply with increase in slopes [3], while the quality of the road decreases with increase in gradient [9].
Road alignment is another factor which has great influence on the frequency of road maintenance. It has been reported that as speeding vehicles brake prior to negotiating curves, wheels brake and scuff the road surface, resulting into the development of ruts and washboards on the road surface [2].
In order to find out the influence of road gradient and road alignment on road deterioration, a stretch of a road representing different classes of grades and alignment was chosen and studied over a period of 2½ years. During this period no maintenance was undertaken on this stretch of road. The extent of road deterioration was determined by measuring the loss of surface layer material over the entire study period. The maximum road grade and the best road alignment for this area was considered to be the one with the least soil loss.
This study was aimed at, in a practical sense, addressing these issues of road alignment and grade on road maintenance costs in Tanzania, and inform planners on the importance of the appropriate values of these parameters.
METHODOLOGY
Study Area
The study was done at Sao Hill Forest Project, in the southern highlands of Tanzania. The plantation which is 43,700 ha is dominated by pine species of P. patula, P. elliottii and P. caribaea and some Eucalyptus species. The forest project lies within latitudes 8°13"S - 8°18"S and between longitudes 35°06"E- 35°20"E. The forest is 1,400 - 2000m above sea level with a rolling terrain intersected with small hills and wide flat bottomed valleys. The annual precipitation is about 1000mm, 95% of which falls during the period November to April. Daily maximum temperatures ranges between 22-28 °C and minimum temperatures, which occur during June-August, ranges between 4-12 °C [5].
The soil parent materials are of granitic origin. They are deep, relatively uniform in physical structure, well drained and mostly of sandy clay loam. The top soils are invariably brown and are generally compacted down to a depth of 20-30 cm [5].
Access roads in this forest (categorized as one lane secondary access roads) are gravel all-weather roads with roadbeds of 4.5 m wide, side ditches, adequate number of culverts and few turnouts. The traffic density is low, about 15-25 truck loads per day, and payloads for the hauling trucks range from 10-40 m3 per trip.
At the beginning of the study, the road stretch was graded and resurfaced in order to ensure smooth drainage and uniform road surface layer. The soil materials used as surface layer was dug within the forest and had the following particle distribution: Gravel (43.3%), Sand (55.7%) and Silt and Clay 1.0%). The thickness of surface layer material varied from 11.0 - 15.0 cm.
Data Collection
Selection of the study site along the road was done systematically so that a good number of curves of various radii and road sections of different grades could be included.
A total of 55 research sites or stations were established on a 3.65 km road stretch. On each station, two vertical stakes (30 -40 cm long) were firmly stuck into the ground on both sides of the road, to remain in permanent position throughout the study period. Distance between each pair of stakes at a station depended on the road width.
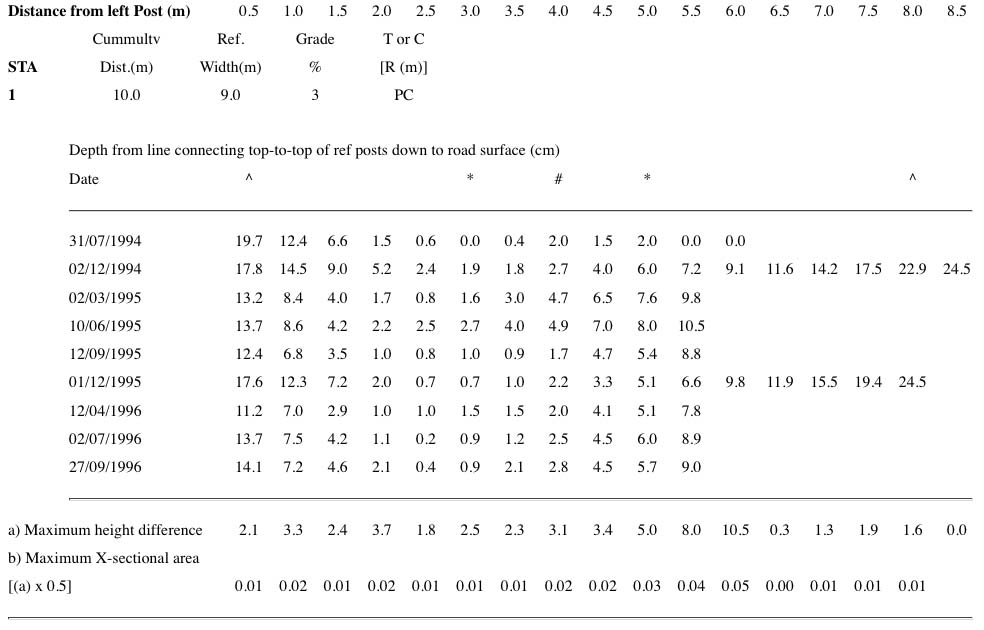
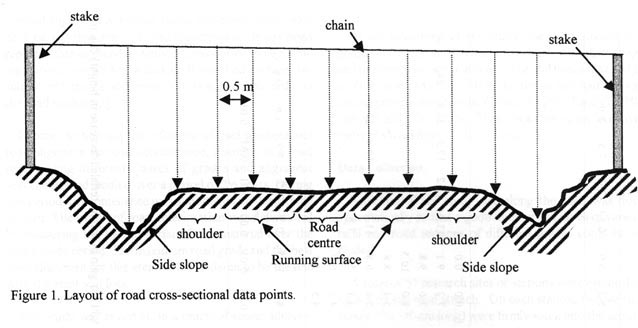
To record soil loss (or gain) across a station, a measuring chain was held tightly on top of these stakes to measure height difference between the road surface and the chain, at an interval of 0.5 m across the road. Figure 1 shows points across the road where soil loss measurements were taken. The position of each point measured was recorded to indicate whether it was on the side slope, shoulder, running surface or centre of the road. After every three months, same points were measured for a period of two and a half years (1994-1996). Road gradients for all stations and curve radii of all curves within the study area were measured at the beginning of the study. A sample of field data for one station is summarized in Table 1.
Data Analysis and Interpretation
Data collected in the field was analysed to determine the loss of surface layer materials which occurred on straight and curve sections of the road. The volume of soil loss (m3) per road section was found by using the following approach:
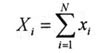
i. Cross-sectional area of soil loss at each point across a station was found by multiplying the height difference (in m) by 0.5 m, which was the cross-sectional distance between data measuring points
xi = di * 0.5
ii. Road cross-sectional end area of a station was the sum of individual values across the station.
Table 1
Display large image of Table 1
Figure 1: Layout of road cross-sectional data points
Display large image of Figure 1
iii. Volume loss between two adjacent road stations was found as the multiple of average cross-sectional area and the distance between the two stations.
Vij = 0.5(Xi + Xj)Dij
Where:
Vij= volume loss between stations i and j (m3)
Xi & Xj = cross-sectional areas for stations
i, & j (m2)
Dij = distance between station i to the next station
j (m)
Volume of soil loss per running meter (m3/m) per road section (Vij/Dij), was the parameter used in data analysis and data interpretation. Height differences between the first measurement and the subsequent measurements indicated that there was either loss or gain of surface layer material at that particular point. Any increase in height difference meant that there was loss of surface materials while decrease in height difference meant there was deposition of surface materials on that point. When computing the volume of surface layer materials lost or deposited on each road section, maximum height difference measurements or values (based on the first readings) for the entire period were used in the calculations. Since the study was interested in the worst scenario, height measurement difference between the start and end of the observation period alone will not represent a reversed loss (or gain) of surface material at a point due to surface water runoff or traffic.
Because of the rolling nature of the area, grades on the study road were relatively gentle and the range was small. However, in order to assess the influence of road grade on soil loss or road deterioration, roads were classified and analysed under the following grade classes: Class 1: <3%, Class 2: 3-6% and Class 3: >6%. Road curves which were also considered to influence vehicle speed and road deterioration were classified and analysed under the following curve classes: Class 1: curves with radii < 100m, Class 2: curves with radii 100-200m and Class 3: curves with radii > 200m.
To find out if traffic had any effect on road deterioration, soil loss measurements on different parts of the road cross-section with varying traffic or tyre pass intensities were taken. At each station, cross-sectional soil loss due to traffic was determined on the following main road parts: road side (slope/shoulder) vehicle running surface and centre of the road (Figure 1).
RESULTS AND DISCUSSION
Soil Loss on Straight and Curve Sections
On the 55 research points established on the study road, 28 points were on the straight (tangent) sections of the road while 27 were on the curves. Table 2 summarizes the main statistics for the soil loss on both straight and curve sections of the study road.
Analysis of the data from these points showed that the curve sections experienced slightly more soil loss (0.0457 m3/m) than the tangent sections (0.0449 m3/m). However, when tested statistically, there was no significant difference at 5% probability level (p= 0.4367).
Table 2. Summary statistics for soil loss on both straight and curve sections of the study road.
| Statistic | Straight | curves |
| Observations | 28 | 27 |
| Mean | 0.0457 | 0.0449 |
| p(straight Vs curves) | 0.04367 |
Relatively high vehicle loads and sometimes vehicle cruising speeds (40-50 km/h) resulted into surface layer materials being pushed to the sides and some materials being crushed and lost as dust. Soil loss on curves was slightly higher due to vehicle wheels scuffing and pushing surface materials to the road sides. Again since most of the curves (over 70%) had radii greater than 100m, vehicle speeds when negotiating these curves were more or less the same as when traversing on straight sections of the road. This explains, therefore, the reason why the differences in soil loss between the tangent and curve sections were not statistically significant at 5% probability level.
The Influence of Curve Sharpness on Soil Loss
Out of the total 27 curves measured, 6 had radii <100, 11 had radii between 100-200m and 10 had radii >200m. Although road surface deterioration was observed to be higher on curves with radii greater than 200m, followed by curves with radii less than 100m, and then curves with radii between 100-200m, statistically there was no significant differences in all the three curve classes at 5% probability level (p= 0.2132, p= 0.3509, p=0.1653). The mean soil loss on curves were: 0.0429m3/m, 0.0398m3/m and 0.0458m3/m when the curve radii were <100m, between 100-200m and when >200m respectively (Table 3).
Table 3. Summary statistics on soil loss on different curve radii.
| Statistic | R<1000 | R=100-200 | R>200 |
| Observations | 6 | 11 | 10 |
| Mean | 0.0429 | 0.0398 | 0.0458 |
| p(R>100 Vs R100-200) | 0.2132 | ||
| p(R100-200 Vs R>200) | 0.3509 | ||
| p(R>200 Vs R<100) | 0.1653 | ||
Soil loss was slightly higher on curves with radii >200m due to relatively high vehicle speed which tended to push the surface road materials to the sides and more of the surface materials being lost as dust. For curves with radii <100m, soil loss was slightly higher than on curves with radii between 100 - 200m due to tyre friction which tended to cause more scuffing on the road surface.
The Influence of Road Grade on Road Deterioration
The maximum grade recorded in this study was 9% while the lowest was 0% when traversing loaded. Because of the topographical nature of the area, road grades were classified as follows: Road grades on flat areas were between 1-3%; on gently sloping terrain grades were between 3-6% and on relatively steep areas between 6-9%. The mean soil loss when grades were <3%, 3-6% and >6% were: 0.0419m3/m, 0.0388m3/m and 0.0466m3/m respectively (Table 4). When the means were statistically analysed and tested at 5% probability level, soil loss on steeper grades (>6%) was found to be significantly higher than on flat/gentle slopes (p=0.0361).
Table 4. Summary statistics on soil loss on different
| Statistic | < 3% | 3-6% | > 6% |
| Observations | 11 | 10 | |
| Mean | 0.0419 | 0.0388 | 0.0466 |
| p(0-6% Vs >6% | 0.0361 |
Soil loss on steep grades was higher than in flat/gentle slopes due to high eroding power of water and vehicle brakes (when going downhill) which tended to dig on the road surface and cause road ruts.
As gradient increased, the eroding power of water also increased resulting into soil loss and rutting on the road surface. This means therefore, if road maintenance costs in this forest are to be minimized, roads with grades less than 6% should be constructed whenever the terrain permits.
Soil Loss in Relation to the Cross-Sectional Part of the Road
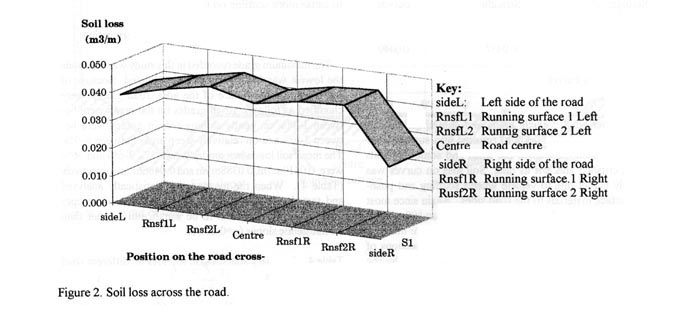
Traffic was considered to be one of the most important factors contributing to soil loss or road deterioration in this study. With more traffic, it was expected that the rate of road deterioration would be higher due to abrasion, crushing and disintegration of the surface materials into dust. Soil loss data collected on different parts of the road cross-section showed that those areas with least traffic loads or passes had minimum soil loss compared with those parts of the road where traffic goes over more often. Figure 2 shows that the least soil loss (0.025m3/m) was on the roadside where traffic rarely goes over, while on the road running surfaces there was more soil loss (0.043m3/m).
Figure 2: Soil loss across the road
Display large image of Figure 2
On the other hand, the centre of the road (where traffic is usually minimum and where surface materials are usually pushed to), had less soil loss (0.041m3/m) than the road running surfaces.
When the volumes of surface layer materials lost in different parts of the road cross-sections were analysed statistically, it was found that there was a significant difference between soil loss on the road sides and on the running surfaces at 5% probability level (p=0.0018).
The difference was also significant between the road side and the centre of the road (p= 0.0382 at 5% probability level). However, despite the running surfaces experiencing more soil loss than the centre of the road, the difference was not significant at 5% probability level (p= 0.3343).
CONCLUSIONS
The study has brought to light, at least in the Tanzanian context, that road alignment and road gradient are important factors to consider when planning and constructing forest roads. The study supported the generally known facts that the difference in soil loss between straight and curve sections of a road is insignificant when the vehicle speed is about 40-50 km/h and most of the road curves are of radii more than 100m.
Also the study confirmed that road material loss on steeper grades is higher than on flat or gentle grades due to an increase in eroding power of water and vehicle brakes which tend to dig and cause ruts on the road surface. The study further confirmed that road surface deterioration or disintegration was influenced by traffic density. Where traffic density or a number of tyre passes was high, the rate of soil loss on the road surface was significantly higher than in those parts of the road where traffic was low.
From this study it can be concluded that in order to minimize the frequency and costs of road maintenance of logging roads in Tanzania, access roads should have minimum number of sharp curves and as far as possible steeper grades should be avoided.
ACKNOWLEDGMENT
The authors greatly acknowledge Sokoine University of Agriculture for funding this study. Appreciation is also expressed towards institutions or individuals who in one way or the another contributed to the success of this study. The cooperation and material support provided by Sao Hill Forest Project is highly appreciated.
AUTHOR CONTACT
Dr. Duncan Shemwetta can be reached by email at --
fengine@suanet.ac.tz
REFERENCES
[1] Abeli, W.S. 1985. Forest road planning and control by mathematical programming and time study analysis. Unpublished. Ph.D. thesis. Sokoine University of Agriculture, Tanzania. 229p.
2] Abeli, W.S. and R.E.L. Ole-Meiludie. 1990. Estimation of truck hauling costs in mountainous forest areas. Forest Record No. 46. Faculty of Forestry, Sokoine University of Agriculture, Morogoro. Tanzania. 20p.
[3] Dykstra, D.P. and R. Heinrich. 1996. FAO model code of forest harvesting practice. Food and Agriculture Organisation of the United Nations. Rome. 85p.
[4] Kirenga, R.M., W.S. Abeli and R.E.L. Ole-Meiludie. 1986. Construction and maintenance of access roads in the SUA training forest. Tanzania Association of Foresters Journal, Vol 7:22-29.
[5] Migunga, G.A. 1996. Productivity, costs and soil disturbance by log skidding tractors at Sao Hill, Tanzania. Unpublished Ph.D. thesis. Sokoine University of Agriculture, Morogoro, Tanzania. 185p.
[6] Morris, J.M. 1990. Earth roads. A practical manual for the provision of access for agricultural and forestry projects in developing countries. Cranfield Press, Bedford, U.K. 262p.
[7] Stenzel, G., T.A. Walbridge, and J.K. Pierce. 1985. Logging and pulp production. Second Edition, John Wiley & Sons. New York. 358p.
[8] Sessions, J. and R. Heinrich. 1993. Forest roads in the tropics. Tropical forestry handbook Vol. 2. Pancel, L. (Ed.). Springer-belg, Berlin, Germany pp 1270-1323.
[9] Silloh, E.P. 1978. Effect of gradients, drainage system and other factors on the quality of existing forest main roads in Meru Forest Project. Unpublished Special Project. University of Dar-es-Salaam, Morogoro, Tanzania.