
Display large image of Figure 1
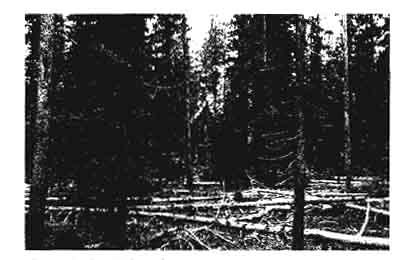
Figure 1. Conditions in one of the study units.
January 2001. Vol 12, No. 1
Erik S. Drews
University of Idaho
Moscow, ID
James A. Doyal
Ward Northwest, Inc.
Florence, OR
Bruce R. Hartsough
University of California
Davis, CA
Loren D. Kellogg
Oregon State University
Corvallis, Oregon
ABSTRACT
Two harvesting systems were compared for reducing fuel loadings in overstocked conifer stands in eastern Oregon; forest managers also set a high priority on minimizing soil disturbance. Both employed cut-to-length (CTL) harvesters; one used a forwarder and the other a small skyline yarder. Both systems produced very similar and acceptable results in terms of fuels reduction and soil disturbance, but at different stump-to-mill costs: $46/green ton for the forwarder system versus $80/green ton for the yarder system.
Keywords: thinning, cut-to-length, harvester, forwarder, skyline, eastern Oregon, yarder.
INTRODUCTION
Many forested areas in the western USA have heavy accumulations of fuel, due primarily to the suppression of fire during the last century, where fire was ubiquitous in the past [1]. Managers recognize the need to decrease fuel levels, and thinning provides an option to meet this objective. But managers also wish to avoid the detrimental impacts to the soil and residual stand associated with traditional harvesting practices [19].
The traditional harvesting method for small diameter material on slopes up to 30-50% includes mechanized felling and bunching followed by whole-tree skidding. In thinning operations, however, whole-tree skidding has been associated with high levels of residual stand damage. Skidding also disturbs the soil; one study of 11 timber sales in eastern Oregon found detrimental levels of compaction or displacement on up to a third of the harvested area [7].
A number of studies have reported on the use of cut-to-length (CTL) harvester-forwarder systems for partial cutting on the west coast of North America [3, 8, 12, 16, 17]; these systems are generally acknowledged to produce lower levels of stand damage and soil disturbance than does whole-tree skidding.
The Blue Mountains of eastern Oregon are good examples of where fuel buildup is a major problem, and where soil disturbance is a key issue. In a recent study in the Blue Mountains (the Deerhorn project), a CTL harvester that debranched, bucked and topped was combined with a skyline yarder. This system reduced fuel loading by one-third, and disturbed only 5-10% of the soil area [14]. The system made a profit, but was expensive compared to ground-based operations [4, 11]. Few other studies of mechanized felling or harvesting in combination with cable yarding have been reported [9, 10, 13].
Ground-based equipment provides lower-cost alternatives to skyline yarding if conditions allow it and if environmental impacts can be kept within acceptable limits.
To build on the Deerhorn results and to compare ground-based CTL and skyline CTL systems, the Limber Jim Fuels Reduction Project was conducted. The primary management objective was to reduce the potential for crown fires by creating a landscape-level fuel break. Because of the proximity of salmon-bearing streams, another key objective was to minimize soil disturbance and thereby prevent sediment transport to the streams.
The overall objective of the Limber Jim research project was to provide forest managers with information on the costs and environmental impacts for the ground-based and skyline systems. It was an interdisciplinary research effort that included studies of harvest operations and their effects on residual stands, soils, soil biota and wildlife habitat. The primary objective of this portion of the study was to estimate the productivities and costs of the stump-to-mill activities for the forwarder and yarder systems under similar conditions. Soil, wildlife and residual tree impacts have been reported elsewhere [2, 5, 15, 20]; longer-term results will be forthcoming.
APPROACH
Site Description and Treatment Prescription
The Limber Jim study area was located on the La Grande Ranger District of the Wallowa-Whitman National Forest in the Blue Mountains of northeastern Oregon. Six harvest units were located on a ridge separating the Upper Grande Ronde drainage and the La Grande municipal watershed. Because the ridgetop would serve a pivotal function in efforts to contain fires in either watershed, the fuel reduction project would avoid potential resource damage that could result from building traditional fuel breaks during a wildfire.
Soils in the units ranged from very shallow on bedrock to deep volcanic ash. The slopes averaged 12% or less on all units, with maximums of 25%.
Some stands were mixed conifer including grand fir (Abies grandis), western larch (Larix occidentalis) and Douglas-fir (Pseudotsuga menziesii var. glauca), while others were primarily lodgepole pine (Pinus contorta). Insect attacks by the mountain pine beetle (Dendroctonus ponderosae) and the western spruce budworm (Choristoneura occidentalis) had severely damaged many of the stands, resulting in high percentages of standing dead or down trees (Figure 1). The Limber Jim units had some of the highest fuel loadings in the local area; fuel accumulations defined as all dead material, standing or down averaged 125 dry tons per hectare.
Display large image of Figure 1
Figure 1. Conditions in one of the study units.
The primary goal was to reduce fuel loadings by half. Although treatment prescriptions varied somewhat from unit to unit, all standing dead and down trees in the 10-38 cm DBH range were to be removed, along with some live trees in the same diameter range. Live trees were either leave-tree marked or cut-tree marked, depending on the unit. Since most of the removals were dead and/or small, the primary product was chips for oriented strandboard. Some sawlogs were produced from the larger living trees.
Harvesting Systems
The study units were not steep enough to require a skyline system, but one was used because it was seen as a low impact approach compared to traditional whole-tree skidding and therefore in keeping with a key objective of the study. A forwarder CTL system was selected as the ground-based system. (One unit was also thinned with a CTL harvester and a skidder, so that soil impacts could be compared with those of the two primary systems.) Both systems were expected to produce less soil disturbance than with whole-tree skidding, due to a) the mat of slash deposited on the trails by the harvesters and b) full or one-end suspension of the logs by the forwarder or yarder.
Layout. The National Forest sale administrator and the loggers located landings and planned the general layout of the harvester trails and yarding corridors. The National Forest required harvesting trails to be spaced at approximately 20 m on center. On the forwarder units, the harvester operators located trails as they worked. For the skyline units, the logger premarked the skyline corridors (at approximately 60-m intervals) and the trees to be used for intermediate supports and guyline anchors. Between the designated skyline corridors, the harvester operators located intermediate trails as they worked.
Harvesting. The two harvesters used with both systems were Hitachi 200LC excavators fitted with Keto 500 harvesting heads. One operator was experienced and very competent, the other less familiar with the equipment but still reasonably competent. The two operators worked together in all the test units. The harvesting was similar for both systems, with minor differences. In the forwarder units, logs were cut to 5-m lengths and placed where convenient on either side of the trail. On the skyline units the logs were cut to longer lengths (averaging 7 m) and placed in choker-sized bunches that were angled towards the skyline corridor.
Forwarding and Yarding. The forwarder system employed a single 12-ton Valmet 646 and one operator. The skyline system was a six-man, two-machine operation. Equipment included a Diamond D210 3-drum swing yarder with an Eaglet motorized slackpulling carriage, and a John Deere 690 knuckleboom loader. The crew included the yarder engineer, loader operator, a chaser, rigging slinger, choker setter, and a hooktender who prerigged corridors. (A Cat 518 rubber-tired grapple skidder was used in the one skidder unit.)
Chipping. A Morbark 27-inch disk chipper processed most of the logs from both systems. It sorted and decked the occasional sawlog as it worked. Since the chipper was working in several units, it was sometimes fed hot, and at other times processed logs from cold decks. Chipper pro duction was reduced as a result of the half an hour or so lost each time the machine was moved between units, up to three times per day. Production, however, was limited to eight truckloads of chips per day by the mill, and this was the more constraining factor.
Loading. Sawlogs comprised only a small fraction of the tonnage removed, and all sawlogs were loaded from the decks after chipping was completed.
Trucking. The trucking contractor charged a flat rate ($397/load) to haul from the site to the mill (15 off-highway miles and 100 on-highway km).
The harvest operations occurred between June 1996 and August 1997.
Study Methods
The six harvest units were grouped into three pairs; each unit in a pair had characteristics that were as similar as possible. One unit from each pair was randomly assigned to either the forwarder or the skyline system.
The two systems were studied using a combination of shift-level reports, detailed time-motion studies, and weight and/or volume records of truck loads by product. A stump-to-mill cost was determined by summing together the costs of the operations: layout (skyline system only), harvesting, yarding, chipping (chiplogs), loading (sawlogs), and trucking. The cost for each operation was based on operater-reported scheduled hours (SH) of machine operation combined with a cost per SH for each machine. (No shift-level data were recorded for sawlog loading, so a typical rate of 27 green tons per SH was assumed.) Hourly costs were calculated using the machine rate approach [18]. No allowance was made for profit or risk. Purchase prices, machine lives, labor costs and resulting hourly costs are displayed in Table 1.
Table 1. Machine cost assumptions.
| Machine | Price ($) | Life (years) | Wages ($/hr) | Total ($/SH) |
| Harvester | 235,000 | 5 | 19 | 114 |
| Forwarder | 194,000 | 5 | 18 | 80 |
| Yarder | 407,000 | 5 | 142 | 230* |
| Loader | 250,000 | 7 | 17 | 73 |
| Chipper | 260,000 | 7 | 17 | 93 |
* Total cost for yarding was $303/SH, which included the yarder and the loader costs.
RESULTS AND DISCUSSION
Removals
Harvested trees averaged 18 cm in diameter. Based on time-motion studies of the harvesters, the operations removed approximately 55% down, 26% standing dead, and 19% live trees. More than 80% of the trees removed were dead; this and the small average diameter are reflected in the high proportion of chip tons to sawlog tons. Sawlogs represented less than 10% of the total tonnage removed (Table 2).
Table 2. Harvest areas and removals per hectare.
| Forwarder | Skyline | |
| Area, ha | 20 | 17 |
| Removals: Trees/ha |
750 | 650 |
| Average DBH, cm | 18 | 18 |
| Chip green tons/ha | 121 | 94 |
| Sawlog green tons/ha | 9 | 13 |
On the skyline units, sawlogs represented a greater proportion of the tonnage removed (12% versus 6% for the forwarder), but this was due to differences in stand characteristics rather than to system differences.
Stump-to-Mill Costs
Table 3 summarizes the production rates and costs per ton for each operation. The latter were calculated by dividing the total cost of an operation by the total tonnage of chips and sawlogs so that the column could be summed to give total cost per overall ton. (Costs per cunit can be approximated by using a factor of 0.7 green tons per cubic meter. This is only an estimate because none of the material was scaled and the specific gravity was highly variable due to the mix of live and dead trees that were harvested.)
As expected the forwarder system had a lower cost an average of $46 per green ton than the $80 per green ton for the skyline system.
Table 3. Production rates and costs per green ton.
| Forwarder | Skyline | |||
| Operation | Tons/SH | $/ton | Tons/SH | $/ton |
| Layout | 1.52 | |||
| Harvesting | 8.1 | 14.18 | 5.4 | 21.30 |
| ForwardingYarding | 12.2 | 6.54 | 9.3 | 32.56 |
| Chipping | 18.0 | 4.85 | 18.0 | 4.55 |
| Loading | 27.2 | 0.17 | -* | |
| Trucking | 20.01 | 20.01 | ||
| Stump-to-Mill | 45.73 | 79.93 | ||
* Included with yarding cost
Layout. The layout cost applied only to skyline units, where skyline corridors were flagged and guyline and support trees marked before harvesting. On the forwarder units, the Sale Administrator approved the layout of the harvest trails, but they were not premarked.
Harvesting. Time-motion study results for the harvester and other equipment are included in the Appendix. Harvesting contributed about a quarter to a third of the total stump-to-mill cost for either system. When processing for the forwarder system the harvester worked in an ideal manner, i.e., placing logs on either side of the machine. The harvesting was slower for the skyline system due to the time spent placing logs in choker-sized bunches and aligning bunches towards the skyline corridor. Also, for the trails cut between the yarding corridors, logs were decked only on the side of the trail opposite the corridor so the ends nearest the corridor would be aligned for choking. It cost $21/ton to harvest the skyline units and only $14/ton for the forwarder units.
Forwarding vs. Yarding. The greatest difference in cost was in forwarding versus yarding: $7/ton versus $33/ton. This reflected the greater hourly expense for the skyline system. In addition, the forwarder produced an average of 12 tons/SH versus 9 tons/SH for the cable yarder.
Chipping. Chipping cost, at $5/ton, accounted for 10% or less of the total cost for either system. The mill quota of 8 chip loads per day, was less than the capacity of the chipper, and therefore increased the chipping cost somewhat.
Loading. The loading of sawlogs onto trucks contributed a negligible expense due to the low proportion of sawlogs. This cost was only $0.17/ton when spread over total tonnage produced on the forwarder units.
Trucking. Trucking cost $20/ton, representing 44% of the total cost for the forwarder system and 25% of that for the skyline system.
Unit-to-Unit Comparison
The units represented ranges of stand and terrain conditions, and over these ranges the forwarder system had relatively uniform harvesting costs compared to those for the skyline (Table 4). Between units, the stump-to-mill cost for the forwarder system varied less than 10%, while that for the skyline system varied 30%; the yarding cost for the forwarder units varied 25% while that for the skyline units varied 60%.
Table 4. Forwarding vs. yarding costs by unit.
| Forwarding cost ($/ton) |
Yarding cost ($/ton) |
Stump-to-Mill cost ($/ton) |
|
| Unit | |||
| 4-F | 6.03 | 45.02 | |
| 4-S | 45.14 | 92.42 | |
| 11-F | 6.83 | 45.64 | |
| 11-S | 29.68 | 78.75 | |
| 16-F | 7.71 | 48.72 | |
| 16-S | 24.39 | 67.80 |
Comparing the paired units (Table 5) shows some differences in the pairings and reveals some factors that may have affected the harvesting cost. Units 11-F and 11-S were well-matched units of similar size, shape and slope; these units had intermediate values of harvesting cost. Units 4-F and 4-S differed primarily in that the forwarder traveled loaded uphill while the skyline yarded downhill. The 4-F and 4-S units were shorter and wider than 11-F and 11-S. For the forwarder, the shorter distance decreased travel time and cost. For the yarder, the lower volume per setup offset the shorter inhaul and outhaul times and may have resulted in the higher cost. On units 16-F and 16-S, both systems yarded uphill, and used trail or corridor patterns that differed from those on the other units. The forwarder used side-trails so it could travel straight up and down the steeper (up to 25%) slopes. These side-trails were all forwarded downhill. The side-trails and the longer, narrower unit shape increased travel distance and cost for the forwarder. On unit 16-S, the skyline yarded from only one landing and used a radial pattern of corridors. Deflection was adequate on this unit, without intermediate supports. This configuration was the most efficient for the skyline system. The cost, however, at $24/ton was still more than three times the cost of forwarding on unit 16-F. Furthermore, the radial corridor pattern was inconsistent with the objective of using parallel corridors, since it disturbed a larger percentage of the area near the landing.
Table 5. Unit characteristics.
| Unit | Area (ha) | Avg/Max Yarding Dist (m) | Avg. Slope (5) | Extract Direction |
| 4-F | 7.3 | 160/240 | 12 | Uphill |
| 4-S | 5.1 | 80/195 | 12 | Downhill |
| 11-F | 9.7 | 220/325 | 2 | Flat |
| 11-S | 9.3 | 155/330 | 2 | Flat |
| 16-F | 2.8 | 145/250 | 12 | Uphill* |
| 16-S | 2.6 | 120/205 | 12 | Uphill |
* Included some downhill with slopes of 15-25%.
Gross and Net Revenue
The primary product from the sale was chips for oriented strandboard, with the only other product being sawlogs. Delivered values for chips were $89/dry ton, equivalent to $65 per green ton for the average moisture content of 37% (dry basis). Sawlogs were worth $95 per green ton ($425/MBF) at the mill. When averaged by the weight fractions of each product, the total gross revenue was about $68 per green ton (Table 6). Subtracting the stump-to-mill costs, the forwarder system gave a net revenue of $21 per ton. In contrast, the skyline lost $11 per ton.
Table 6. Revenue per green ton and per hectare.
| Forwarder | Skyline | |||
| $/ton | $/ha | $/ton | $/ha | |
| Gross Revenue | ||||
| Chips | 65 | 7860 | 65 | 6210 |
| Sawlogs | 95 | 750 | 95 | 1240 |
| Total | 67 | 8610 | 69 | 7440 |
| Net Revenue | ||||
| Total | 21 | 2750 | -11 | -1180 |
Environmental Impacts
Fuels Reduction. An average of 119 green tons per hectare were removed of which about 80% was down-dead or standing-dead trees. The management objective of reducing the fuels loading by about half was achieved for both systems, with no significant differences between the removal percentages [15].
Soil Disturbance. There was no significant difference in soil disturbance a combination of compaction and displacement between the two systems. Only about 6-7% of the harvested area was detrimentally disturbed with either system, compared to the 21% that resulted in the single CTL skidding unit, and much less than the Forest Service guideline of 15%. The type of disturbance, however, was different; the forwarder tended to produce more compaction (1.7% versus 0.2%), while skyline yarding created more displacement (7% versus 4%) [15]. After one year, there was no off-unit sediment transport, with the exception of very limited amounts from skyline corridors [2].
Marten habitat. Bull and Blumton [5] found that the 50% fuels reduction caused a decline in numbers of prey (voles, hares and squirrels) for American martens. The removal of layered down logs also reduced the structure that produces subnivean habitat for martens and some prey species during the winter. A combination of treated and untreated areas would provide fuel breaks while still retaining marten habitat.
Residual Stand Damage. Plots containing a total of almost 13,000 residual trees were assessed, and damage of some type occurred to 32% of the trees [20]. Only small differences most of them not significant - were found between the forwarder and yarder systems.
Comparison of Harvest Systems
Forwarder CTL. Under the circumstances at Limber Jim (flat to rolling terrain, and small, low-value logs), the CTL harvester and forwarder system is probably ideal. The forwarder used the trails created by the harvester, which allowed the harvester to work efficiently by placing logs on either side of the trail. The forwarder could easily handle small diameter logs, loading several at once. Although it takes somewhat longer to fill the forwarder bunk with smaller logs, the travel time in and out of the woods is unaffected by log size, yielding only a small change in total cycle time. As a forwarder travels methodically along a trail at only walking speeds (5-8 km/h) it creates limited soil disturbance.
Skyline CTL System. The conditions at Limber Jim were not ideal for a skyline yarder since most units required intermediate supports and the log sizes were very small. Skyline systems are at their best when they can retrieve a full-capacity load (larger, longer logs) on each turn. The harvester worked more slowly on the skyline units due in part to the greater attention and effort required to build choker-sized bunches of the small logs and to align the logs towards the skyline corridors. Skyline CTL systems can be economically successful, as was shown in the Deerhorn project [4], which had a higher percentage of sawlogs. However, as shown by the Limber Jim project, lower cost systems can meet the management objectives that are commonly associated with skyline systemsespecially, low impacts to soils. Conditions that would favor a skyline over a forwarder include steeper slopes (maxi mums over 30 to 40%), the need to move logs over sensitive areas such as riparian zones, or where longer logs are desired due to value differential.
A recent study on the Colville National Forest in eastern Washington also compared forwarder CTL and skyline CTL systems, although on steeper slopes (35-55%) [10]. Stump-to-landing costs per unit volume for the skyline system were two to four times those for the forwarder system, although skyline yarding distance was also two to four times as long as for the forwarder.
Forest Management Implications
Specifying Timber Sales. Managers should choose the least-cost harvest system that is feasible and will meet all the management objectives. Part of the motivation for the project was to test low-impact harvesting equipment not commonly found in this region until recently: small log CTL harvesters, forwarders, and small yarders utilizing intermediate supports. Each of these machines is relatively expensive to purchase, so loggers are necessarily cautious about investing in new equipment unless they can count on a steady stream of work. Thus, if forest managers intend to specify either of these CTL harvest systems in the future, they need to consider the long-term needs of the local harvesting contractors.
Possible Changes to Harvest Systems. For conditions like those on the Limber Jim project, there are several changes that may offer economic and/or environmental benefits. These include using: a) a larger forwarder, b) a harvester with a longer reach to increase trail spacing, and c) both a forwarder and a skyline to yard the same corridors/trails when on varied terrain.
CONCLUSIONS
The harvester-forwarder system cost one-fifth as much per ton as did the harvester-yarder system. By using in-woods CTL processing, widely spaced (20 m) harvester trails, and log suspension (by either forwarder or skyline), fuel reduction can be achieved with only minimal soil disturbance. Furthermore, both systems harvested in a neat manner that was barely apparent after completion and that required no remediation worklanding cleanup, water bar installation on skid trails, or piling or dispersion of slash.
ACKNOWLEDGEMENT
This research was funded in part by the USDA Forest Service Pacific Northwest Research Station under Cooperative Agreement PNW 92-0240.
AUTHOR CONTACT
Bruce Hartsough can be reached by e-mail at
brhartsough@undavis.edu
REFERENCES
[1] Agee, J.K. 1993. Fire ecology of Pacific Northwest Forests. Island Press,
Washington, D.C. 493 p.
[Return to text]
[2] Allen, M.M., M. Taratoot and P.W. Adams. 1999. Soil compaction and disturbance
from skyline and mechanized partial cuttings for multiple resource objectives
in western and northeastern Oregon, U.S.A. IN: J. Sessions and W. Chung (eds.)
Proc. of the International Mountain Logging and 10th Pacific Northwest Skyline
Symposium. Corvallis, OR. March 28 April 1. Department of Forest Engineering,
Oregon State University. pp.107-117.
[Return to text]
[3] Barbour, R.J., J.F. McNeel, S. Tesch and D.B. Ryland. 1995. Management
and utilization of mixed species, small-diameter, densely stocked stands. IN:
Proc. of the 1995 Council on Forest Engineering Annual Meeting. pp. 187-195.
[Return to text]
[4] Brown, C.G. and L.D. Kellogg. 1996. Harvesting economics and wood fiber
utilization in a fuels reduction project: a case study in eastern Oregon. Forest
Products Journal 46(9):45-52.
[Return to text]
[4] Brown, C.G. and L.D. Kellogg. 1996. Harvesting economics and wood fiber
utilization in a fuels reduction project: a case study in eastern Oregon. Forest
Products Journal 46(9):45-52.
[Return to text]
[5] Bull, E.L. and A.K. Blumton. 1999. Effects of fuels reduction on American
martens and their prey. Res. Note PNW-RN-539. USDA Forest Service Pacific Northwest
Research Station, Portland, OR. 9 p.
[Return to text]
[5] Bull, E.L. and A.K. Blumton. 1999. Effects of fuels reduction on American
martens and their prey. Res. Note PNW-RN-539. USDA Forest Service Pacific Northwest
Research Station, Portland, OR. 9 p.
[Return to text]
[6] Doyal, J.A. 1997. The Limber Jim case study: production and economics
of line logging in a thinning/fuels reduction setting of mixed conifer stands
in the Blue Mountains of Northeastern Oregon. Master of Forestry paper. Oregon
State Univ., Corvallis. 112 p.
[Return to text]
[7] Geist, J.M., J.W. Hazard and K.W. Seidel. 1989. Assessing physical conditions
of some Pacific Northwest volcanic ash soils after forest harvest. Soil Science
Society of America Journal 53:946-950.
[Return to text]
[8] Hartsough, B.R., E.S. Drews, J.F. McNeel, T.A. Durston and B.J. Stokes.
1997. Comparison of mechanized systems for thinning ponderosa pine and mixed
conifer stands. Forest Prod. Journal 47(11/12):59-68.
[Return to text]
[9] Howe, D.L. 1994. The application of a skyline yarding technique in the
harvesting of ecologically sensitive flat terrain sites. Proc. of the 17th Annual
Meeting of the Council on Forest Engineering, Portland/Corvallis, Oregon, 24-29
June. pp. 124-134.
[Return to text]
[10] Johnson, L.R. 1999. Combining cut-to-length and cable operations. IN:
J. Sessions and W. Chung (eds.) Proceedings, International Mountain Logging
and 10th Pacific Northwest Skyline Symposium. Corvallis, OR. March 28 April
1. Department of Forest Engineering, Oregon State University. pp.43-52.
[Return to text]
[11] Kellogg, L.D. and C.G. Brown. 1995. Using a single-grip harvester and
skyline yarding system in a forest health improvement application. IN: Sustainability,
Forest Health & Meeting the Nations Needs for Wood Products. Proceedings of
the 18th Annual Meeting of the Council on forest Engineering, June 5-8, Cashiers,
NC. pp. 130-142.
[Return to text]
[12] Kellogg, L.D. and P. Bettinger. 1994. Thinning productivity and cost for
a mechanized cut-to-length system in the Northwest Pacific Coast region of the
USA. Journal of Forest Engineering 5(2):43-54.
[Return to text]
[13] Kirk, R.J. and L.D. Kellogg. 1990. Mechanized felling on a cable logging
operation. IN: Proceedings of the 13th Annual Meeting of the Council on Forest
Engineering, August 12-16, Outer Banks, NC. pp. 168-174.
[Return to text]
[14] McIver, J. 1995. Deerhorn fuels reduction: economics and environmental
effects. Tech Notes BMNRI-TN-6. Blue Mountains Natural Resources Institute,
La Grande, OR. June. 6 p.
[Return to text]
[15] McIver, J. 1998. Economics and environmental effects of fuel reduction
at Limber Jim. Tech Notes BMNRI-TN-10. Blue Mountains Natural Resources Institute,
La Grande, OR. April. 12 p.
[Return to text]
[15] McIver, J. 1998. Economics and environmental effects of fuel reduction
at Limber Jim. Tech Notes BMNRI-TN-10. Blue Mountains Natural Resources Institute,
La Grande, OR. April. 12 p.
[Return to text]
[15] McIver, J. 1998. Economics and environmental effects of fuel reduction
at Limber Jim. Tech Notes BMNRI-TN-10. Blue Mountains Natural Resources Institute,
La Grande, OR. April. 12 p.
[Return to text]
[16] McNeel, J.F. and D. Rutherford. Modelling harvester-forwarder system performance
in a selection harvest. Journal of Forest Engineering 6(1):7-14.
[Return to text]
[17] Mitchell, J.L. and I.B. Hedin. 1995. Compendium of commercial thinning
operations and equipment in western Canada. Special Report SR-108, Forest Engr.
Res. Inst. of Canada, Vancouver, BC. December.
[Return to text]
[18] Miyata, E.S. 1980. Determining fixed and operating costs of logging equipment.
USDA Forest Service General Technical Rep. NC-55.
[Return to text]
[19] Mutch, R.W., S.F. Arno, J.K. Brown, C.E. Carlson, R.D. Ottmar and J.L.
Peterson. 1993. Forest health in the Blue Mountains: a management strategy for
fire-adapted ecosystems. Gen. Tech. Rep. PNW-GTR-310. USDA Forest Service Pacific
Northwest Research Station, Portland, OR. 14 p.
[Return to text]
[20] Youngblood, A. 2000. Damage to residual trees and advance regeneration
from skyline and forwarder yarding in mixed-conifer stands of northeastern Oregon.
Western Journal of Applied Forestry 15(2):101-107.
[Return to text]
[20] Youngblood, A. 2000. Damage to residual trees and advance regeneration
from skyline and forwarder yarding in mixed-conifer stands of northeastern Oregon.
Western Journal of Applied Forestry 15(2):101-107.
[Return to text]
Appendix. Time-motion study results.
All variables in the regression relationships were highly significant (p<0.01), except where noted.
| Harvester | |||
| Mean (range) | Std.Dev. | # Obs | |
| Cycle time elements: | |||
| Move | 19.7 (2-115) | 17.2 | 331 |
| Brush | 0.9 (0-200) | 8.7 | 2160 |
| Swing | 15.2 (0-98) | 10.9 | 2046 |
| Fell | |||
| for down trees | 0 | 0 | 1147 |
| for standing trees | 7.7 (0-73) | 6.8 | 933 |
| Process | 25.5 (0-218) | 16.8 | 2152 |
| Distance, m | 2.2 (0.3-6) | 1.2 | 331 |
| Slope, % | 11.2 (0-35) | 10.1 | 331 |
| TreesPerMove | 6.5 | ||
| DBH, cm | 18.4 (8-48) | 6.5 | 2046 |
| LogsPerTree | 1.88 (1-7) | 0.95 | 2136 |
| DelayFraction | 0.126 |
| Move = 3.44 + (1.22 + 1.02*Yarder + 0.121*Slope)*Distance | r2 = .50 | n = 331 |
| Swing = 14.59 + 0.107*DBH 2.38*Down | r2 = .02 | n = 1994 |
| Fell (for standing trees) = 2.67 + (0.186 - 0.039*Dead + 0.241*Yarder)*DBH | r2 = .28 | n = 897 |
| Process = -4.30 + 0.828*DBH + (6.50 -1.17*Dead + 2.11*Down+1.66*Yarder)*Logs | r2 = .41 | n = 1994 |
| Logs = -0.78 + (0.841 - 0.073*Dead - 0.151*Down 0.207*Yarder)*DBH0.5 | r2 = .45 | n = 1994 |
Productive Time, cmin/tree = (Move/TreesPerMove + Brush + Swing + Fell + Process)
* (1 + DelayFraction)
where:
Move, cmin/move = travel between harvesting stops
Brush, cmin/tree = move unmerchantable material
Swing, cmin/tree = swing the boom to and grapple the next tree
Fell, cmin/tree = cut and drop a tree
Process, cmin/tree = delimb and buck
Distance, m = straight line distance traveled between endpoints of a Move
TreesPerMove = average number of trees harvested between moves
DBH, cm = diameter at breast height
Yarder = 1 if harvesting for the yarder, = 0 if for the forwarder
Down = 1 if the tree is on the ground, = 0 if the tree is standing
Dead = 1 if the tree is dead, = 0 if the tree is live
Logs = the number of merchantable logs cut from the tree
DelayFraction = productive delays, as a fraction of cycle element time
| Forwarder | |||
| Mean (range) | Std.Dev. | # Obs | |
| Cycle time elements: | |||
| TravelEmptyOnRoad | 47. (5-180) | 28. | 124 |
| TravelEmpty | 115. (13-411) | 80. | 204 |
| TravelLoaded | 186. (13-548) | 144. | 174 |
| Load | 1270. (309-2328) | 264. | 130 |
| TravelInWoods | 115. (8-324) | 64. | 124 |
| TravelLoadedOnRoad | 65. (6-145) | 28. | 123 |
| Unload | 765. (169-1470) | 232. | 129 |
| RoadDistance | 43. (2-94) | 27. | 124 |
| TEDist | 94. (4-125) | 73. | 204 |
| TLDist | 90. (3-296) | 70. | 174 |
| Slope | 3.4 (-19 - 21) | 8.7 | 174 |
| AvgWood Location | 113. (0-318) | 78. | 130 |
| LoadVolume | 13.3 | ||
| LoadFraction | 0.96 (0.1 - 1) | 0.13 | 131 |
| LogVolume | 0.106 (0.07-0.20) | 0.021 | 131 |
| Logs | 126. (10-190) | 30. | 131 |
| WoodsDist | 31. (5-90) | 18. | 124 |
| LocationRange | 23. (0-67) | 13. | 124 |
| MultipleCorridor | 0.081 (0-1) | 0.273 | 124 |
| Cold | 0.83 (0-1) | 0.37 | 132 |
| SawlogFraction | 0.021 (0 - 0.16) | 0.031 | 129 |
| DelayFraction | 0.067 |
| TravelEmptyOnRoad = 11.2 + 0.853*RoadDistance | r2 = .64 | n = 124 |
| TravelEmpty+TravelLoaded = 103. + 2.66*AvgWoodLocation + 0.0384*AvgWoodLocation*Slope | r2 = .80 | n = 130 |
| TravelEmpty = 14.3 + 1.10*TEDist - 0.00663*TEDist*Slope | r2 = .91 | n = 204 |
| TravelLoaded = 17.9 + 1.56*TLDist + 0.0551*TLDist*Slope | r2 = .98 | n = 174 |
| Load = 236. + 1550.*LoadFraction 4540.*LoadFraction*LogVolume | r2 = .45 | n = 130 |
| TravelInWoods = 51.2 + 2.47*LocationRange + 90.8*MultipleCorridor | r2 = .43 | n = 124 |
| TravelInWoods = 21.9 + 3.04*WoodsDist | r2 = .74 | n = 124 |
| TravelLoadedOnRoad = 36.8 + 0.650*RoadDistance | r2 = .34 | n = 123 |
| Unload = -162. + 852.*LoadFraction + 5105.*Cold*SawlogFraction | r2 = .68 | n = 129 |
Productive Time, cmin/load = (TravelEmptyOnRoad + TravelEmpty+TravelLoaded
+ Load + TravelInWoods + TravelLoadedOnRoad + Unload) * (1 + DelayFraction)
where:
TravelEmptyOnRoad, cmin/load = move on the road from the deck to the corridor
TravelEmpty, cmin/load = move along the corridor until the first stop to load
TravelLoaded, cmin/load = move along the corridor from final loading point to
the road
Load, cmin/load = time to swing, grapple and load logs
TravelInWoods, cmin/load = time to move with a partial load, between Load elements
TravelLoadedOnRoad, cmin/load = move on the road from the corridor to the deck
Unload, cmin/load = time to unload logs, including any travel between decks
RoadDistance, m = distance along the road between the deck and corridor
TEDist, m = distance along the corridor from the road to the first load point
TLDist, m = distance along corridor from last load point to the road
AvgWoodLocation, m = straight line distance between the road and the average
log location
Slope, % = average slope between loading point and the road; + means uphill
to road
LoadFraction = the fraction of a full load that was accumulated
LogVolume, m3 = average volume per log
LocationRange, m = the distance over which logs were collected. For example,
if the first logs were picked up at 130 m from the road and the last at 110
m, the LocationRange = 20 m
MultipleCorridor = 1 if a load is collected from more than one trail, = 0 if
from one trail
WoodsDist, m = actual total distance traveled between all Load elements
Cold = 1 if logs are cold-decked, = 0 if unloaded at the chipper
SawlogFraction = number of sawlogs / total logs in the load
LoadVolume, m3 = volume for a full load
DelayFraction = productive delays, as a fraction of cycle element time
| Yarder [6] | |||
| Mean (range) | Std.Dev. | # Obs | |
| TotalTurnTime | 307. (51-638) | 97. | 384 |
| YardingDistance | 105. (12-240) | 54. | 384 |
| LateralDistance | 9.4 (0.3-43) | 6.4 | 384 |
| Logs | 11.F (2-35) | 3.8 | 384 |
| Chokers | 3.0 (1-6) | 0.39 | 384 |
| ChokerSetters | 2.3 (1-3) | 0.57 | 384 |
| RoadChangeTime | 73.5 (30-150) | ||
| RoadLength | 212. (82-357) |
TotalTurnTime = 145.5 + 0.00517*YardingDistance2 + 2.10*LatDist + 0.0838*LatDist2 (p=0.04) (p=0.03)
+ 43.8*Chokers 26.1*ChokerSetters 45.9*Preset
r2 = .71 n = 384
where:
TotalTurnTime, cmin = productive time per turn, including delays less than 10
minutes
YardingDist, m = distance along yarding corridor from landing to turn
LatDist, m = average distance from corridor centerline to choke points
Logs = number of logs yarded on a turn
Chokers = number of chokers used on the turn
ChokerSetters = number of choker setters
Preset = 1 if chokers are preset, = 0 if not preset
RoadChangeTime, min = time to rerig the yarder from one corridor to the next
RoadLength, m = distance from landing to back boundary of cutting unit
| Chipper | |||
| Mean (range) | Std.Dev. | # Obs | |
| ChippingTime | 3002. (2034-4132) | 560. | 18 |
| LoadWeight | 19.6 (15.8-23.0) | 2.03 | 20 |
| Logs | 371. (268-523) | 68. | 20 |
| LogWeight | 54. (37-63) | 7.3 | 20 |
| DelayFraction | 0.111 | ||
| ExchangeTruck | 534. (79-1266) | 418. | 10 |
ChippingTimePerTon = 226. 1.31*LogWeight r2 = .12 n = 18
(p=0.16)
ProductiveTime, cmin/green ton = ChippingTimePerTon * (1 + DelayFraction)
+ ExchangeTruck/LoadWeight
where
ChippingTime, cmin/load = chipping time per load
ChippingTimePerTon, cmin/green ton = chipping time divided by load weight
LoadWeight, tons = green weight per load
Logs = number of logs chipped per load
LogWeight, kg = average green weight per log
DelayFraction = productive delays, as a fraction of chipping time
ExchangeTruck, cmin/load = time to pull a full van away and move in an empty
van
Tree Volume
m3/tree = -0.104 + 0.000948*DBH2
r2 = 0.98 n = 60
for DBH from 13 to 90 cm