
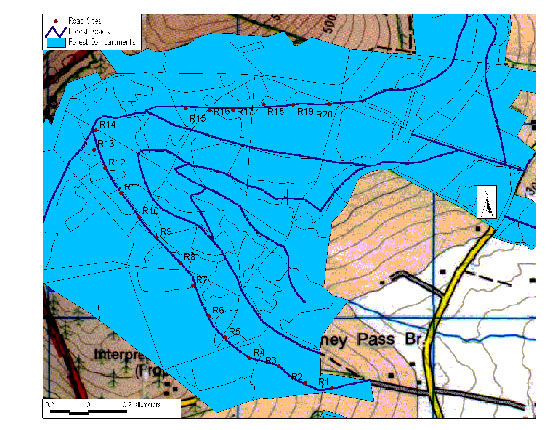
Display large image of Figure 1
Figure 1. Study area.
January 2001. Vol 12, No. 1
Audrey A. Martin
University College Dublin
and Dublin Institute of Technology
Republic of Ireland
Nicholas M. Holden
Philip M. Owende
Shane M. Ward
University College Dublin
Republic of Ireland
ABSTRACT
The purpose of this study was to evaluate differential global positioning system (DGPS) positional accuracy on Irish forest roads with typical peripheral canopies. The peripheral canopy obstruction at 20 forest road sites in Roundwood State Forest, was determined using a hand-held clinometer and magnetic compass. This simple field technique permitted quantification of the canopy obstruction using graphical means and resulted in a graphical skyplot of each site. The equipment, one Trimble ProXRS DGPS unit and two Trimble 4000SSi units permitted determination of the DGPS accuracy (average of 2.9 m) and precision (average of 2.1 m) with a range of peripheral canopies. DGPS performance was quantified in terms of the average absolute error in positional dilution of precision (PDOP) (DPDOP = 1.6). The relationship between DPDOP and percentage of open sky was found to be statistically significant (r = 0.706, r = 0.001). Statistical analysis also indicated a strong relationship between relative precision and DPDOP (r = 0.796, r = 0.000). Satellite constellation in the measurement period was not the sole factor affecting DGPS useability. Three distinct classes of peripheral obstruction at road sites were defined (Class I: 100-66 %; Class II: 65-33 %; Class III: 32-0 % obstruction) and it was found that both DGPS accuracy (3.70 m, 3.23 m, 1.91 m, respectively) and precision (4.10 m, 2.43 m, 0.83 m, respectively) improved with decreasing peripheral obstruction. These classes may be used as a means of predicting signal attenuation which might be expected under particular forest canopy conditions elsewhere.
Keywords: DGPS, skyplot, canopy obstruction, forestry, differential global positioning system, GPS, accuracy, precision, roads.
INTRODUCTION
The use of Global Positioning Systems (GPS) in forestry has been well documented since the introduction of the system in the late 1980s. Applications investigated have included the location of inventory plots [3], determination of the timber value of forest land [1], soil and vegetation surveys [12], quantification of the soil compaction caused by machine travel [10] and the role of GPS as an integral part of decision support systems [8]. Developments of eco-friendly harvesting and precision management of forest resources will require more quantitative data about the performance and reliability of GPS in forests. Independent quantitative and qualitative evaluations of the accuracies of different GPS receiver types in terms of receiver characteristics, data processing, the ergonomics of the receivers and the reliability of the hardware have been carried out [9, 5], but there has been little quantitative work about performance through time and space.
In a forest environment, the low power of GPS signals can be further attenuated by forest canopy, thus affecting the receiver efficiency and positional accuracy of the data recorded. The GPS signal attenuation attributed to canopy conditions has been shown to result in a decrease in observation rate [4]. Work carried out by [13] indicated that even under minimal canopy cover (40 trees per ha), large errors in GPS positions were common. The type of forest canopy is also important; [7] found that GPS data collected in dense coniferous forests was more reliable than data collected in dense deciduous forests. Gerlach [6] quantified this loss of signal strength in terms of tree trunks (23%), branches (28%) and foliage (36%).
The accuracy of differentially corrected GPS (DGPS) has also been shown to be greatly dependent on forest type and the number of position fixes [2]. However, there has been little work to evaluate DGPS on forest roads even though the system has potential for use in logistics management. Some modern receivers are designed to be optimised for canopy according to the manufacturers informal information [15]. Furthermore, operational guidelines to ensure the quality of forest resource GPS survey work, and the consistency and compatibility of GPS survey data in the forest inventory database have been produced [11]. Application of these guidelines is not always straightforward in the field where conditions can vary considerably. A reliable method of estimating the expected positional accuracy degradation due to signal attenuation on forest roads has not been identified.
OBJECTIVES
The purpose of this study was to evaluate the useability of DGPS on forest roads with typical peripheral canopies. The objectives of the study were to: (i) determine the accuracy, precision, performance and repeatability of DGPS co-ordinates; (ii) develop a means of predicting the signal attenuation which can be expected under particular peripheral canopy conditions.
MATERIALS AND METHODS
Study Area
The study was conducted in Roundwood State Forest in the Wicklow mountains, County Wicklow, Ireland Lat. 51°39and Long. 11°37. The experiments were restricted to a small area (circa 2 km2) to minimise both adverse atmospheric effects and terrain variations on GPS signals. Individual forest compartments were selected from the national forest inventory database on the basis of (i) proximity to a forest road, (ii) tree species predominantly single species compartments comprising of Sitka Spruce and Lodgepole Pine, (iii) age ranging from pre-thickets and thickets (approximately 0-12 and 12-18 years, respectively) to mature trees, and (iv) thinning status from unthinned up to 4th thinning. In total, 20 road sites representing diverse forest canopy conditions were selected along circa 3 km of forest road (Figure 1).
Sixteen of the selected sites were surrounded by Sitka Spruce compartments, which is most common in commercial forestry in Ireland, and the remainder were surrounded by Lodgepole Pine compartments. Sites 1-14 were situated on circa 2 km of road orientated in an approximate North/ South direction. This road segment rose from 346 m at Site 1 to 473 m at site 14. The general terrain had a predominant west/east falling gradient. The 6 remaining sites (15-20) were situated on a section of road approximately 1 km in length with a falling gradient of 5%. This road was orientated in an east/west direction and situated on a hillside falling from north to south. Although two main forest road directions (north/south and east/west) were selected, the bearing of many individual road segments where the experiments took place deviated from these general orientations. The forest roads were circa. 3.5 m wide with a total width of 5 m between peripheral trees
Field Data Acquisition
At each location, a site description including the current status of the crop and management status of the forest Figure 1. Study area. compartments bordering the site, the road slope and magnetic bearing were recorded. The sky obstruction was determined using a hand-held clinometer and magnetic compass. The angle of inclination and azimuth of the canopy crest at 2 points in each quadrant around the road site were recorded. Using these data a skyplot indicating tree density, canopy horizon and any secondary landscape horizon visible through the trees was constructed for each site. The forest road was indicated on the plot as parallel dashed lines running through the centre. The concentric circles represent spherical horizons at 0°, 30° and 60°, with the zenith (90°) directly over the particular point of measurement. The concentric dashed line at 15° indicates the elevation cutoff angle, below which no satellites were considered. On the basis of these skyplots the relative percentage of unobstructed sky above the cut-off angle was determined for each site. Each site was permanently marked along the centre of the road so that it could be revisited on a number of occasions.
Display large image of Figure 1
Figure 1. Study area.
The GPS receivers used were (i) a Trimble ProXRS™ twelve-channel unit capable of sub-metre accuracy in differential mode (the marine beacon serving the area was at Point Lynas in North Wales, UK, approximately 100 km away from the study area directly across the Irish Sea) and (ii) two eight-channel Trimble SSi™ Site Surveyors capable of milimetre accuracy (use of a specific product does not imply endorsement by the authors). Using static field techniques [14] and post processing software the SSi receivers were used to establish a base station in the study area approximately 27 km away from a known station. To ensure base station accuracy, over 6 hours of simultaneous data were recorded at the recommended manufacturer settings. The base station (Roundwood Base), RWB, (317 100E, 207 699N, 490h) was situated in an open area with a clear view of the sky and was no further than 2 km from all test sites.
The true Irish National Grid (ING) co-ordinates of each road site were obtained using rapid static techniques [14]. In this survey mode one SSi receiver remained stationary at RWB whilst the second receiver occupied the marked position at each road location for approximately 15 minutes. Post processing the GPS data resulted in positional co-ordinates for each of the 20 road sites accurate to within a few centimeters. These true co-ordinates were used as a comparison basis for all subsequent DGPS positions recorded.
Table 1 lists all operational settings adopted for use with the DGPS ProXRS™ receiver. For practical purposes the GPS antenna was positioned approximately 1.5 m above the ground at all sites. To ensure a variety of satellite configurations, different days and times of the day were selected for the DGPS measurements. On dates during the months of May, June, July and August 1999, DGPS positions and Positional Dilution Of Precision (PDOP) values were recorded at all sites. In total, over 6500 DGPS positions were recorded during 11 sessions. To evaluate the effects of canopy on obstructed sites, the PDOP values recorded at each site were compared to PDOP values recorded at the unobstructed RWB. The mean absolute DPDOP (PDOP at RWB PDOP at each experimental site) was calculated using a spreadsheet.
Data were evaluated for (i) accuracy by difference from the true co-ordinates, (ii) precision by standard deviation of position fix, (iii) performance by comparison with unobstructed PDOP values at all sites for each epoch, and (iv) repeatability over the various dates of observation.
Table 1. DGPS operational settings adopted with the ProXRS receiver.
|
Parameter
|
Setting
|
| Mode | Manual 2D/3D |
| Minimum number of Satellites | 3 |
| Measurement interval | 2 seconds |
| Minimum number of position fixes | 30† |
| Elevation cut off angle | 15° |
| PDOP cutoff | 99 |
| SNR | 0 |
† Determined from 150 epochs
RESULTS AND DISCUSSION
The general characteristics of each site are summarised in Table 2. Initial DGPS trials on the forest roads indicated that an increase in the number of differential position fixes would yield an increase in accuracy. One hundred and fifty DGPS position fixes (300 seconds) resulted in a Circle Error Probable (CEP) of 1.225 m. However, it was found that the CEP of 1.347 m obtained after only 30 position fixes (60 seconds) was comparable to the accuracy quoted by the manufacturer (1 m) and was not much different from the best data. Therefore, mean results for each site were determined from 30 epochs which represented a more practical approach to the use of time in the field.
During the measurement period the differential beacon correction was found to be reliable 97 % of the time. June 22nd accounted for 27 % of this downtime. The majority of real-time uncorrected positions were recorded at site 1. The loss of differential signal at this point can be attributed to its low elevation (346.1 m) with respect to the surrounding terrain. The general reliability of the system can be attributed to it being transmitted in the medium wave range. Such signals tend to hug the ground and are not line-of-sight. Only differentially corrected positions have been included in the results.
Accuracy
DGPS positional accuracies, determined as the Euclidean distance from the truecoordinates, were found to vary with respect to surrounding canopy type and measurement period. Table 3 lists the average, maximum and minimum accuracies determined from a total of 330 DGPS measurements at each site. The average differentially corrected accuracy was 2.9 3.71 m over all canopy types and sampling dates. The 95 percentile of the differential position data was 7.25 m. Only 8 mean observations (30 position fixes each) were in error by more than 15 m. From Table 3 it can be seen that sites 5, 6, 10, 12, 13, and 16 are within 2 m of the absolute values with errors ranging from 0 to 3 m. The maximum percentage of surrounding canopy obstruction at these sites was 35 %. Sites 3 and 8 were found to have mean errors exceeding 6 m. The large variation in these measurements, 16.2 m and 20.7 m respectively, can be attributed to their high relative percentage of obstructed sky 66% and 74%.
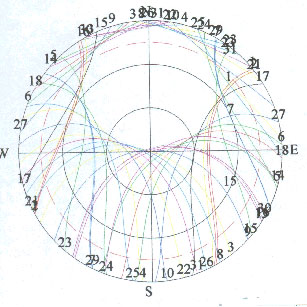
These results indicate a correlation between the positional accuracy and percentage of surrounding canopy obstruction. However, no significant correlation was found to exist (r = 0.455, r = 0.044). The lack of correlation, can to some extent, be explained by poor satellite constellations with respect to the experimental area. GPS satellite geometry in the northern hemisphere was found to be continuously poor irrespective of the time and date of observations. Figure 2 illustrates a satellite trajectory predicted using Trimbles Mission Planning Software for a 24 hour period directly over the experimental area. As can be seen from this figure, a considerable gap exists to the north and canopy obstruction in this segment of the hemisphere will therefore have little significance on the overall result.
Table 2. Road site descriptions.
|
Roadsite
|
Road bearing, °
|
Road slope, °
|
Primary species
|
General status
|
| 1 | 90 | 7 E-W | Lodgepole pine | Mature, thinned |
| 2 | 120 | 2 SE-NW | Lodgepole pine | Mature, thinned |
| 3 | 130 | 3 SE-NW | Lodgepole pine | Mature, thinned |
| 4 | 108 | 10 E-W | Sitka spruce | Mature, thinned |
| 5 | 145 | 4 SE-NW | Sitka spruce | Clearfelled to NE, dense mature trees to SW |
| 6 | 155 | 4 SE-NW | Lodgepole pine | Mature, |
| 7† | 165 | 3 SE-NW | Sitka spruce | Mature, thinned |
| 8 | 145 | 5 SE-NW | Sitka spruce | Mature, thinned |
| 9 | 145 | 3 SE-NW | Sitka spruce | Mature, thinned |
| 10 | 130 | 0 SE-NW | Sitka spruce | Mature, thinned |
| 11 | 160 | 2 S-N | Sitka spruce | Mature, thinned |
| 12 | 150 | -3 SE-NW | Sitka spruce | Saplings |
| 13 | 190 | 4 S-N | Sitka spruce | Saplings |
| 14 | 190 | 6 S-N | Sitka spruce | Saplings |
| 15 | 280 | -3 SE-NW | Sitka spruce | Mature, thinned |
| 16 | 285 | 0 SE-NW | Sitka spruce | Saplings |
| 17 | 260 | -3 E-W | Sitka spruce | Mature, thinned |
| 18 | 90 | -5 E-W | Sitka spruce | Mature, thinned |
| 19 | 280 | -4 E-W | Sitka spruce | Mature, thinned |
| 20† | 275 | 0 E-W | Sitka spruce | Mature, thinned |
† Points at turning circles
Table 3. Summary of DGPS results from 11 measurement sessions.
| Site | % of open sky | Positional accuracy | Relative precision | Performance | ||||||
| Mean | Max | Min | Mean | Max | Min | Mean | Max | Min | ||
| 1 | 46 | 4.1 | 22.4 | 1.4 | 4.3 | 21.6 | 0.2 | 1.7 | 17.0 | 0.0 |
| 2 | 25 | 2.6 | 3.4 | 0.9 | 4.6 | 21.7 | 0.3 | 1.5 | 20.5 | 0.0 |
| 3 | 34 | 6.0 | 17.6 | 1.4 | 1.2 | 4.9 | 0.2 | 1.5 | 16.7 | 0.0 |
| 4 | 22 | 2.1 | 4.1 | 1.6 | 1.2 | 2.0 | 0.3 | 1.0 | 21.6 | 0.0 |
| 5 | 80 | 1.6 | 2.1 | 1.5 | 0.3 | 0.7 | 0.2 | 0.3 | 2.5 | 0.0 |
| 6 | 74 | 1.5 | 3.0 | 0.7 | 1.0 | 2.4 | 0.4 | 0.6 | 2.4 | 0.0 |
| 7 | 59 | 2.7 | 5.2 | 1.6 | 1.7 | 3.7 | 0.2 | 1.4 | 29.0 | 0.0 |
| 8 | 26 | 6.4 | 21.1 | 0.4 | 6.5 | 21.7 | 0.7 | 2.8 | 39.5 | 0.0 |
| 9 | 61 | 3.8 | 21.0 | 1.0 | 1.8 | 2.2 | 0.3 | 1.4 | 5.2 | 0.0 |
| 10 | 65 | 1.8 | 2.9 | 1.3 | 0.4 | 0.9 | 0.2 | 1.2 | 18.2 | 0.0 |
| 11 | 34 | 2.9 | 4.7 | 1.1 | 1.7 | 3.6 | 0.3 | 4.3 | 66.2 | 0.0 |
| 12 | 87 | 0.9 | 1.9 | 0.0 | 1.0 | 1.3 | 0.4 | 0.9 | 5.1 | 0.0 |
| 13 | 92 | 1.5 | 1.9 | 1.0 | 0.5 | 1.3 | 0.2 | 0.6 | 4.3 | 0.0 |
| 14 | 100 | 3.1 | 15.0 | 1.2 | 0.3 | 0.7 | 0.2 | 0.4 | 3.5 | 0.0 |
| 15 | 37 | 2.8 | 3.0 | 1.5 | 3.0 | 3.6 | 0.5 | 1.6 | 4.4 | 0.1 |
| 16 | 89 | 1.7 | 2.2 | 1.4 | 0.6 | 1.7 | 0.1 | 0.9 | 3.6 | 0.1 |
| 17 | 38 | 2.6 | 4.1 | 1.7 | 1.6 | 2.9 | 0.3 | 0.9 | 4.5 | 0.0 |
| 18 | 45 | 3.6 | 16.5 | 0.0 | 3.6 | 15.9 | 0.2 | 4.8 | 24.5 | 0.0 |
| 19 | 58 | 3.3 | 5.7 | 2.7 | 5.0 | 3.4 | 1.3 | 3.7 | 38.7 | 0.0 |
| 20 | 71 | 3.0 | 5.1 | 0.7 | 2.1 | 4.0 | 0.2 | 0.9 | 8.9 | 0.0 |

Display large image of Figure 2
Figure 2. Satellite trajectory at the experimental site predicted for
a 24-hour period.
(ii) Precision
The 2-dimensional standard deviation as estimated by the DGPS receiver (ProXRS) was used as an indicator of precision in this study. From 11 epochs for each site 220 standard deviations were computed. The mean, maximum and minimum 2-dimensional standard deviations at each site are listed in Table 3. The overall precision of the receiver was determined as 2.1 m under all canopy types, with 95 % of the positions within 7.7 m. Standard deviations recorded at the majority of sites were within the manufacturers specification ( 1 m). The largest standard deviations of 4.3 m, 4.6 m, 6.5 m and 5.0 m were recorded at Sites 1, 2, 8 and 19, respectively. The magnitude of these errors indicates possible multipath effects in the observations, or poor satellite geometry due to surrounding canopy adversely affecting GPS signals. To assess the effects of surrounding canopy on precision, the relative percentages of open sky at each experimental site was respectively ranked. A significant rank correlation (r = 0.648, r = 0.002) was found to exist between the extent of obstruction and the precision of DGPS positions.
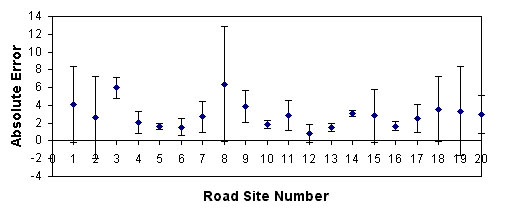
Statistical analysis confirmed that there was a significant correlation (r = 0.635, r = 0.003) between the 2-dimensional DGPS precision and the absolute accuracy of DGPS positions. This relationship is illustrated in Figure 3 where it can be seen that the most accurately positioned sites 4, 5, 6, 10, 12, 13 and 16 tended to be more precise; whereas sites 1, 2, 8, 15, 18 and 19 were both inaccurate and imprecise.
Performance
The 6600 absolute DPDOPs measured ranged from 66 to 0 with an average of 1.6, the 95 percentile was 6.1. The PDOP values recorded at RWB corresponded with those predicted from the Trimbles satellite almanac Mission Planning. PDOPs recorded under canopy differed significantly from unobstructed predicted values. Generally, the DPDOPs determined remained constant over the duration of individual epochs (60 seconds). Large DPDOP fluctuations within an epoch may be attributed to sporadic obstruction of the antenna by tree foliage caused by wind. The relationship between DPDOP and percentage of open sky was found to be statistically significant (r = 0.706, r = 0.001) thus suggesting that denser surrounding canopies will result in poorer satellite geometry selection and hence, inferior DOP values. The relative precision of DGPS positions was also found to bear a strong relationship to DPDOP values (r = 0.796, r = 0.000) thus implying that good satellite geometry will result in reliable positions regardless of the presence of forestry.
The accuracy and precision of GPS fixes achieved in this study could be improved by filtering the raw data. The PDOP mask used was 99 (this was the maximum PDOP mask permitted by the receiver) which greatly exceeded the recommended value of 8. However, adoption of high PDOPs will result in more data in a shorter period of time and it is therefore incumbent on the user to decide on the level of accuracy required before adopting GPS operational settings.
It should also be noted that an increase in PDOP was found to adversely effect the receiver Latitude more than the Longitude. This phenonomen is due to the geodetic location of Wicklow and the inclination of the GPS satellites (at 55°, the further north one goes the fewer the number of satellites at the zenith). Dilution of Precision (DOP) values are influenced solely by the geometry of the satellites and some systems on the market are capable of receiving information from both GPS and GLONASS (the Russian satellite positioning system), the inclination of GLOSASS satellites is 64.8°, thus reducing the adverse effects in northern latitudes. In the future, the adoption of more advanced antennae coupled with additional signal availability will help to minimise this problem.

Display large image of Figure 3
Figure 3. Relationship between the average absolute error
and the precision of the observations.
Repeatability
Statistical analysis of the data was carried out to determine if a significant relationship existed between the precision of the results obtained and the satellite constellation during measurement periods. The 2-dimensional standard deviations computed for each site were ranked and cross-correlated on the basis of measurement period. Similarities were found to exist between epochs 1, 2, 3, 5, 8 and 10; 3,4,5, and 7; 4 and 8; 5, 6 and 7; and 8, 10 and 11. Only 50% of the correlated epochs had similar satellite constellations. Therefore, it was concluded that the satellite geometry or time of measurement was not a significant over-riding factor affecting DGPS useability.
Prediction of Performance
The percentage of peripheral canopy obstruction was classified in three main classes: Dense peripheral canopy = 100 - 66% obstruction; Medium peripheral canopy = 65 - 33% obstruction, and; Light peripheral canopy 32 0% obstruction. Figure 4 illustrates skyplots of experimental sites 8, 1 and 13 representing dense, medium and light peripheral canopy obstruction respectively. On the basis of these categories, the accuracy, precision and signal performance of the DGPS receiver under foliage were determined (Table 4). From Table 4 it can be seen that there was a significant difference in accuracy and precision between all canopy obstruction classes. Performance of the GPS receiver in the light peripheral canopy obstruction class (PDOP = 0.66) was lower than in the other two classes which indicates that PDOP is useful for conveying the performance of GPS due to the potential for large changes that are not directly related to the environment and which are not reflected by the other measures. In general, once 33% of the sky view is blocked the unit performs half as well, but even with 66% obstruction, the unit works well enough for most forest applications.
CONCLUSIONS
The results presented in this study indicate that the extent of peripheral canopy obstruction will have an effect on the accuracy, precision and performance of DGPS positions. However, as the maximum error determined for the densest peripheral canopy class in both accuracy and precision was only circa 4 m, this effect can be considered insignificant for the majority of forestry applications.
The four quantitative measures of DGPS performance were examined and, though related, were not perfectly correlated. It has also been shown that quantification of peripheral canopy obstruction in terms of percentage of open sky above the measurement point provides a means of predicting DGPS signal attenuation.
The method of determining peripheral canopy obstruction adopted for this study is a simple technique and provides a protocol to determine peripheral canopy obstruction, which could be applied in all field situations with relative ease. Such on-site classification would aid in determining measurement specifications in advance of a GPS survey. However, this study has not investigated the effect of variables such as weather conditions, terrain variability and atmospheric on signal attenuation and further work is required to quantify these. Furthermore, signal attenuation experienced under deciduous foliage may not be the same due to the different leaf structure and therefore must also be classified.
ACKNOWLEDGEMENTS
This study was sponsored by COFORD (The National Council for Forest Research and Development) Project 3-7-1995 and Coillte Teoranta (The Irish Forestry Board).
Table 4. Classification of the mean accuracy, precision and performance of DGPS relative to peripheral canopy obstruction.
|
Peripheral
Canopy Description |
Canopy
Obstruction, % |
Mean
Accuracy, m |
Precision,
m |
Performance
(DPDOP) |
| Dense | 100 66 | 3.70 | 4.10 | 1.77 |
| Medium | 65 33 | 3.36 | 2.43 | 2.25 |
| Light | 32 - 0 | 1.91 | 0.83 | 0.66 |

Display large image of Figure 4

Display large image of Figure 4a

Display large image of Figure 4b
Figure 4. Skyplots of experimental sites 8, 1 and 13 representing dense,
medium and light peripheral canopy obstruction, respectively.
AUTHOR CONTACT
Dr. Martin can be contacted by e-mail at
Phil.Ryan@ucd.ie
REFERENCES
[1] Bergstrom, G.C. 1990. GPS in forest management. GPS World. September/October 1990, 46-49.
[2] Deckert, C. and P.V. Bolstad. 1996. Forest canopy, terrain and distance effects on Global Positioning System point accuracy. American Society for Photogrammetry and Remote Sensing. 62:317-321.
[3] Evans, D.L., R.W. Carraway, and G.T. Simmons. 1992. Use of global positioning system (GPS) for forest plot location. Southern Journal of Applied Forestry. 16(2): 67-70.
[4] Firth, J. and R. Brownlie. 1998. An efficiency evaluation of the Global Positioning System under forest canopies. New Zealand Forestry. 43(1): 19-25.
[5] Forgues, I. 1998. GPS testing in Eastern Division of FERIC. Proc. of the 2nd GPS in Forestry Western Workshop, Kelowna, BC Canada, Nov. 16th-18th, 1998. 7pp.
[6] Gerlach, F.L. 1989. Global Positioning System canopy effects study. USDA Forest Service Technology and Development Program. MTDC 89-34. 18pp.
[7] Jalinier, C. and J. Courteau. 1993. Forest road surveys with GPS. Forest Engineering Institute of Canada. Technical Note TN-196, 6pp.
[8] Kruczynski, L.R. and A. Jasumback. 1993. Forestry management applications; Forest Service experiences with GPS. Journal of Forestry. 91(8): 20-24.
[9] Lachapelle, G. and J. Henriksen. 1995. GPS under cover; The effect of foliage on vehicular navigation. GPS World. March 1995. 26-35.
[10] McMahon, S. and R. Sincock. 1998. GPS unearths operational soil compaction. Conf. Proc. 2nd GPS in Forestry Western Workshop, Kelowna, BC Canada, Nov. 16th-18th, 1998. 7pp.
[11] Ministry of Forests. 1998. Operational field procedures for forest resource survey and mapping using Global Positioning System technology. Prepared by the Ministry of forest recources inventory branch for the resources inventory committee. March 31st 1998. Verison 2.0. 36pp.
[12] OConnell, D., J. Gallant, L. Ashton, and C. Hill. 1995. The use of global positioning systems (GPS) for soil and vegetation survey in forested landscapes. Proc. Institute of Foresters Australia 16th Biennial Conference 1995. 137-144.
[13] Reutebuch, S. 1998. Tracking forest vehicle movements under varying canopy densities. Proc. Of the 2nd GPS in Forestry Western Workshop, Kelowna, BC Canada, Nov. 16th-18th, 1998. 8pp.
[14] Trimble. 1995. Series 4000 Application Guide. Trimble Navigation Limited, Surveying and Mapping division, 645 North Mary Avenue, Post Office Box 3642, Sunnyvale CA 94088-3642.
[15] Trimble. 1999. Trimble navigation Europe Ltd., Trimble House, Meridian Office Park, Osborn Way, Hook, Hampshire, RG27 9 HX, U.K. Personal Communications.