
Display large image of Table 3
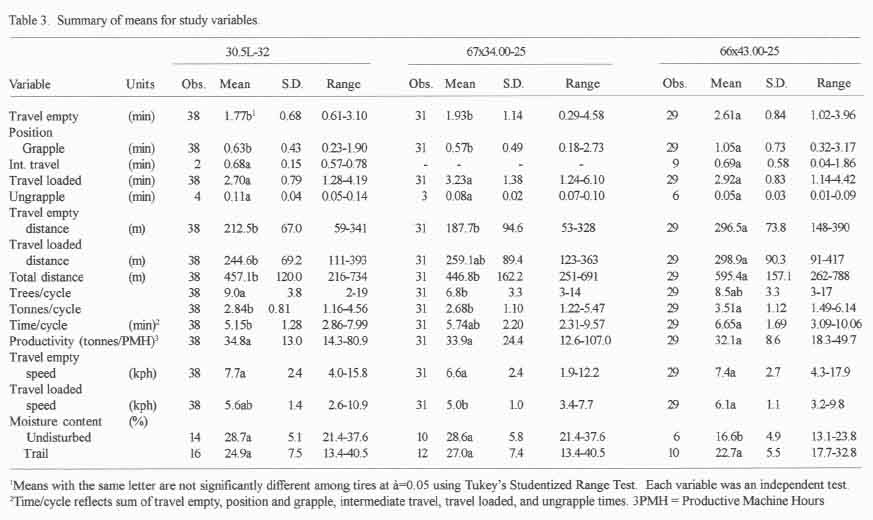
Table 3. Summary of means for study variables
January 2001. Vol 12, No. 1
| John Klepac USDA Forest Service Auburn, Alabama |
Joe Roberson Mead Coated Board Opelika, AL |
| Bryce Stokes USDA Forest Service Washington, D.C. |
ABSTRACT
Evaluation of skidder productivity and costs among 30.5L-32 (78-cm), 67x34.00-25 (86-cm), and 66x43.00-25 (109-cm) size tires under wet conditions was conducted in a clearcut harvest during the Spring of 1998 on an Upper Coastal Plain site in southeast Alabama. There was not a significant difference in adjusted mean whole-tree skidder production among the three tire sizes at the 0.05 level. Adjusted mean whole-tree skidder production for the 78-cm, 86-cm, and 109-cm tires was 32.7, 35.8, and 32.9 green tonnes per Productive Machine Hour (PMH), respectively. Total whole-tree skidding costs were $1.96, $1.80, and $1.97 per green tonne for the 78-cm, 86-cm, and 109-cm tires, respectively.
Keywords: Forest harvesting, skidding, costs, productivity, skidder, clearcut, grapple skidder, drive-to-tree feller buncher, Pinus tadea, hardwood, mixed wood.
INTRODUCTION
Harvest systems consisting of rubber-tired skidders and feller-bunchers are the most popular systems for timber harvesting in the southern U.S. Terrain in the Lower Piedmont and Coastal Plain areas is conducive to this method of harvesting. However, this flat to gently rolling terrain, coupled with poorly draining soils, can cause difficulty in some areas during the wet season, resulting in reduced traction and increased site disturbance. As a corollary, loggers have turned to using wider skidder tires to improve tractive performance while reducing site impacts.
Numerous past studies have focused on site disturbance resulting from different tire sizes. Increasing tire width as a means to reduce ground pressure has been used by machinery manufacturers as machines have increased in size and weight [1].
However, the effect of tire size on productivity has not been extensively researched in the past. Comparison of performance and soil impacts of 173-cm tires and 127-cm tires was conducted [6]. In this study, the wider tires provided a 13 to 23 percent increase in productivity and produced less soil disturbance on firm and soft sites [1]. Comparison of productivity and site impacts of three tire sizes; 18.4-26 (47-cm), 23.1-26 (59-cm), and 67x34.00-26 (86-cm) was also studied [7]. No significant difference in productivity was found between the 47-cm and 59-cm wide tires. However, the 86-cm wide tires provided a significant increase of 2.5m3 per PMH, or a 14.8 percent increase over the 47-cm wide tires.
A cooperative study was conducted by the USDA Forest Service Engineering Research Unit in Auburn, Alabama, Mead Coated Board, and Daniels Logging during the Spring of 1998 on a site in southeast Alabama. With increased concern in meeting more restrictive environmental guidelines, a need was identified to determine optimal tire size for year-round operation to maximize productivity while maintaining environmental quality [1]. The objectives of this study were to determine productivity and costs for 78-cm, 86-cm, and 109-cm wide tires for skidding during the wet season. A previous study was conducted which evaluated skidder productivity among four tire sizes during the dry season: 28L-26 (71-cm), 30.5L-32 (78-cm), 67x34.00-25 (86-cm), and 66x43.00-25 (109-cm). This paper presents results from a continuation of that study where skidder productivity and costs among three tire sizes, 78-cm, 86-cm, and 109-cm, were evaluated during the wet season.
HARVEST SYSTEM
Testing of Firestone 78-cm, 86-cm and 109-cm tires (Table 1) mounted on two Timberjack 450C grapple skidders was conducted in a clearcut harvest of a mixed loblolly pine (Pinus taeda)/hardwood stand. Trees were felled and bunched using a Hydro-Ax 611 drive-to-tree feller-buncher utilizing a circular sawhead and skidded whole-tree to the landing. A CTR pull-thru delimber with a topping saw was used to process trees at the landing. Processed trees were then sorted by a second knuckle-boom loader into sawlogs or pulpwood and loaded onto haul trucks.
STAND/SITE CONDITIONS
The stand was located on an Upper Coastal Plain site in Barbour County, Alabama consisting of a Susquehanna clay soil [9]. Slopes ranged from zero to five percent. In undisturbed areas mean gravimetric soil moisture content was 29.6 percent at the 0-5-cm depth and 23.0 percent at the 10-15-cm depth. In skid trails mean gravimetric soil moisture content was 25.6 percent at the 0-5-cm depth and 24.4 percent at the 10-15-cm depth. Mean DBH of pine and hardwood trees skidded was 19.1 and 16.8-cm for the 78-cm tires, 20.8 and 16.8-cm for the 86-cm tires, and 19.1 and 21.3-cm for the 109-cm tires, respectively.
METHODOLOGY
Production Study
The study was conducted during April 1998. One contractor was selected for the field trial. Two experienced operators were used for the test. The same operator was used to test both the 86-cm and 109-cm tires. Standard production time study techniques were used to measure the following elements: travel empty, position and grapple, intermediate travel (bunching), travel loaded, and ungrapple. Travel distances were measured with a rolatape distance wheel. DBH and butt diameter were measured to the nearest 0.25-cm using calipers. A 15-cm stump allowance was used while measuring DBH. Total lengths were measured to the nearest 0.03-m using a loggers tape. For trees where DBH was not measured, butt diameter was used to predict DBH using a regression equation. Total lengths were sampled and regression equations were developed to estimate these variables as a function of DBH for unsampled trees. Whole-tree volumes were calculated using appropriate volume equations [3].
Soil Moisture
Soil samples were collected in aluminum soil rings (92-cm3) at 5-cm and 15-cm depths in undisturbed areas and in skid trails for each tire size to determine field gravimetric moisture content (%) during the test (Table 1). Field moist soil samples were weighed after collection, dried at 105 C for 72 hours, and gravimetric moisture content calculated for each sample.
A soil moisture retention curve was prepared by collecting soil samples from undisturbed and disturbed areas in brass rings (136-cm3). Since these samples were collected after harvesting and site preparation was completed, undisturbed samples were collected from an uncut area adjacent to the harvested area. Disturbed samples were collected between planting beds which had been trafficked by the site preparation machine. Each sample was placed separately in a air-tight plastic bag and weighed the same day. Samples were then placed in a container of tap water and brought to saturation by incremental increases of water contents. At saturation, samples were weighed, placed in a pressure plate apparatus and equilibrated at six values of matric potential: -6, -10, -33, -100, -300, and -500-kPa. Upon completion of moisture runs, samples were placed in aluminum pans and oven-dried at 105 C for 72 hours for bulk density determination. From these data such variables as volumetric moisture content (%), field capacity, and porosity (total, macro, and micro) were determined. Total porosity was determined at saturation while macro porosity was determined at -6-kPa. Field capacity is defined as the percentage of water remaining in a soil two or three days after having been saturated and after free drainage has practically ceased [5]. Porosity is the amount of air space, expressed as a percentage, a soil has available for water to flow.
RESULTS AND DISCUSSION
Production Study
Tree summaries by tire size are shown in Table 2. For the 86-cm tires, pine trees skidded had a slightly larger mean DBH that was significantly different from the other two tire sizes. There was a significant difference in mean DBH and mean weight per tree for hardwood for the 109-cm tires. For both pine and hardwood combined, there Table 1. Specifications of tires tested.* Overall Overall Contact Area Width Diameter (cm2) Tire Size (cm) (cm) Flat Plate 7.62-cm Penetration 30.5L-32 77.5 188.0 2439 7013 67x34.00-25 85.6 175.8 4065 6968 66x43.00-25 105.4 172.2 4033 8200 * Specifications taken from Bridgestone/Firestone brochure.
Table 2. Summary of mean values of tree measurements.
|
Tire Size
|
|||||||||
| Variable | 30.5L-32 | 67x34.00-25 | 66x43.00-25 | ||||||
| Pine | Hw | Both | Pine | Hw | Both | Pine | Hw | Both | |
| DBH (cm) | 19.1a1 | 16.8b | 18.5a | 20.8b | 16.8b | 19.8a | 19.1a | 21.3a | 19.8a |
| Total length (m) | 15.4 | 13.8 | 15.1 | 16.1 | 13.5 | 15.5 | 15.4 | 16.0 | 15.6 |
| Tree weight (tonnes)2 | 0.35a | 0.20b | 0.31b | 0.45a | 0.22b | 0.40a | 0.39a | 0.45a | 0.42a |
1 Means with the same letter are not significantly different at
=0.05 using Tukeys Studentized Range Test. Independent tests were performed
for each species and both species combined.
2 Green tonnes per tree was a significant difference in mean tree weight for
the 78-cm tires.
Table 3 shows the production summary for the tires tested. There were no significant differences in productivity among the tires, however, productivity for the 109-cm tires was the lowest. Mean productivities were 34.8, 33.9, and 32.1 tonnes per PMH for the 78-cm, 86-cm, and 109-cm tires, respectively. The low productivity for the 109-cm tires was a result of longer travel distances encountered. To adjust for this difference in travel distance, a Least-Squares Mean Analysis was performed [8]. Least-Squares Mean productivities were 32.7, 35.8, and 32.9 tonnes per PMH for the 78-cm, 86-cm, and 109-cm tires, respectively. This resulted in a 9 percent higher productivity for the 86-cm tires as compared to the 78-cm and 109-cm tires, respectively.
There was a significant difference in mean position and grapple time for the 109-cm tires as compared to the other tires. Mean position and grapple time for the 109-cm tires was 67 and 84 percent greater than that of the 78-cm and 86-cm tires, respectively. This increase could have been due to several factors. It seemed this skidder was performing more bunch building, since there was a total of nine occurrences of intermediate travel, whereas the skidder equipped with 78-cm tires had only two occurrences. There were no occurrences of intermediate travel for the skidder with 86-cm tires. This resulted in more time spent positioning and grappling to get a full payload. The reason for this extra time spent by the skidder building bunches was not clear, but was possibly due to different stand conditions under which the feller-buncher was operating, making it more difficult for the feller-buncher to maneuver and perform bunch building. Since the skidder with 109-cm tires skidded larger hardwoods, perhaps the feller-buncher operator had a more difficult time handling these trees, creating more bundles with fewer trees. Another factor that could have possibly contributed to longer position and grapple times for the 109-cm tires was maneuverability. With wider tires, maneuvering while turning around to grapple a bundle could have been more difficult for the skidder operator.
A summary of means for each time study element is also shown in Table 3. Tukeys Studentized Range Test was used to test for differences among these elements for the three tire sizes.
Display large image of Table 3
Table 3. Summary of means for study variables
The skidders equipped with 78-cm and 109-cm tires skidded a similar number of stems per cycle. However, the number of stems skidded with the 86-cm tires was approximately 24 percent less.
Mean weight per cycle for the skidder with 109-cm tires was significantly higher than that of the other tires. This higher turn weight was most likely due to the larger hardwoods skidded. Mean hardwood weight per tree was 0.45 tonnes for the skidder equipped with 109-cm tires, as compared to 0.20 and 0.22 tonnes for the skidders equipped with 78-cm and 86-cm tires, respectively.
Travel empty speeds were not significantly different among the three tire sizes, which suggested that tire width did not influence this function. Travel loaded speed for the 86-cm tires was slower and significantly different than the 109-cm tires. It appeared that the skidder equipped with 109-cm tires had improved tractive performance since it had a faster mean travel loaded speed and a larger mean payload. Also, the skidder operator commented that the 109-cm tires seemed to provide more pulling power as compared to the 86-cm tires.
Overall trail gravimetric soil moisture content was slightly lower for the 109-cm tires, however, it was not significantly different from that of the 78-cm and 86-cm tires.
A linear regression analysis was performed to model total time in minutes per cycle for each tire size. For the 78-cm and 109-cm tires, both total distance and total basal area per cycle were significant at the 0.05 level.
1) 30.5L-32: Total cycle time = 0.2699810
+ 0.008093852*TD + 4.247944*TBA;
R2 = 0.61; C.V. = 15.96
2) 67x34.00-25: Total cycle time =
0.5584336 + 0.01159647*TD;
R2 = 0.73; C.V. = 20.37
3) 66x43.00-25: Total cycle time =
0.06755708 + 0.00541399*TD +
10.75735*TBA;
R2 = 0.62; C.V. = 16.18
where: TD = total travel distance (m) and TBA = total basal area per cycle (m2).
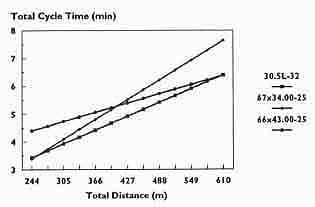
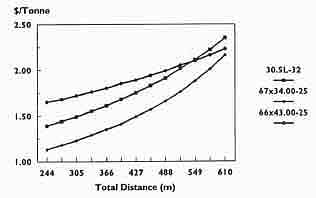
Figure 1 reflects total cycle time as a function of total distance using regression equations 1-3. For the 78-cm and 109-cm tires a basal area of 0.28 m2 was used.

Display large image of Figure 1
Figure 1. Estimated total cycle time for each tire size.
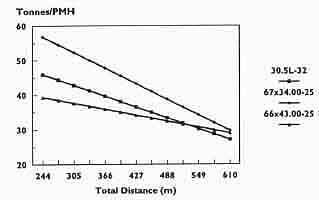
Linear Regresssion was also used to model productivity in tonnes per PMH (Figure 2). For all tires, both total skid distance and total basal area per turn were significant at the 0.05 level. The models developed for each tire size were as follows:
1) 30.5L-32: Productivity = 30.71013 -
0.05119777*TD + 98.88808*TBA
R2 = 0.53; C.V. = 26.31
2) 67x34-25: Productivity = 7.442073 -
0.0739080*TD + 240.6432*TBA
R2 = 0.80; C.V. = 33.01
3) 66x43.00-25: Productivity = 23.15327 -
0.02814376*TD + 82.34797*TBA
R2 = 0.45; C.V. = 20.71
where: TD = total travel distance (m) and TBA = total basal area per cycle (m2).
The 86-cm tires were the most productive over the full range of skid distance. The 78-cm tires were more productive than the 109-cm tires for total skid distances ranging from 244-m to 488-m. For total skid distances greater than 549-m the 109-cm tires are slightly more productive than the 78-cm tires. At 427-m, the mid-point, the 86-cm tires are 18 percent more productive than the 78-cm tires. Compared to the 109-cm tires, the 86-cm tires are 27 percent more productive.

Display large image of Figure 2
Figure 2. Estimated productivity as a function of total skid distance.
Soil Moisture
Table 4 summarizes mean gravimetric and volumetric soil moisture content for each tire size tested. No significant differences in mean trail moisture content were found among the three tire sizes at the 5-cm and 15-cm depths. However, there was a significant difference in mean undisturbed moisture content for the 109-cm tires. This was most likely due to sampling at a location which had significantly more drainage than the undisturbed areas that were sampled for the 78-cm and 86-cm tires.
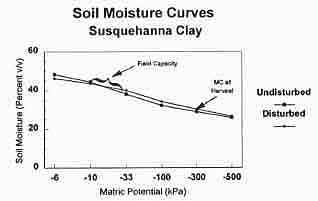
Moisture retention curves, or, soil moisture curves, are useful for illustrating the amount of water a particular soil type can hold. Figure 3 represents soil moisture curves for undisturbed and disturbed conditions for a Susquehanna clay. For clay soils, field capacity occurs between 10 and 33-kPa. For this particular soil field capacity is approximately 40 percent soil moisture on a percent volume basis. Mean trail volumetric soil moisture content during the study for the 78-cm, 86-cm, and 109-cm tires was 34.10, 32.65, and 28.93 percent, respectively. For all tire sizes combined mean trail volumetric soil moisture content was 31.48 percent. This reveals that testing of the tires occurred while the soil was approximately 80 percent of field capacity. As indicated in Figure 3, percent soil moisture for the disturbed soil was slightly higher than the undisturbed soil. This is expected, since pore space for disturbed soils is reduced by compaction, lowering total porosity (Table 5), resulting in a higher water holding capacity and poorer drainage.
Table 4. Summary of mean percent soil moisture content for the tires tested.
| Undisturbed soil depth | Trail soil depth | |||||
| Tire Size | 5-cm | 15-cm | Overall | 5-cm | 15-cm | Overall |
| 30.5L-32 | ||||||
| (w/w)2 | 31.7a1 | 25.8a | 28.7a | 25.4a | 24.4a | 24.9a |
| (v/v)3 | 34.1a | 34.0a | 34.1a | 32.2a | 32.2a | 34.1a |
| 67x34.00-25 | ||||||
| (w/w) | 32.1a | 25.2a | 28.6a | 27.0a | 27.1a | 27.0a |
| (v/v) | 33.9a | 34.1a | 34.0a | 31.8a | 33.5a | 32.7a |
| 66x43.00-25 | ||||||
| (w/w) | 20.4b | 12.8b | 16.6b | 24.4a | 21.1a | 22.8a |
| (v/v) | 28.7b | 19.4b | 24.0b | 28.9a | 29.0a | 28.9a |
1 Means with the same letter are not significantly different at =0.05 using
Tukeys Studentized Range Test. Independent tests were performed for each disturbance,
depth, and w/v basis.
2 Gravimetric (weight basis).
3 Volumetric (volume basis).

Display large image of Figure 3
Figure 3. Soil moisture curve expressed as percent volumetric water.
Table 5. Summary of mean percent porosity.
| Macro | Micro | Total | |
| Undisturbed | 22.8a1 | 43.0a | 65.8a |
| Disturbed | 15.0b | 40.4a | 55.4b |
1Means with the same letter are not significantly different at =0.05 using Tukeys Studentized Range Test for each class.
ECONOMICS
In addition to determining differences in productivity among tires, another objective of the study was to evaluate skidding cost for each tire size. Tire and wheel assembly costs, including mounting, are listed in Table 6.
A machine rate analysis for a Timberjack 450C grapple skidder equipped with each of the tire sizes studied is shown in Table 7.
In the machine rate analysis a purchase price of $136,000 was used. Since this price included standard 28Lx26 (71-cm) tires, the cost of a set of these tires and wheels was subtracted from the purchase price and the cost of equipping a skidder with the appropriate size wheels was added back into the purchase price. This enabled the tires to be treated as an operating expense with an expected life of 6000 SMH. This tire life was used as a result of corresponding with tire dealers and loggers with experience in dealing with these particular tires.
Using Least-Squares Mean productivities of 32.7, 35.8, and 32.9 tonnes per PMH for the 78-cm, 86-cm, and 109-cm tires translates into a whole-tree skidding cost per tonne of $1.96, $1.80, and $1.97, respectively. Assuming a 24.1 percent loss [10] from delimbing and topping, 10 hour work days, 70 percent utilization, and an average of 25 tonnes per truck load results in an additional 0.7 truck loads per day for the 86-cm tires when compared to the 78-cm tires and an additional 0.6 truck loads per day when compared to the 109-cm tires.
Table 6. Tire and wheel costs.*
| Cost per Tire | Cost per Wheel | Mounting Cost | Cost to Equip Machine |
|
| Tire Size |
(US$)
|
|||
| 30.5L-32 | 1900 | 350 | 60 | 9,240 |
| 67x34.00-25 | 2831 | 375 | 60 | 13,064 |
| 66x43.00-26 | 3235 | 470 | 80 | 15,140 |
*Cost information provided by [4].
Table 7. Machine rate analysis.
| Timberjack 450C Grapple Skidder | |||
| 30.5L-32 | 67x34.00-25 | 66x43.00-25 | |
| Ownership costs1 | |||
| Depreciation ($/yr) | 19,454 | 19,469 | 19,526 |
| Interest ($/yr) | 8,171 | 8,177 | 8,201 |
| Insurance & taxes ($/yr) | 6,485 | 6,490 | 6,509 |
| Ownership cost ($/SMH) | 17.06 | 17.07 | 17.12 |
| Operating costs2 | |||
| Fuel ($/PMH) | 5.55 | 5.55 | 5.55 |
| Lube ($/PMH) | 2.05 | 2.05 | 2.05 |
| Repair & maintenance ($/PMH) | 12.51 | 12.52 | 12.55 |
| Tires ($/PMH) | 0.91 | 1.35 | 1.55 |
| Wage and benefits ($/PMH) | 18.57 | 18.57 | 18.57 |
| Operating cost ($/SMH) | 27.71 | 28.02 | 28.19 |
| Total machine costs | |||
| Total cost ($/SMH) | 44.77 | 45.09 | 45.31 |
| Total cost ($/tonne) | 1.96 | 1.80 | 1.97 |
1 $136,000 purchase price, 9 percent interest rate, insurance and
tax rate of 5 percent of purchase price [2], 5 year life, 70 percent utilization,
$10.00 per hour labor cost plus 30 percent benefits, and 2000 scheduled machine
hours (SMH) per year.
2 A fuel cost of $0.30 per liter was used, with a lube and oil rate
of 36.8 percent of hourly fuel cost, and a fuel consumption rate of 0.14 l/kw-hr
[2].
It should be noted that these skidding cost calculations assume the skidders are not limited by feller-buncher, loader, and hauling functions and the logger can move this additional wood. These limiting functions would lower skidder utilization, resulting in decreased skidding productivity and increased skidding costs.
Since skidding cost per tonne is directly proportional to skid distance, it is useful to determine a breakeven point for total skid distance, which is reflected in Figure 4.

Display large image of Figure 4
Figure 4. Skidding cost per green tonne as a function of total skid
distance for each tire size.
The 86-cm tires had a lower cost per tonne than the other tire sizes over the full range of total skid distance. Costs ranged from $1.13 to $2.16 per tonne for the 86-cm tires. For total skid distances from 244 to 518-m , the 78-cm tires were more economical than the 109-cm tires, with costs ranging from $1.39 to $2.01 per tonne. Beyond a total skid distance of 518-m, the 109-cm tires had a lower cost per green tonne than the 78-cm tires. At a total skid distance of 427-m cost was $1.75, $1.49, and $1.89 per tonne for the 78-cm, 86-cm, and 109-cm tires, respectively.
SUMMARY AND CONCLUSIONS
The primary objective of this study was to determine skidding productivity and costs for selected tire widths during the wet season. The study showed that there was an advantage to using 86-cm wide tires over 78-cm and 109-cm tires to skid during wet conditions.
Production rates for the three tire sizes, using Least-Squares Mean productivities to adjust for differences in travel distance, were 32.7, 35.8, and 32.9 tonnes per PMH for the 78-cm, 86-cm, and 109-cm tires, respectively. Whole-tree skidding cost using 86-cm tires was $1.80 per tonne compared to $1.96 and $1.97 per tonne for the 78-cm and 109-cm tires, respectively. After adjusting for delimbing and topping loss and using two skidders, the 86-cm tires have the potential to provide the logger with 1.4 additional truck loads per day as compared to the 78-cm tires and 1.2 truck loads per day as compared to the 109-cm tires. However, if the logger is not able to move this additional wood due to constraining factors such as felling, loading, hauling, or quotas, the benefit in using wider tires would be negatively impacted.
Caution should be exercised when using these results outside of the conditions studied. Since the study was conducted for a particular slope class, stand density, and moisture content level, results are likely to change when varying these conditions. Also, these are results of one test and a replication of the study would instill greater confidence in and better justify the results shown here.
There is some reluctance by loggers to using wider tires. When transporting a skidder from one site to another, there exists additional overhang with 86-cm and 109-cm tires as opposed to 78-cm tires. This results in having to acquire more expensive hauling permits to accommodate this additional overhang. Also, rear axles on older skidders may not be able to handle the higher torque required by wider tires. This would require replacing a standard rear axle with a heavy duty one, which could cost $10,000 to $15,000. However, using a cost of $15,000 to replace a rear axle to enable a skidder to handle 86-cm tires raises the cost per tonne by only $0.12. Since new skidders are being manufactured with heavy duty axles as standard equipment, tire life of standard 28Lx26 (71-cm) tires has dramatically decreased. According to some loggers, a tire life of only nine or ten months can be realized with 71-cm tires. Less contact area with 71-cm tires coupled with heavy duty axles increases slippage, causing pre-mature wear.
AUTHOR CONTACT
John can be reached by e-mail at
jklepac@fs.fed.us
REFERENCES
[1] Brinker, R.W., J.F. Klepac, B.J. Stokes, and J.D. Roberson. 1996. Effect
of tire size on skidder productivity. In: Proceedings of a Joint Conference
of the Canadian Woodlands Forum, the Canadian Pulp and Paper Association, and
the International Union of Forest Research Organizations; 1996 September 9-11;
Quebec City, Quebec. Canadian Woodlands Forum, Canadian Pulp and Paper Association,
Montreal, Quebec: 85-89.
[Return to text]
[2] Brinker, R.W., D. Miller, B.J. Stokes, and B.L. Lanford. 1989. Machine
rates for selected forest harvesting machines. Circular 296. Alabama Agricultural
Experiment Station. 23p.
[Return to text]
[2] Brinker, R.W., D. Miller, B.J. Stokes, and B.L. Lanford. 1989. Machine
rates for selected forest harvesting machines. Circular 296. Alabama Agricultural
Experiment Station. 23p.
[Return to text]
[3] Clark, A.C. and J.R. Saucier. 1990. Tables for estimating total-tree weights,
stem weights, and volumes of planted and natural southern pines in the Southeast.
Georgia Forest Research Paper 79. 23p.
[Return to text]
[4] Commercial Tires. 1998. Personal communications.
[Return to text]
[5] Foth, H.D. 1984. Fundamentals of soil science. Seventh edition. John Wiley
& Sons, New York, 435p.
[Return to text]
[6] Meek, P. 1994. A comparison of two skidders equipped with wide and extra-wide
tires. Field Note No.: Skidding/Forwarding-28. For. Eng. Res. Inst. of Can.
48p.
[Return to text]
[7] Rummer, R.B. and D.L. Sirois. 1984. A preliminary assessment of tire-size
effects on the productivity and site impacts of skidders operating on steep
terrain. ASAE Paper 84-1619. 16p.
[Return to text]
[8] SAS Institute Inc., SAS/STAT Users Guide, Release 6.03 Edition. Cary,
NC: SAS Institute Inc., 1988. 1028p.
[Return to text]
[9] Smith, H.C., N.E. Bell, and J.F. Stroud. 1916. Soil survey of Barbour County,
Alabama. Washington - GPO, 50p.
[Return to text]
[10] Stokes, B.J. and W.F. Watson. 1990. Wood recovery with in-woods flailing
and chipping. In: Proceedings of the 1990 Tappi Pulping Conference; 1990 October
14-17; Toronto, Ontario. Atlanta, GA: Tappi Press; 1990: 851-854.
[Return to text]