
Display large image of Figure 1
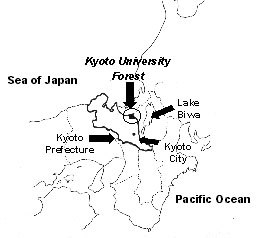
Figure 1. Location of Kyoto University Forest
January 2001. Vol 12, No. 1
Masami Shiba
Kyoto University
Kyoto, Japan
ABSTRACT
This paper presents the use of a set of spatial statistics to quantify the forest landscape pattern caused by the patchwork of timber harvesting and the subsequent coniferous plantations made over a 60-year period (1921-1981) in the natural forests of Kyoto University Forests. Aerial photography and orthophotography were used to analyze spatial patterns of forest cover changes at patch level between 1974 and 1996. Base maps of forest pattern were digitized in raster format using four dominant forest cover types in the study area The total number of digitized patches for 1974 and 1996 were 435 and 453, respectively. Four groups of indices were employed to quantify landscape heterogeneity and pattern for each of the two years: (1) patch size; (2) patch abundance; (3) patch shape; and (4) patch spacing. Patch abundance and patch spacing measures provided considerable information on major patterns of forest landscape dynamics over time. Patch size and shape indices contributed information on specific characteristics of the individual patches and may be useful for applications designed to study specific interior and edge habitats or for the prescription of forest cutting patterns and/or cutting-unit size. The net loss of forest covers that occurred during 60-year period trends to be balanced primarily by regeneration of areas cut before 1943 and secondarily by plantation of areas cut before 1965.
Keywords: landscape fragmentation, timber harvesting, spatial statistics, GIS.
INTRODUCTION
Most forest landscapes have been influenced by a number of land management activities (e.g. forestry practices, regional planning, and natural resource development); the resulting landscape mosaics are a mixture of natural and managed forest patches that vary in size, shape, and arrangement. This spatial patterning is a unique phenomenon that emerges at the landscape level. Landscape fragmentation is the process of creating an increasingly complex mosaic of patches as a result of disturbances, including human activity. Questions about effects of fragmentation of forest landscape on wildlife, and other terrestrial and/or aquatic ecosystem characteristics have been posed and alternative management approaches suggested [11, 16, [18], 19]. However, management alternatives have not been quantitatively evaluated because of difficulties of conducting landscape-level experiments: that is, landscapes are spatially heterogeneous areas, the structure, function, and change of landscape are themselves scale-dependent [5, 14]. Given that fragmentation as the result of timber harvesting practices will continue in most of forest landscape, we must try to alleviate fragmentation effects by using new insights into management strategies as well as the modification of management alternatives based on landscape perspectives. Quantitative measures of fragmentation and models are therefore urgently needed to prescribe the location, size and shape of future harvest units and residual patches of natural forests. With proper design, forest landscapes should be able to achieve desired potential habitat values and maintain biological diversity [8, 9, 15].
In this paper, the author reviews the use of a set of spatial statistics to quantify the forest landscape fragmentation caused by the patchwork of timber harvesting practices made over a 60-year period (1921-1981) in the natural forests of Kyoto University Forests (4186ha). In these forests, dispersed relatively small post-harvest units of coniferous plantation, and second-growth stands now exist on the landscape previously dominated by extensive old natural forests consisting of Fagus crenata, Quercus mongolica var. grosserrata, Betula grossa, and Cryptomeria japonica. Consequently, the landscape has become more spatially heterogeneous.
The objectives of this research were: (1) to identify the significant relationships that exist between pattern and process of heterogeneous mosaics of forest patches through time in pilot study area, (2) to develop some indices of spatial pattern derived from information theory, fractal geometry and GIS techniques to measure fragmentation, and (3) to describe the aspects of forest fragmentation which occurred as the result of timber harvesting and the subsequent coniferous plantation practices.
OUTLINES OF STUDY AREA
Kyoto University Forests (4186ha) is located in the northeastern border part of Kyoto Prefecture and stretches 6km east to west and 7km north to south in a rectangular shape. The area is characterized by high relief with altitudes ranging from 355 to 959m above the sea level (slope gradients between 30 and 40 degrees) and encompasses the headwater zones of Yura River flowing into the Sea of Japan. Mesozoic strata comprising siliceous shale rocks, which are easily collapsed by rainfall, are widely distributed. Predominantly fine-grained, humus-riched brown soils are generally deep while podozolic soils rarely appear along the ridge sites of relatively higher elevation. Mean annual temperature is 13.1C and mean annual precipitation is 2,333mm. There is a heavy snowfall ranging from 1 to 3m in winter seasons (Figure 1).
Display large image of Figure 1
Figure 1. Location of Kyoto University Forest
This region is situated in the transition part between temperate deciduous forest zone where the main species are Aesculus turbinate and Pterocarya rhoifolia in the lower valley sites, Fagus japonica and Quercus cripula in the upper slope above 600m, and Cryptomeria japonica, Clethra barbinervis and Ilex pedunculosa in the ridge portions above 700m, and warm temperate forest zone where the main species are Quercus salicina and Quercus sessilifolia under 600m altitude [17].
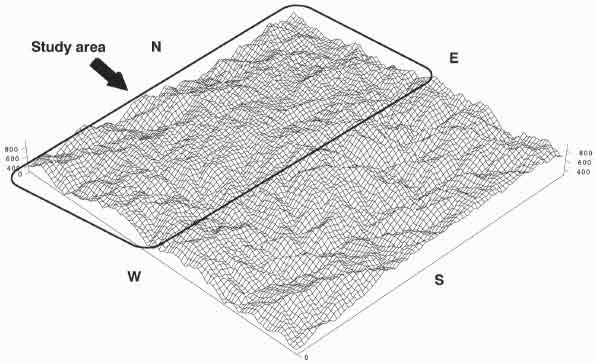
The study area is in the northern part of Kyoto University Forests and stretches 5km east to west and 4km north to south in a rectangular shape (Figure 2). In this area, dispersed various sizes of post-harvest units with coniferous plantation and second-growth stands now exist on the landscape previously dominated by extensive old natural forests where the main species are Fagus crenata, Quercus mongolica var. grosserrata, Betula grossa, and Cryptomeria japonica. Consequently, the landscape has become more spatially heterogeneous.

Display large image of Figure 2
Figure 2. Overview of Kyoto University Forest and the study area.
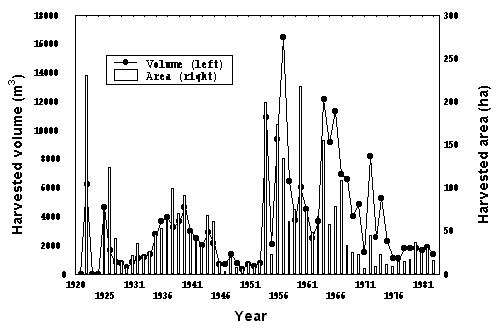
This modification of natural forests in the study area occurred during the 60-year period (1921-1981) (Figure 3). Before 1950, there was a relatively small change in the harvested area. More extensive landscape modification resulted from different management policies in the 1950s and 1960s. From the early 1970s, while clearcuts were still allowed, there was a shift towards smaller cutting units, as selective cutting was requested by the stakeholders. After 1982, harvesting was in principle prohibited and major parts of the forests reserved for conservation [10, 13].

Display large image of Figure 3
Figure 3. Historical changes in area and timber volume harvested over
a 60-year period (1921-1981) in the study area.
DATA ACQUISITION AND PROCESSING
A 22-year (1974-1996) trend analysis of forest pattern was made using orthophotography (scale 1:5000) for transferring forest cover types interpreted from colour aerial photographs taken in 1974 and 1996, toimage positions, and also for creating digital elevation model (DEM). Base maps of forest pattern were obtained by delineating and classifying homogenous patches following the forest cover classification system of Kyoto University Forests, where forest cover is classified as either coniferous plantation forest, mix forest of natural broadleaved and coniferous trees, or non-stocked forest covers. Consequently, four forest cover types occupying the greater proportion of abundance in the study area were used and these cover types included NI (mixed forest of natural coniferous and broadleaved trees - coniferous canopy cover > 80%), NLI (mixed forest of natural coniferous and broadleaved trees - coniferous canopy cover 50 - 80%), LNI (mixed forest of natural broadleaved and coniferous trees - coniferous canopy cover 20 - 50%), and ART (coniferous plantation forest). Throughout this paper the author refers to cover type using such a symbol notation.
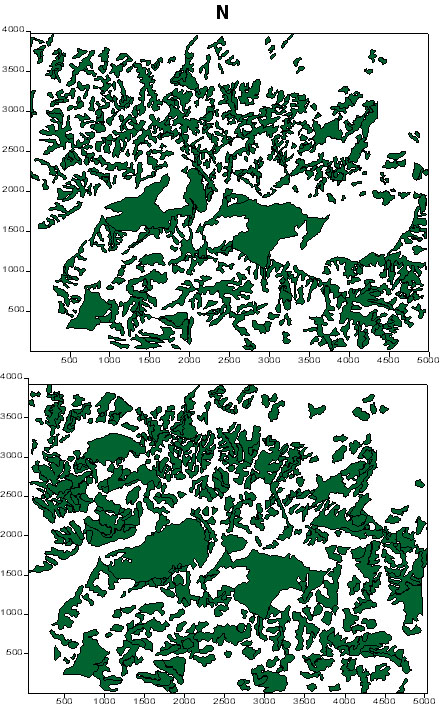
Using a Geographic Information System (IDRISI GIS), the base maps were digitized and separate transparent overlays were prepared for the two photo sets. Each patch was then classified according to cover during each period. The location, size, and shapes of each patch were further recorded as polygons for the subsequent spatial analysis with the GIS (Figure 4) [10, 13].
LANDSCAPE STATISTICS
The degree of fragmentation sustained by the forest matrix that characterizes a given landscape may be described as a function of the varying size, shape, spatial distribution, and density of patches. Thus the degree of fragmentation can be measured in a number of ways [2, 3, 4, 7].
Four groups of statistics were used to quantify landscape heterogeneity and pattern for each of the two years: (1) patch size; (2) patch abundance; (3) patch shape; and (4) patch spacing. Patch sizes and shapes were only determined for interior patches (i.e. patches that were not truncated by the borders of the landscape coverage). Briefly, patch size was expressed in terms of the average patch area and average patch perimeter. Patch shape was measured in three different ways: (1) edge density; (2) fractal dimension; and (3) a diversity index. All three indices are a function of the perimeter and area of a patch. Edge density was calculated simply from the ratio of patch perimeter to patch area. The fractal dimension was estimated by regressing the logarithm of patch area on its corresponding log-transformed perimeter. The appeal of fractal measure is that it can be applied to spatial features over a wide variety of scale. The diversity index was also calculated by using a perimeter-area relation. Theoretically, the diversity index increases to 1 as the unit approaches a circle, similar to the case of the fractal dimension. However, in contrast, the diversity index increases without limit as patch shape becomes more complex [12].

Display large image of Figure 4
Figure 4. Comparison of patch patterns for 1974 (upper) and 1996 (lower)
landscapes.
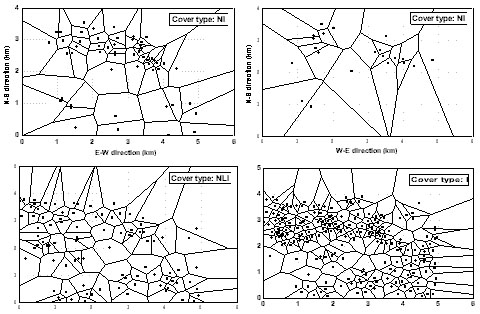
Patch abundance includes a measure of the each patch density (expressed as the number of each forest patch per landscape area) and percent in patches (the percent of the total landscape area occupied by forest patches). Patch spacing was characterized by measures of the mean nearest-neighbor distance and a measure of dispersion. The mean nearest-neighbor distance was calculated by measuring the distance from the centroid of each patch (patch centers of mass) to the centroid of its nearest neighbor and computing the mean distance for the sample landscape. Here, the dispersion of patches was graphically measured by producing scatter maps based on the Voronoi tessellation algorithm: the division is such that each of the data points (the centroid of patches) is surrounded by boundaries including only the area that is closer to its respective center data point than to any other neighboring points.
Student t-test and a non-parametric test (Wilcoxon match-pairs test) for the difference between mean values were performed for each landscape and year for each of the variables listed above to assess the ability of these variables to reflect landscape change.
RESULTS
The degree of forest fragmentation as measured by the indices discussed above is shown in Table 1.
The number of patches increased 4% from 435 in 1974 to 453 in 1996. A small increase in the number of patches resulted from a decrease in NI patches and a more pronounced increase in NLI patches. There has been a relatively small change in LNI and ART patches. The LNI was the dominant cover type and encompassed nearly 41% of the landscape throughout the study period. Following LNI, the NLI was the next most abundant cover type and its area increased from 29.0% in 1974 to 34.5% in 1996. Percentage of ART decreased slightly from 24.2% in 1974 to 23.2% in 1996. A more pronounced change was the decrease in NI patch area from 6.0% to 2.7%, but mean patch size increased 34% from 0.79 to 1.06ha. The largest mean patch sizes were observed for ART patches: 4.68ha in 1974 and 5.40ha in 1996, respectively. An increase in mean patch size among individual cover types ranged from 15% (ART) to 46% (LNI).
Mean patch perimeter declined in all cover types except LNI, although mean patch area increased slightly through time. LNI patches occupied from 32.7% to 38.2% of total amount of perimeter in the landscape. The steep increase in both LNI patch perimeter and area may be partly due to the result of coalescence of several neighboring patches.
The complexity of patches, as measured by edge density and diversity index, declined in all cover type. Edge density decreased approximately 24% for NI, NLI and ART patches while it decreased 8% for LNI patches. A decrease in diversity index for NI, NLI and ART patches ranged from 10 to 14% and remained relatively constant. Diversity index of LNI varied little (1.7%). The diversity index closely followed the trends revealed for edge density. In contrast, the fractal dimension indicated a small increase in patch complexity for each cover type over time. The height fractal dimensions were observed for ART patch in 1974 (1.62) and for NI patch in 1996 (1.62). The lowest fractal dimensions were observed for NLI patch in 1974 (1.25) and for LNI patch in 1996 (1.30). The ART patches trended to have higher fractal dimensions than other natural cover types. The fractal dimension of NI increased notably from 1.35 to 1.62, probably because these stands are generally residual with fewer in number and smaller in size through the time. The relatively high fractal dimension ART may be attributed to the linking of several adjacent patches, which often produces irregularly shaped boundaries due to selective thinning, and also increased in emergent stands resulting from insufficient silvicultural operations on less productive plantation sites. As the fractal dimension and diversity index are a function of the perimeter and area of a given patch, similar trends were expected. However, the mean change in these two variables was in opposite direction: diversity index decreased while fractal dimension increased. The results may suggest that the fractal dimension is likely to detect subtle changes in patch configuration while diversity index appears to be a fairly robust measure of a patch shape [12].
The spatial patterns of cover types have also varied through time, as indicated by changes in the mean nearest-neighbor distance and the Voronoi tessellation divisions surrounded by boundaries between the individual centroid of patches (Figure 5). The mean nearest-neighbor distance decreased 6.5% from 1.84km to 1.72km for NI and 5.5% from 2.36km to 2.23km for NLI through time. Amount of changes in the properties of the two cover types differed strongly among locations. The number of NI patches decreased nearly 40% from 53 in 1974 to 21 in 1996, and most of these losses occurred in the southern portions of the study area while the remainder was concentrated in the northern portions. There was a 41% increase in the number of NLI patches, resulting from a rapid increase in the number of new regular-isolated patches with smaller distances to the neighboring patches in the northern and southern portions of the study area. In contrast, the mean nearest-neighbor distance increased 3.4% from 2.26km to 2.34km for LNI. This increase may be partly due to a regular, dispersed spacing pattern that occurred at southeastern portion of the study area.
Consequently, there was not the statistical significance of Wilcoxon match-pairs test for each of the variables to reflect landscape change between 1974 and 1996.
CONCLUSIONS
The ecological significance of fragmentation demands monitoring its development in managed landscape, which in tern requires quantitative measures of fragmentation [4].
This study documents spatial and temporal changing in forest landscape at patch level and focuses on detecting patterns of forest cover changes as a result of timber harvesting and the subsequent coniferous plantation practices occurred in the natural forests of Kyoto University Forests. To assess the forest landscape fragmentation of a given study area, four groups of statistics were employed: patch size, patch abundance, patch shape and patch spacing. By comparing two sets of data representing two dates over a 22-year period (1974-1996), the author found that patch abundance and patch spacing measures provided considerable information on major patterns of forest landscape dynamics over time. Patch size and shape statistics contribute information on specific characteristics of the individual patches and may be useful for applications designed to study specific interior and edge habitats or for the prescription of forest cutting patterns and/or cutting unit size [1, 8].
Table 1. Descriptive statistics for 1974 and 1996 forest landscapes.
| Variable | Cover type Year | Mean | Standard deviation | Minimum | Maximum | Coefficient of variation | t-value (p-value) |
| Patch size | |||||||
| Mean patch | NI1974 | 0.462 | 0.356 | 0.139 | 2.290 | 0.771 | |
| perimeter (km) | NI1996 | 0.438 | 0.215 | 0.153 | 1.020 | 0.491 | 0.052 |
| NLI1974 | 0.758 | 0.898 | 0.171 | 6.780 | 1.190 | ||
| NLI1996 | 0.688 | 0.494 | 0.178 | 3.110 | 0.718 | 0.832 | |
| LNI1974 | 0.728 | 0.861 | 0.107 | 7.470 | 1.180 | ||
| LNI1996 | 0.843 | 0.831 | 0.142 | 6.020 | 0.986 | 1.400* | |
| ART1974 | 1.040 | 1.680 | 0.083 | 8.260 | 1.620 | ||
| ART1996 | 0.964 | 1.360 | 0.092 | 8.200 | 1.410 | 0.106 | |
| All cover types | ALL1974 | ||||||
| ALL1996 | ( 0.404 ) | ||||||
| Mean patch | NI1974 | 0.794 | 0.833 | 0.108 | 4.880 | 1.050 | |
| area (ha) | NI1996 | 1.060 | 1.120 | 0.157 | 5.310 | 1.060 | 1.470 |
| NLI1974 | 1.470 | 2.130 | 0.115 | 15.200 | 1.450 | ||
| NLI1996 | 1.750 | 1.760 | 0.224 | 12.100 | 1.010 | 0.956 | |
| LNI1974 | 1.360 | 2.060 | 0.078 | 18.500 | 1.520 | ||
| LNI1996 | 1.990 | 2.540 | 0.078 | 18.500 | 1.280 | 2.810* | |
| ART1974 | 4.680 | 12.400 | 0.043 | 60.900 | 2.650 | ||
| ART1996 | 5.400 | 13.000 | 0.059 | 60.100 | 2.410 | 0.318* | |
| All cover types | ALL1974 | ||||||
| ALL1996 | ( 1.250 ) | ||||||
| Patch shape | |||||||
| Edge density(m/m2) | NI1974 | 0.071 | 0.019 | 0.030 | 0.129 | 0.265 | |
| NI1996 | 0.054 | 0.017 | 0.019 | 0.098 | 0.320 | 4.950 | |
| NLI1974 | 0.064 | 0.019 | 0.032 | 0.157 | 0.301 | ||
|
NLI1996 |
0.049 | 0.014 | 0.017 | 0.103 | 0.294 | 6.410 | |
| LNI1974 | 0.068 | 0.021 | 0.028 | 0.179 | 0.305 | ||
| LNI1996 | 0.063 | 0.059 | 0.022 | 0.702 | 0.939 | 1.210 | |
| ART1974 | 0.069 | 0.039 | 0.013 | 0.193 | 0.561 | ||
| ART1996 | 0.052 | 0.030 | 0.003 | 0.156 | 0.568 | 2.440* | |
| All cover types | ALL1974 | ||||||
| ALL1996 | ( 5.320 ) | ||||||
| Fractal dimension | NI1974 | 1.35 | |||||
| NI1996 | 1.62 | ||||||
| NLI1974 | 1.25 | ||||||
| NLI1996 | 1.35 | ||||||
| LNI1974 | 1.26 | ||||||
| LNI1996 | 1.30 | ||||||
| ART1974 | 1.53 | ||||||
| ART1996 | 1.58 | ( 0.068 ) | |||||
| Diversity index | NI1974 | 1.480 | 0.348 | 1.080 | 2.920 | 0.235 | |
| NI1996 | 1.280 | 0.174 | 1.090 | 1.720 | 0.136 | 2.630 | |
| NLI1974 | 1.720 | 0.623 | 1.100 | 4.910 | 0.362 | ||
| NLI1996 | 1.490 | 0.367 | 1.040 | 2.700 | 0.246 | 3.430 | |
| LNI1974 | 1.730 | 0.621 | 1.080 | 4.890 | 0.359 | ||
| LNI1996 | 1.760 | 1.110 | 1.060 | 13.500 | 0.631 | 0.453 | |
| ART1974 | 1.640 | 0.531 | 1.030 | 2.990 | 0.324 | ||
| ART1996 | 1.470 | 0.464 | 0.722 | 2.990 | 0.316 | 1.190 | |
| All cover types | ALL1974 | ||||||
| ALL1996 | ( 1.900 ) | ||||||
| Patch abundance | |||||||
| Patch density(no./area) | NI1974 | 53 | |||||
| NI1996 | 21 | ||||||
| NLI1974 | 137 | ||||||
| NLI1996 | 193 | ||||||
| LNI1974 | 209 | ||||||
| LNI1996 | 197 | ||||||
| ART1974 | 36 | ||||||
| ART1996 | 42 | ||||||
| All cover types | ALL1974 | 435 | |||||
| ALL1996 | 453 | ( 0.686 ) | |||||
| Percent in patchs | NI1974 | 0.044 | 0.046 | 0.006 | 0.272 | 1.050 | |
| NI1996 | 0.059 | 0.062 | 0.009 | 0.296 | 1.060 | 1.470 | |
| NLI1974 | 0.082 | 0.119 | 0.006 | 0.846 | 1.450 | ||
| NLI1996 | 0.097 | 0.098 | 0.013 | 0.675 | 1.010 | 0.956 | |
| LNI1974 | 0.076 | 0.115 | 0.004 | 1.030 | 1.520 | ||
| LNI1996 | 0.111 | 0.141 | 0.004 | 1.030 | 1.270 | 2.810 | |
| ART1974 | 0.261 | 0.691 | 0.002 | 3.390 | 2.650 | ||
| ART1996 | 0.301 | 0.726 | 0.003 | 3.350 | 2.410 | 0.318 | |
| All cover types | ALL1974 | ||||||
| ALL1996 | ( 1.250 ) | ||||||
| Patch spacing | |||||||
| Nearest-neighbor distance (km) | NI1974 | 1.84 | 1.03 | 0.08 | 5.01 | 0.56 | |
| NI1996 | 1.72 | 0.96 | 0.10 | 4.00 | 0.56 | 1.670 | |
| NLI1974 | 2.36 | 1.21 | 0.06 | 6.12 | 0.51 | ||
| NLI1996 | 2.23 | 1.15 | 0.08 | 5.99 | 0.52 | 8.170 | |
| LNI1974 | 2.26 | 1.14 | 0.08 | 5.58 | 0.50 | ||
| LNI1996 | 2.34 | 1.16 | 0.00 | 6.17 | 0.50 | 7.080 | |
| ART1974 | 2.02 | 1.34 | 0.05 | 4.81 | 0.66 | ||
| ART1996 | 2.03 | 1.19 | 0.06 | 4.84 | 0.59 | 0.233 | |
| All cover types | ALL1974 | ||||||
| ALL1996 | ( 0.465 ) | ||||||
Remarks: t-value with the * is statistically significant at the 5% level; ( p-value ): Wilcoxon match-pairs test.
The net loss of forest covers that occurred during 60-year period tends to be balanced primarily by regeneration of areas cut before 1943 and secondarily by plantation of areas cut before 1965. This is an important factor in assessing the restoration of unstable natural forest stands and effective post-harvest management of plantation forests. Current concerns over forest fragmentation are typically related to a landscape condition which a complex mosaic of patches - dispersed various sizes of post-harvest units with plantations and second-growth stands existing on the landscape previously dominated by extensive old natural forests - occurred resulting from timber harvesting over the last 60 years (1921-1981). This study suggests that on relatively major harvested areas concentrated in the northwestern and central portions of the study area this condition is not pronounced, in contrast to the non-harvested remainder in the northern portions of the study area: these changers were most strongly correlated with changes in NI patches. The results of this simplified analysis may not be adequate for comprehensive landscape management because biological and environmental variation were not considered. However, statistics capable of quantifying patch shape and spatial distribution can describe the several aspects of forest fragmentation that occur as the result of timber harvesting, and may prove important in evaluating of the changing character of interior and edge habitats. The quantitative measures introduced here could be easily applied to remotely sensed data, which would permit monitoring of landscape-level change, and also to data in a GIS [6]. However, it is important to note that the value of any measurement is a function of how the landscape units were classified and the spatial scale of the analysis. Both classification and scale must be carefully considered in the analysis of forest landscape fragmentation in mountainous areas.

Display large image of Figure 5
Figure 5. Voronoi tessellation diagrams for 1974 (left) and 1996 (right)
landscapes by cover types.
ACKNOWLEDGEMENTS
The author sincerely thanks his former student of Forest Information and Resource Management Science of Kyoto University, Mr. Munehiro Okabe, for help with the data analysis. This work was partially supported by a Grant-in-Aid for Scientific Research (Project No. 11660148) from the Ministry of Education, Science, Sport, and Culture, Japan.
AUTHOR CONTACT
Dr. Shiba can be reached by e-mail at
mshiba@kais.kyoto-u.ac.jp
REFERENCES
[1] Baskent, E.Z. 1999. Controlling spatial structure of forested landscapes: a case study towards landscape management. Landscape Ecology 14: 83-97.
[2] Cain, D.H., K. Riitters, and K. Orivis. 1997. A multi-scale analysis of landscape statistics. Landscape Ecology 12: 199-212.
[3] Dunn, C.P., D.M. Sharp, G.R. Gunternspergen, F. Stearns, and Z. Yang. 1991. Methods for Analyzing Temporal Changes in Landscape Pattern. In: Turner, M.G. and Gardner, R.H. (ed) Quantitative Methods in Landscape Ecology. Springer-Verlag, New York, pp.173-198.
[4] Fortin, M.J. 1999. Spatial Statistics in Landscape Ecology. In: Klopatek, J.M. and Gardner, R.H. (ed) Landscape Ecological Analysis. Spring-Verlag, New York, pp.253-279.
[5] Franklin, J.F. 1992. Scientific basis for New Perspective in Forest and Streams. In: Robert, J.N. (ed) Watershed Management. Springer-Verlag, New York, pp.25-72.
[6] Frohn, R.C. 1997. Remote Sensing for Landscape Ecology. Lewin Publishers, Florida, 95pp.
[7] Hess, G.R. and J.M. Bay. 1997. Generating confidence intervals for composition- based landscape indexes. Landscape Ecology 12: 309-320.
[8] Li, H., J.F. Franklin, F.J. Swanson, and T.A. Spies. 1993. Developing alternative forest cutting pattern: A simulation approach. Landscape Ecology 8(1): 63-75.
[9] LiGro, J. 1991. Assessing Patch Shape in Landscape Mosaics. Photogrammetric Engineering and Remote Sensing 57(3): 285-293.
[10] Okabe, M. 1999. Measuring of fragmented landscape patterns resulting from timber harvesting activities in Kyoto University Forests. Bachelor thesis, Kyoto University, Kyoto (in Japanese).
[11] Pan, D., G. Domon, S. Blois, and A. Bouchard. 1999. Temporal (1958-1993) and spatial patterns of landscape changes in Haut-Saint-Laurent (Quebec, Canada) and their relation to landscape physical attributes. Landscape Ecology 14: 35-52.
[12] Ripple, W.J., G.A. Bradshaw, and T.A. Spies. 1991. Measuring Forest Landscape Patterns in the Cascade Range of Oregon, USA. Biological Conservation 57: 73-88.
[13] Shiba, M. and M. Okabe. 1999. Quantitative analysis of fragmented forest landscape structure resulting from timber harvesting practice (?). Transaction of the 110th Meeting of Japanese Forestry Society 2: 798-799 (in Japanese).
[14] Tang, S.M., J.F. Franklin, and D.R. Montgomery. 1997. Forest harvest patterns and landscape disturbance process. Landscape Ecology 12: 349-363.
[15] Traub, B. and C. Kleinn. 1996. Quantitative Charakterisierung von Waldflaechenform [Quantitative Assessment of Forest Patch Form]. Allgemeine Forst und Jagdzeitung 168(2): 30-40.
[16] Turner, M.G. 1990. Landscape Changes in Nine Rural Counties in Georgia. Photogrammetric Engineering and Remote Sensing 56(3): 379-386.
[17] Yasuda, S. and H. Nagamatu. 1995. Flora of Ashiu, Japan. Contributions from the Biological Laboratory, Kyoto University 28: 367-486.
[18] Zampella, R.A. and R. Lathrop. 1997. Landscape changes in Atlantic white cedar (Chamaecyparis thyoides) wetlands of the New Jersey Pinelands. Landscape Ecology 12: 397-408.
[19] Zheng, D., D.O. Wallin, and Z. Hao. 1997. Rates and patterns of landscape change between 1972 and 1988 in the Changbai Mountain area of China and Korea. Landscape Ecology 12: 241-254.