Vol. 12 No. 2 July 2001
Jori Uusitalo
University of Joensuu
Finland
Brian Orland
Pennsylvania State University
USA
The authors are Senior Lecturer, Faculty of Forestry, and Professor, Department of Landscape Architecture, respectively.
ABSTRACT
Scientists and managers are increasingly turning to computer modeling and visualization tools to enable them to evaluate the effects of harvest practices better, depict various characteristics and variation existing in the forest, and communicate the impact of environmental changes. This paper examines the suitability of virtual reality (VR) technology in supporting forest managers or forest owners in their decisions.
VR is particularly useful for helping to deal with the following issues in forest management planning: time dependence, irreversibility of decisions, spatial-quantitative variation of features and multiple objectives. It helps managers and stakeholders understand the relationship between underlying data and landscape planning. Some of the key challenges faced in making VR work are: insufficient resolution in forest inventory data, need to re-delineate stands to allow for multiple use planning, adjusting realism of features in the images and linking data currently held by a variety of disparate agencies and owners. Existing mean-based inventories will, for the short to medium term, limit the extent to which VR technologies are used in actual forest management planning.
Keywords: forest management, virtual reality, visualization, planning, computer modelling.
INTRODUCTION
Forestry is an area in which the accuracy of scientific predictions and the effectiveness of management strategies are measured by the success of their application on the ground. Unfortunately, the time scales within which forest systems respond and the inappropriateness of conducting large-scale experiments on a public resource frequently prevents the observation of real-world applications. To address these problems, scientists and managers are increasingly turning to computer modeling and visualization tools to enable them to project forest changes and estimate their impact. While the value of visualization in forestry is apparent, the increasing involvement of experts from other disciplines and the general public in forest decision-making has amplified the need for tools that can communicate about the future of forest resources and teach the dynamics of forest ecosystem processes.
For these reasons data visualization and virtual reality (VR) technology are receiving increasing attention in forestry decision-making. To date, visual representations have been used mainly to communicate the impact of environmental changes [17], evaluate the visual effects of forest harvest practices [6][16], depict various characteristics and variations existing in the forest [9] [15], or judge the visual quality of the landscape [25][5]. The aim of this paper is to examine the suitability of VR technology in supporting forest managers or forest owners in making forest management decisions. We will discuss and categorize various features of forest management and then analyze the extent to which the attributes of VR correspond with the demands of forestry. We will also define the biggest obstacles to extending the use of VR-based technology.
THE STATE OF THE ART IN FOREST VISUALIZATION
So far, two types of technology have been used for visualizing forest resources in the context of making decisions about forest management. Simplified computer graphic representations [9] [] [1] [12] are able to depict the presence of plant species, size classes and other parameters found in forest inventory databases. These approaches usually lack the ability to represent detailed aspects of forest landscape composition and thus are unable to achieve the visual realism that might be needed for a specific evaluation. In cases needing greater visual fidelity calibrated photographic images [2][14][16] have proved their effectiveness. In situations demanding strong validation of the visual conditions, however, it is more difficult to demonstrate close relationships with underlying tree data. These two categories have been called geometric modelling and video imaging respectively [13][12]. The applications generally rely on landscape-scale forest information databases and address the forest as a whole rather than on a tree-by-tree basis. The data is in large part from inventories that are related to management units represented in GIS databases.
In recent years, as a result of increased emphasis on ecological modeling and on work on the growth mechanisms of individual trees, the scientific visualization of the physiological processes and growth habits of single plants and trees has received increasing attention. In some instances scientific visualization has become an essential part of ecological modeling. Software products such as LIGNUM [19] and AMAP [22] incorporate knowledge about the effects of physiological processes on plant morphology and utilize visualization in understanding these phenomena.
Recent acceleration of the graphic performance capabilities of personal computers has permitted faster, more versatile and realistic forest visualizations than had previously been possible. Images of single plants can be created with high fidelity, either by texture-mapping techniques or by more sophisticated 3-D growth algorithms. Visualizations may be linked with spatial databases supplying cartographic information as well as stand boundaries and tree characteristics. There are no technological restrictions on constructing a virtual forest that is integrated with existing forest management and spatial databases and enable the viewer to become completely immersed in the visual experience of the forest.
Few developments in computing have received such enormous publicity over recent years as virtual reality. Despite the excitement that VR has generated and the market potential predicted for it, the use of VR has so far been restricted mainly to entertainment and computer games. There are, however, numerous areas where it has been expected to revolutionize traditional teaching, planning or management tasks. In the medical sciences VR has been seen as a critical interface, allowing physicians to access and use the vast expanse of available medical information and as a visualization tool for education, training and prototyping [23]. Automotive engineers and designers use VR technology to reduce production costs and development time and architects may design new buildings by interactive manipulation of shapes, sizes and material properties [11].
Recently published forest visualization tools are gradually achieving the characteristics that are commonly linked with real VR applications. The Forsi-simulator by the Finnish company Plustech achieves a high degree of fidelity in rendering forest scenery with texture-mapping techniques but does not allow the viewer to move around in a forest setting or to interact with underlying data. UVIEW, developed by Robert J. McGaughey of the USDA Forest Service, Pacific Northwest Research Station, generates simplified computer graphic representations that depict existing or desired landscape conditions. The system provides flexible analysis tools. The user may even "fly" over and around a low-resolution image using a mouse-controlled "virtual trackball". Monsu, developed by Timo Pukkala of the University of Joensuu, had originally been developed for multi-objective planning, but also possesses highly advanced visualization capabilities. SmartForest, developed at the Imaging Systems Laboratory, University of Illinois in collaboration with the USDA Forest Service and the University of Helsinki, does possess advanced tools for moving and interacting within and with a forest setting. The user can walk in the forest between trees as well as view large forest areas from above and classify stands and trees employing user-defined color-codes. Although the program can render ground and trees with realistic textures, it lacks photo-quality realism. Most of these programs have been developed for specific management purposes and are generally inadequate in other respects. However, recent progress indicates that linking visualization to forest management is here to stay and, as tools move from university labs to commercial products, they are gradually acquiring more advanced VR technology-based features.
CONSTRUCTING A VIRTUAL FOREST
VR implementations combine the use of various computer graphics systems with display and interface devices that provide observers with the effect of immersion in an interactive three-dimensional environment in which the objects have spatial presence [4]. This three-dimensional computer-generated environment is generally called a virtual environment (VE). Presenting data in a three-dimensional format does not in it itself make the display VR, although many technology providers readily attach the label VR to any three-dimensional application [29]. Although there are no generally approved definitions of VR, there are several criteria that commonly linked with the term.
· First and foremost, the VE should provide human perception with realistic depth information that enables observers to judge the correct three-dimensional relationships between virtual objects [29].
· Second, the VE should give observers the illusion of immersion within the environment. This requirement is somehow imprecise and is often relatively difficult to judge whether the application provides immersion or not. In any case, the VE should enable the user to navigate within the environment in all dimensions and traverse the world as if it were real.
· Third, the VE should enable the user to interact with the data displayed. The interface should allow total engagement and manipulation of the environment through simple actions rather than at the level of program and command structures [29] and the interface should minimize the distance between the thought processes of the user and physical requirements of the systems [7].
· Fourth, motion and interactions should provide the user with the illusion of media presence - where the environment responds as the user acts, without temporal or spatial delay. Visual images must be presented to the user at a frame rate of at least 10 frames per second in order to perceive changes in the visual image as continuous motion rather than series of still images [4]. Unfortunately, this requirement is usually constrained by lack of sufficient computer resources.
Constructing a large-scale virtual forest requires integrating information from various sources. Recent development in several areas of technology facilitates construction of virtual forests not only for special case studies but also wherever it may be seen to be beneficial. Developments in geodesy and satellite techniques provide relatively accurate information about the surface elevation of the earth. Adoption of GIS technology in forestry is already providing information about stand boundaries in digital format. Modern and highly detailed forest inventory techniques have been systematically applied on large scales and there has been a trend towards linking forest inventory data to other applications such as forest growth simulators. Moreover, escalation in computing power and developments in computer graphics and image editing ensure that construction of forest visualizations, or even virtual forests, with sufficient fidelity has been brought within the constraints of research projects and commercial application.
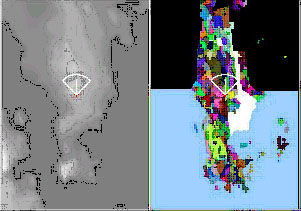
In most forest visualization applications, the terrain elevation, and hence the height of the base of tree objects, is read in the form of the digital elevation model (DEM). A DEM is a regular grid of terrain elevation values on which each point is interpolated from spot height measurement or contour data (Figure 1.) The national geological or geographical institutes of most countries provide elevation data for public use either in DEM or some similar format. A good alternative is to use a triangulated irregular network format (TIN) which can usually represent terrain better than DEM [20]. However, applying TIN in conjunction with other spatial data presented in grid format inevitably leads to more complicated mathematical calculations.
The second essential data component for forest visualization describes the spatial distribution and extent of different types of forest cover. In most cases, for the sake of economy, the forested landscape is divided into relatively homogeneous areas of distinct forest-cover called stands or coups (Figure 1). Most applications read information about such areas in a grid format. Digitizing of forest boundaries can be done with almost any commercial mapping program or digitizing tool since they can usually produce data in grid format or ASCII format convertible to grid format. To address the challenge of a wide range of different types of grid formats, GIS software is used for conversion to the format desired. Alternatively, visualization applications provide special conversion programs that make it possible to integrate data from the most important mapping tools.
Figure 1. A map window of SmartForest displaying DEM as a grayscale relief and stand polygons by different colors.
The topographic information derived from the DEM and the cartographic coordinates of stand delineation provides the basic spatial information for visualizing forest data. Assigning spatial coordinates to single data items (trees, stones, houses, etc.) is a critical step in developing visualizations. The earliest forest visualizations treated such data quite literally. SmartForest-I [15] used stem-by-stem forest stand inventories as their data source. Each individual tree was located and scaled within 3-dimensional space according to the xy coordinates of its base and stored values for height, trunk diameter and crown shape. This situation represents a simplest case in which each item has a discrete and unique spot in space — the data items are self-spatialized. However, such data sets for real forests are so extensive and item-by-item inventory so expensive that developing such visualizations would be prohibitively expensive. For more usual situations data is collected by various sampling methods, summarized, and later represented by techniques involving reconstitution, expansion, and spatialization of the data.
Information on location, size, shape and condition of tree objects is probabilistically generated from inventory listings of forest stand composition. Until recently most forest inventory systems have yielded only stand-level information such as total volume, mean diameter, age and site type. However, driven by the increasing use of single-tree growth and yield models, there are now several methods of deriving a theoretical tree list from stand-level information. While it is unnecessary to model trees individually, the variations in the different characteristics of the trees can be efficiently described by a list of 10-150 surrogate trees, each standing for a whole class of "n" nearly identical trees. A list of all trees in a stand is rarely available, and in most cases unnecessary, since trees are generally not managed with a high degree of specificity. Surrogate trees are required as the inputs to forest growth simulators such as Forest Vegetation Simulator [30] or MELA [24]. These simulators can then provide output lists of surrogate trees reflecting the projected growth and other tree-level information needed in forestry decision-making. Since growth and yield models are central to forest production management, they are also the most important tools to link to a visualization system.
Visualization software does not distinguish forest and other land uses, or trees and other objects, in the landscape. Thus other landscape areas such as lakes, roads and fields can be represented by separate colors or texture-maps and realistic textures. Other objects such as houses, rock outcrops or power-lines, which enhance the realism of the imagery, can also be visualized In many countries, local geographical institutes are able to provide such land use data or cartographic objects in digital format for public use. A key issue of difference among objects to be included arises when precise location and orientation are necessary. In large part the visualization of trees, rock outcrops and meadows does not require precise location or orientation, especially when such objects are distributed probabilistically from a tree list, or rock list, and a grid format stand map designating land use. Houses, power-lines and road surfaces do, however, demand precise representation of direction and cartographic location, data not normally part of the sample-based database of forest components. Incorporation of such elements requires integration of databases either with much higher grid resolution if in raster format, or with vector format data. In either case the inclusion of such objects adds complexity to the database to be rendered, which will be accompanied by reductions in performance in rendering the forest component of the scene. The VE designer must therefore carefully consider the extent to which each cartographic object is vital to the appearance and performance of the VE.
CHARACTERISTICS OF FOREST MANAGEMENT AND THEIR COMPATIBILITY WITH VIRTUAL TECHNOLOGY
Time-Dependence
Management decisions in forestry are heavily time-dependent. The rotation periods of commercially exploited forests vary from 12 years for tropical forests to 100-150 years for boreal forests. Since a clear cut can be done in a boreal forest stand only once in a human lifetime, it is critical to know that the cut is executed in the right way and at the right moment to achieve the desired end. Thinning operations cannot be considered a separate activity since they affect the growth and condition of the remaining trees. Each thinning affects the yield of not only the current operation but also all subsequent thinning. In addition to the long-cycle changes due to annual growth and eventual death or harvesting, each season has its own special characteristics that have significant impact on forest scenes, which in turn may have significance for proposed forest development.
In all these instances visualization can greatly aid the evaluation of alternative long-term plans. Logging operations in most cases have radical effects on the scenery, which will recover, but gradually and often only over a considerable time. Forests grow, and change their character and appearance continuously. Observers may have difficulty comprehending and synthesizing the complex interactions that occur over prolonged time periods, especially when they extend beyond a human lifetime.
Forest visualization enables the observer to perceive changes in the forest without temporal limitations. Future forest growth can be simulated and images created to show how the forest will look after a specified period. Forest growth simulation is generally carried out by complex programs that link numerous forest models together. Growth projections are then obtained by creating a seamless link between simulator and stand databases. Successions of growth simulations may be illustrated [12]. These types of growth visualization facilitate discussion of treatment alternatives, as well as promoting better understanding of natural and man-made stand conditions and of the limits of the predictive power of the models themselves. In Finland, for example, visualization is regarded as a powerful means of to assisting ever-increasing numbers of urban forest owners with little technical forestry knowledge to understand forest dynamics and their huge impact on forest and scenic resources over time.
Beside supporting the traditional forest management tasks associated with silvicultural treatments and harvesting, visualization has the potential to communicate the extent and severity of major environmental changes, such as insect outbreaks, pollution problems and so on. Forest damage visualization can be readily constructed with the help of image libraries containing source images representing various degrees of damage. Experts are used to identify plausible scenarios associated with images of forest damage. In such situations, visualization can be vital in developing awareness of emerging problems, and in motivating agencies and individuals to respond [14].
Irreversible Decisions
Within a human lifetime many processes of environmental change are essentially irreversible. Logging activities are especially visible and have a huge impact on scenery and recreational activities as well as on the future growth and yield of timber resources. Although forestry is generally guided or constrained by governmental legislation or recommendations, the decision-maker always has several alternative strategies to choose from in terms of logging methods and intensities.
The use of a virtual forest makes it possible to assess the consequences of each alternative before they occur. Various hypothetical cutting methods and delineation of the cutting area and logging intensities can be tried and projected to examine future effects. This type of preview and opportunity for trade-off can be especially valuable in areas of great scenic beauty or when cuts are conducted close to cities, lakefronts, busy roads and recreational areas (Figure 2).
Spatial-Quantitative Variation
The structural characteristics of natural forests usually exhibit considerable multivariate variation. Depending on the character of the forest inventory procedure, trees may be measured for diameter, height, crown height, age, growth rate, quality parameter, etc. Whereas information about the contents of each stand used to be presented by simple mean values, the trend today is to depict the stand using various distributions of the most important tree characteristics or comprehensive lists of surrogate trees representing the heterogeneity of the forest. This type of list describes the multivariate variation characteristic of the stand.
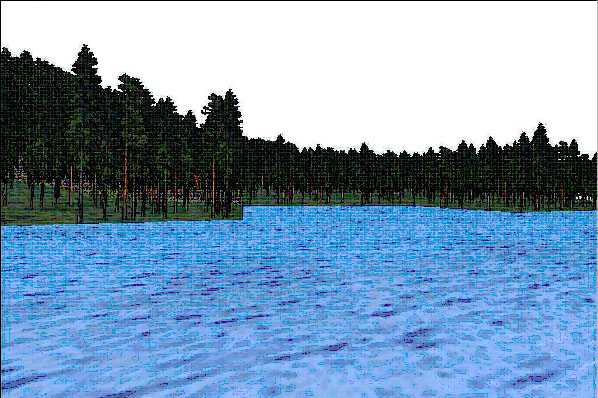
Figure 2. Advanced forest visualization tools enable the user to perceive forest management alternatives especially in valuable areas such as lakefronts.
In addition to variation in a stand, the forest has marked between-stand variation with spatial character. Much recent attention has been paid to managing the forest at both stand and landscape level. The forest landscape may possess rich diversity of wood lots, roads, agriculture land, water, buildings, etc., which all have to be taken into consideration when making management decisions. Wood procurement managers more often seek out desirable species mixes and dimension and quality characteristics within the forest at the landscape level because of the rapid fluctuations in demand for different lumber sizes and reduced storage availability at the mill. Moreover, maintenance of biological diversity requires that forest structures such as clear-cut areas, young stands, middle-aged stands, old-growth stands, pure stands, mixed forest be provided within each forest holding under active management.
The major benefit of displaying large-scale forest data via a virtual-world interface is being able to display numerous channels of data and hence to perceive and interpret interrelationships among those data items simultaneously. The location of data items in space is clearly of vital interest to ecologists and other scientists. It is also the kind of relationship which is best suited to visual display within a multi-dimensional virtual space.
A virtual forest displays spatial as well as quantitative and ownership information simultaneously. Visualization is perhaps the only effective means of presenting spatial organization. The virtual forest enables the decision-maker to synthesize this complex information rapidly in an easily understood format. Critical tree characteristics or site properties can be represented visually by color-codes, shapes or sizes which help the decision-maker to perceive distributions and spatial relationships (Figure 3). Even deeper engagement with the data might be achieved by interacting with the visual display. The user should be able to query the data according to any user-defined classification. It should be possible to query each object within the virtual forest and change its value. Databases can be linked to any advanced forest management tool providing users with the ability to contrast the results of proposed activities with monetary benefits or changes in the wildlife population.
Multiple Objectives
Forested land provides not only timber, but also a host of other values such as recreation, aesthetics, wildlife and ecological biodiversity. Although society is not ready to give up the benefits of commercial forest exploitation, people are now more concerned about the intensity, location and timing of logging actions as well as associated ecological and other consequences. As a result of the growing interest in non-monetary amenities, recent research has been focused on the incorporation of scenic beauty [3], recreational amenity and wild life habitat [8] models as well as various biodiversity indices. Furthermore, new forest planning methods have been developed to integrate several amenity values into forest planning [21]. These multiple forest management objectives enable the manager to find numerical ways of computing various amenity values and determine the right decision by optimization of the utility function.
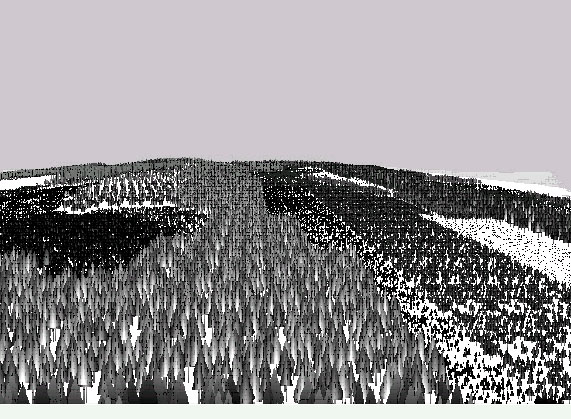
Figure 3. Trees colored by diameter enables the viewer to envision diameter distribution of trees within the forest area of interest instantly.
As the forest science community provides more specific knowledge about the ecological consequences of harvesting activities, forest visualization provides an efficient tool to communicate these characteristics to non-experts and engage them in decision-making processes [18].
OBSTACLES TO VIRTUAL FOREST-BASED FOREST MANAGEMENT
While visualization clearly offers benefits to the forest scientist and manager, issues arise in the development of visualization systems that place limitations on the usefulness of the tools or provide unanticipated bonuses in solving other problems. Moving towards virtual forest-based planning appears to facilitate tree-by-tree management since each visualized tree may be regarded as an object. From a user's point of view this sounds promising, but it raises obstacles in practice. Forest inventory data are in most cases assembled at the relatively abstract level of mean volumes, mean diameters and mean ages. Formation of a diameter distribution of sufficient accuracy may cause overwhelming difficulties. The current trend toward tree-level spatial analysis requires that the exact location of each tree and its principal variables such as dbh and height be defined as far as possible. With present technology and cost, this type of data may be collected only for special purposes such as analysis of special wildlife habitats, heritage landscapes or city parks. Development of remote sensing techniques, and their more intense utilization in forest inventory in the future, will probably enable tree-by-tree management on a large scale.
While present-day forest management may be based on accurately delineated stand boundaries, managers are continually forced to re-delineate those boundaries to re-group wood species for selling or to achieve scenic goals. Recent concentration on the environmental implications of forest management practices is increasing the need for such re-delineations since more attention being paid to leaving selected tree groups in or out of final management plans. Since the stand is a fundamental spatial element of a visualization application, any re-delineation of stand boundaries requires corresponding updating of the stand data structure. Since visualization applications have so far been largely developed as extensions of GIS applications, it may be that data update features may become part of a GIS application that then converts files to the formats needed by the application.
To be able to construct a valid depiction of real world conditions would require that "surrogate trees" disaggregated from the database accurately represent real trees. In applications using geometric modeling techniques, this requires advanced algorithms such as those used by Kitagawa [10], and considerable computer time. With the present limitations of computer techniques, this means that we must compromise over the requirements of interactivity and freedom of navigation. One solution to balancing high fidelity with a high level of interactivity has been to create separate modes of management. In SmartForest [14][23][27][28] users can "walk" in a forest where trees are presented only by simplified computer-generated tree icons but can render the forest trees with realistic tree textures in any user-defined spot. Other commonly used means of enhancing interaction speed are to reduce the "horizon" in the image or to reduce pixel numbers according to the distance from the point of view. Texture-mapping digitized photographic tree-images onto the geometric base image can also create a realistic-looking forest faster than geometric modeling. However, to generate realistic forest scenery a complete tree texture library of each tree species from small plants to the biggest trees, as well as different ground textures, needs to be created - a very time consuming task. Dozens of images need to be manipulated in order to get a sufficient library for a single tree.
Data acquisition from the target area is also a task that may cause an extra burden. As mentioned, most elevation data provided by national geological or geographical institutes for public use as DEM information is usually stored in geographically referenced geometric blocks that do not match an agency's management areas. To generate management files one might need to use special GIS software (e.g. ESRI's ArcInfo) to link several blocks together. One might also be forced to use GIS software to convert stand polygons or elevation data to another coordinate system. Since one of the characteristics of visualization is that data become very spatially explicit, it would be advantageous to acquire large databases containing spatial information for stand polygons and a detailed tree list for each stand. However, in most countries, privacy laws and data security prohibits compiling this type of information without the owner's permission. This can be a considerable obstacle when a single management area contains multiple private and public ownerships, especially in countries such as Finland, where ownership is dominated by numerous small-scale private forest owners.
Virtual forest management requires linkage of different types of data from various sources. External data such as GIS data (stand polygons and tree lists), DEM, cartographic data (roads, lakes and rivers, electric lines, houses, etc.) and inventory or growth simulator data are combined with the application's internal data sources such as texture databases, user defined classifications, color-codes, and other groupings. When constructing a virtual forest application for practical operations for daily use, special attention needs to be paid to ease of updating and smooth linkages between various databases and programs. Otherwise, there is a danger that any advantage gained through the use of virtual reality will be negated by an overwhelming maintenance burden.
FUTURE PERSPECTIVES IN FOREST VISUALIZATION
Forest management agencies, private forest owners and the forest industry are under increasing pressure to apply wise management practices. It is in the interest of the general public to ensure that environmental standards are being met. However, the forest industry is also managing a resource of increasing monetary value, so that stock-holders and customers are anxious that the both the greatest efficiency and environmental protection be achieved in bringing the harvest to market. At all points in this chain, there are individuals with vastly different training and different interests in the land who are attempting to agree on suitable policies.
There is now more interest than ever in understanding the dynamics of these complex biological, physical, and economic relationships. While computer modeling is capable of bringing powerful simulation tools to bear on these problems, the resulting information is increasingly shared and evaluated as a visual image either in a report or on a computer display.
Visualization projects typically tackle two complex tasks — systematically representing a range of issues in forest management practices, and communicating these issues to an audience of non-specialists. Of the range of visualization tools available, the critical differences and advantages will lie in interactivity and enabling the user to understand the relationship between underlying data relationships and forest planning on the landscape scale — the ground-level view and the synoptic overview. Until now, visualization has been an added feature, not an essential part of the application. Too often it has been regarded as decorative rather than substantive.
Newly-developed tools clearly have attributes that fall within the definitions of virtual veality devices. As suggested in this paper, VR offers promising new opportunities to aid the evaluation of forest resources as well as alternative management plans.
The successful integration of visualization with the other technological tools used in forest planning has shown considerable promise. GIS systems are increasingly open and it is possible to construct direct linkages between GIS databases and most visualization systems. While the linkages are imperfect at this time, it is also evident that solutions to these questions are already under development and attainable.
Despite the recent acceleration of graphic performance capabilities of personal computers, there is no reason to suppose that `virtual' forest management will rapidly replace existing forest management procedures. One of the biggest obstacles in applying visualization in practice is the lack of appropriate information as well as the labor intensity of combining information from different sources and formats. Local forest management plans are still based on databases comprising the mean values of various tree characteristics. Full utilization of the attributes of a virtual forest would require reliable information on diameter, height and quality distribution of each species. Since it is evident that there will be increasing pressure in the future to utilize various forest visualization applications, we will be forced to improve existing forest inventory procedures in order to benefit from the power of these tools.
ACKNOWLEDGEMENTS
Ross Pywell, Jeanine Paschke of the US Forest Service FHTET; Veli-Pekka Kivinen of the University of Helsinki; Abhijeet Chavan, Paul Radja, Kittipong Mungnirun, Kenneth Schalk, Kaiyu Pan and Kun Liu of the Imaging Systems Laboratory, University of Illinois.
AUTHOR CONTACT
Dr. Uusitalo can be contacted by e-mail at --
jori.uusitalo@joensuu.fi
REFERENCES
[1] Bergen, R.D., Ulricht, C.A., Fridley, J.L. and Ganter, M.A. 1995. The validity of computer-generated graphic images of forest landscape. J. Env. Psych. 15(2):135-146.
[2] Bishop, I.D. and Flaherty, E. 1990, Using video imagery as texture maps for model driven visual simulation. In Proc. Resource Technology 90, Washington, D.C. American Society for Photo- grammetry and Remote Sensing, Bethesda, Maryland, pp. 58-67.
[3] Brown, T. and Daniel, T.C. 1986. Predicting scenic beauty of timber stands. For. Sci. 32(2): 471-487.
[4] Bryson, S. 1995. Approaches to the successful design and implementation of VR applications. In R. A. Earnshaw, J. A. Vince and H. Jones (Editors), Virtual Reality Applications. Academic Press Inc., San Diego, pp. 3-15.
[5] Daniel, T.C. and Meitner, M.J. 1997. Predicting human response to future environments through data visualizations. In Proc. 1997 ACSM/ASPRS Annual Convention and Exhibition. Seattle, Washington. American Society for Photo-grammetry and Remote Sensing, Bethesda, Maryland. Technical papers volume 4, pp. 276-287. ISBN 1-57083-047-9.
[6] Heasley, J. and McNamara, J. 1990. Simulating the visual effects of timber harvest practices. In Proc. Resource Technology 90 - Second Symposium on Advanced Technology in Natural Resource Management. Washington, D.C., American Society for Photogrammetry and Remote Sensing, Bethesda, Maryland, pp. 39-47.
[7] Hutchins, E.L., Hollan, J.D. and Norman, D.A. 1986. Direct manipulation interfaces. In: Norman, D.A, Draper, S.W. (Eds.), User centred system design. Laurence Erlbaum, Hilsdale, NJ, pp. 87-124.
[8] Kangas, J., Karsikko, J. Laasonen, L. and Pukkala, T. 1993. A method for estimating the suitability function of wildlife habitat for forest planning on the basis of expertise. Silva Fenn. 27(4):259-268.
[9] Kellomäki, S. and Pukkala, T. 1989. Forest landscape: A method of amenity evaluation based on computer simulation. Landscape Urban Plann., 18:117-125.
[10] Kitagawa De Leon, M. and House, D.H. 1994. Rendering the Midway face forest, towards high realism in environmental visualization. In Proc. Decision Support-2001, Resource Technology 94, Toronto. American Society for Photogrammetry and Remote Sensing, Bethesda, Maryland, pp.231-232. ISBN 1-57083-022-3.
[11] Krüeger, W., Bohn, C.-A., Fröhlich, B., Schüth, H., Strauss, W. and Wesche, G. 1995. The Responsive Workbench: A Virtual Work Environment. IEEE Computer Graphics. July, 1995, 42-48.
[12] McGaughey, 1997. Visualizing forest stand dynamics using the stand visualization system. In Proc. ACSM/ASPRS/RT Annual Convention, Seattle, Washington. American Society for Photo-grammetry and Remote Sensing, Bethesda, Maryland, Technical papers volume 4, pp. 248-257. ISBN 1-57083-047-9.
[13] Orland, B. 1988. Video-imaging: a powerful tool for visualization and analysis. Landscape Arch. 76(1): 58-63.
[14] Orland, B. 1994a. Visualization techniques for incorporation in forest planning geographic information systems. Landscape Urban Plann. 30 (1994): 83-97.
[15] Orland, B., 1994b. Smartforest: 3-D interactive forest visualization and analysis. In Proc. Decision Support-2001, Resource Technology 94, Toronto. American Society for Photogrammetry and Remote Sensing, Bethesda, Maryland, pp.181-190. ISBN 1-57083-022-3.
[16] Orland, B., Daniel, T.C., Lynch, A.M. and Holsten, E. H. 1992. Data-driven Visual Simulation of alternative Future for Forested Landscapes. In proc. IUFRO—Integrating Forest Information over Space and Time. Canberra, pp. 368-378.
[17] Orland, B., LaFontaine, J. and Daniel, T.C. 1990. Alternative Futures for Forested Landscapes. In Proc. Resource Technology 90, Washington D.C. American Society for Photogrammetry and Remote Sensing, Bethesda, Maryland pp. 48-57.
[18] Orland, B., Ogleby, C., Bishop, I. Campbell, H. and Yates, P. 1997. Multi-media approaches to visualization of ecosystem dynamics. In: Proc. 1997 ACSM/ASPRS Annual Convention and Exhibition. Seattle, Washington. American Society for Photogrammetry and Remote Sensing, Bethesda, Maryland. Technical papers volume 4. pp. 224-235. ISBN 1-57083-047-9.
[19] Perttunen, J., Sievänen, R., Nikinmaa, E., Salminen, H., Saarenmaa, H. and Väkevä, J., 1996. LIGNUM: A tree model based on simple structural units. Annals of Botany 77:87-98.
[20] Polish, M.F., Gifford, S.J. and Jr., D.M.M. 1995. Automating the construction of large scale virtual worlds. IEEE Computer 7: 57-65.
[21] Pukkala, T., Nuutinen, T. and Kangas, J., 1995. Integrating scenic and recreational amenities into numerical forest planning. Landscape Urban Plann. 32 (1995): 185-195.
[22] de Ryffe, P., Fourcaud, T., Blaise, F., Barthélémy, D. and Houllier, F. 1997. A functional model of tree growth and tree architecture. Silva Fenn. 31(3): 297-311.
[23] Satava, R.M. 1995. Virtual reality for the physician of the 21st century. In R. A. Earnshaw, J. A. Vince and H. Jones (Eds), Virtual Reality Applications. Academic Press Inc., San Diego, pp. 19-26.
[24] Siitonen, M., Härkönen, K., Hirvelä, H., Jämsä, J., Kilpeläinen, H., Salminen, O. and Teuri, M. 1996. MELA Handbook - 1996 Edition. The Finnish Forest Research Institute. Research Papers 622. 452 p.
[25] Thuresson, T., Näsholm, B., Holm, S. and Hagner, O. 1996. Using digital image projections to visualize forest landscape changes due to management activities and forest growth. Environmental. Management. 20(1): 35-40.
[26] Uusitalo, J., Orland, B. and Liu, K. 1997a. Developing a forest manager interface to SmartForest. In: Proc. GIS '97, Vancouver. GIS World, Inc. Arlington Heids, Il, pp. 231-235. ISBN 1-882610-33-4.
[27] Uusitalo, J., Orland, B. and Liu, K. 1997b. A forest visualization interface for harvest planning. In Proc. ACSM/ASPRS/RT Annual Convention. Seattle, April 7-10, 1997. pp. 204-215. ISBN 1-57083-047-9.
[28] Uusitalo, J. and Kivinen, V.-P. 2000. Implementing SmartForest forest visualization tool on PC environment. In Proc. of Resource Technology '98 Nordic, International symposium on advanced technology in environmental and natural resources, Salminen, H., et al. [eds.]. The Finnish Forest Resource Institute, Research papers 791. 651 pp. ISBN 951-40-1758-7 (cd-rom).
[29] Wann, J. and Mon-Williams, M., 1996. What does virtual reality NEED?: human factors issues in the design of three-dimensional computer environments. Int. J. Human-Computer Studies. 44, 829-847.
[30] Wykoff, W., Crookston, N., Stage, A. 1982. User's quide to the stand prognosis model. Gen. Tech. Rep. INT-133. Ogden, UT. USDA Forest Service, Intermountain Forest and Range Experiment Station. 112 p.