Vol. 12 No. 2 July 2001
N.M. Holden1
A.A. Martin1,2
P.M.O. Owende1
S.M. Ward1
1University College Dublin
Ireland.
2Dublin Institute of Technology
Ireland.
The authors are, respectively, College Lecturer, Graduate Student/Lecturer, Senior Researcher Fellow and Associate Professor.
ABSTRACT
This paper describes the development of a quantitative method of classifying forest canopy that can be related to degradation in Differential GPS (DGPS) performance. Using digital images taken vertically skywards at 20 sites within a forest on the east coast of Ireland, canopy cover was described using percentage sky obstruction (Op), largest hole (DTmax), and the fragmentation of sky view (DTp) using pixel count and distance transform data. Statistical methods were used to produce three clusters which related to canopy cover in stands of Picea sitkensis and Picea contorta. DGPS data were then collected on 10 separate dates at the 20 sites, every two seconds for five minutes, and the two-dimensional standard deviation of the position fix was used to represent DGPS precision. The standard deviations ranged from 0.5 m to 9.7 m (compared to the manufacturer's specification of approximately 1 m in the horizontal). Precision was found to be related to the total obstruction, the size of the largest hole in the canopy, and the fragmentation of the sky view. Where there was little obstruction (<20%) or fragmentation, the DGPS performance was effectively the same as outside the forest, open canopy caused a 2-3 fold degradation in precision, and closed canopy a 5-7 fold degradation. It is suggested that the methods presented could be used to rapidly relate DGPS performance to forest canopy, and therefore may be useful in pre-planning inventory mapping and future machine operations using guidance systems.
Keywords: DGPS, distance transform, canopy closure, Ireland, Picea sitkensis, Pinus contorta.
INTRODUCTION
The classification of even-aged commercial forest stands is generally based on size categories (seedling, pre-thicket, thicket, pole, saw timber), height classes and density or crown closure [15]. There are two common canopy closure class systems: A: dense: >70%, thin or medium: 40 - 70%, poor: <40%, or B: class 1: 0-25%, class 2: 26-50%, class 3: 51-75%, class 4: 76-100%. Individual trees can be classified by crown class: dominant, co-dominant, intermediate or suppressed. The meaning of canopy closure (the proportion of the sky hemisphere obscured when viewed from a single point) and canopy cover (the proportion of the forest floor covered by the vertical projection of the tree crowns) are distinctly different [6]. Various techniques exist for the measurement or estimation of both canopy properties [6, 18]. Canopy closure is most completely measured by hemispherical photography [13] which can also be used to estimate gap fraction and leaf area index (LAI) by quantified image analysis [17]. Other alternatives are the "moosehorn" [1] and the densiometer [7]. Canopy cover can be measured by midday sunlight area on the ground [15], radiation at the ground [10], or simple estimation by ocular judgement [6] is also possible.
The use of the global positioning system (GPS) in the management of forest resources has been considered since shortly after the system became available in the mid 1980s [19]. There has been a range of work that has: (i) tested different receivers [e.g. 4], (ii) evaluated the role of tree components in obstructing satellite signals [5] and (iii) investigated the effect of topographic position and tree type on GPS performance [2]. Hemispherical photography has been used to study the effects of canopy on GPS signals [11][5], but little effort has been focused on producing a quantitative description of the forest canopy that could be related to GPS performance. For example, sites used for GPS hardware evaluation have been described as "easy", "difficult" and "very difficult" [4], or by semi-quantitative crown closure classes (1 - 4 representing quartiles of the distribution)[3]. Stem density and further "openings" within the stand have also been used [12]. The relationship between canopy closure and GPS accuracy has been found to be exponential with small changes in canopy causing large reductions in accuracy [14]. Ocular estimation of canopy closure is open to operator error and cannot readily convey information about the pattern of the canopy cover and closure. Densiometers can provide little information about the pattern of canopy closure which may also be related to DGPS performance. Hemispherical photography includes excessive information from low angles that are masked out by the GPS unit and also requires specialised software for correct analysis. A measure of position accuracy and precision are needed for machine guidance and semi-automated harvesting systems as part of error management control systems. While GPS can estimate precision in real-time, for optimum management and pre-planning, a method of predicting DGPS performance degradation due to canopy was considered to be worth investigating. It was concluded that a fast and cost-effective system of quantitatively describing a forest canopy would be useful for predicting potential degradation in performance of DGPS. The aim of this work was to produce a quantitative method of classifying forest canopy that was (i) cost-effective, (ii) required little by way of specialist equipment, (iii) reproducible, and (iv) could be related to degradation of DGPS performance for possible prediction purposes.
MATERIALS AND METHODS
The classification presented in this paper is based on a quantification of canopy cover and pattern using the vertical, skyward view from the ground with a restricted field of view, limited by the focal length of a standard digital camera. Quantitative image analysis was used to determine percentage obstruction, radius of largest hole in the canopy and to estimate the fragmentation of the obstruction (i.e. whether the sky view was via few large areas - holes in the canopy - or a series of small interconnected area - gaps between leaves on inter-linked branches) which could be related to DGPS performance.
Classification of the forest canopy relating to GPS performance
Images of the forest canopy were obtained using a digital camera (Kodak 260 Zoom, settings: 38 mm focal length, 768 x 512 pixel resolution, fixed infinity focus which gave a 1160 angle of view from the lens which is equivalent to a 320 horizon mask for the GPS) mounted on a tripod 1 m above the ground. The camera was horizontally levelled and the lens pointed vertically skywards. The low elevation was used in order to include small tree growth in the field of view, which represented the greatest degree of blockage of sky view by tree growth possible at the sites. Ten images were captured at random locations beneath the canopy at each site, and were downloaded to a computer for analysis. These images were assumed to constitute a representative elementary area (REA) which means that as a sample of the forest canopy they encompassed all the available variability that could be detected. A sufficient area of canopy had to be sampled in the images to ensure that orientation and location effects had no influence on the resulting descriptor values reported after analysis.
The image analysis comprised of two procedures which derived three canopy descriptors:
Quantification of percentage obstruction (Op, %). Each image was converted to greyscale, and a threshold applied that made the obstructions in view black (i.e. tree growth) and the sky area white. The percentage black pixels, which equated to the percentage obstruction in the field of view (ca. 580 either side of the vertical) was determined by software (Semper™, ver 6+ for Windows, Synoptics Ltd, UK).
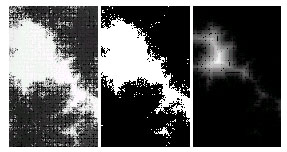
Quantification of obstruction pattern (maximum canopy hole radius: DTmax, pixels; fragmentation of sky view: DTp, dimensionless). The threshold image (comprising white pixels and black pixels) was processed to determine the distance transformation using a Euclidean approximation [16]. The transform action examines each white pixel (representing sky), and determines its approximate Euclidean distance (in pixel units) from the nearest black pixel (representing trees). The white pixel is then transformed to the integer number closest to the calculated distance (up to a maximum value of 255)(i.e. the value of the pixel is equal to its distance from the nearest black pixel). In a distance transform image, the brightest areas are the furthest distance from black pixels. In Figure 1 the greyscale image of the sky (left) seen through the forest canopy is converted to a threshold black and white image (middle) which is then distance transformed (right). The brightest area represents sky furthest from the trees. The maximum value in the transformed image (DTmax) is measured in pixels and is an indication of the radius of the largest hole in the canopy. Note that due to the perspective effects in the image, the pixel cannot be calibrated to a normal unit of distance.
Figure 1. An example of a sky shot through a canopy, the threshold image and the distance transform image.
In order to describe the pattern of sky visible in the image it is possible to examine the cumulative area distribution for the transformed image (i.e. proportion of sky area by distance from a tree). The cumulative area distribution is derived from the distance transform image histogram (i.e. the frequency of pixel values in the distance transformed image) which, due to the distance transformation is also the distribution of sky distance from the nearest tree. A pixel can be a measure of both area and length, therefore the distance distribution, if expressed cumulatively becomes the cumulative area distribution. The cumulative area distribution can be approximated by a sigmoidal curve of the form:
 (1)
(1)
where R is the proportion of sky area up to distance (d, pixels) from a tree feature, k (pixels) is the value of d at half the maximum value of R and DTp is a measure of the rate of convergence to the maximum value of R. DTp is related to the fragmentation of the sky view. Large values indicate distinct, large holes in the canopy (e.g. where a tree has been removed by thinning), while small values indicate many small fragmented views of the sky (e.g. the view through a 10-20 year old Sitka spruce Picea sitkensis canopy prior to thinning). In images with very little (Op < 20%) or no (Op = 0%) tree area in view the value of DTp was set to equal 2 because the distance transform algorithm does not work in such cases.
Using these three measures, it was possible to quantify and classify the magnitude and pattern of canopy obstruction at each site. In order to establish the similarity between sites, the three descriptors of canopy cover were statistically clustered using Euclidean distance and centroid linkage to establish groupings based on a dendrogram. A one-way ANOVA was used to test for significance of differences between clusters.
GPS data acquisition
A Trimble PRO XRS differential global positioning system (DGPS) receiver was used with a marine beacon differential correction service (Point Lynas, UK) to evaluate performance of DGPS under the forest canopy at the selected sites. This unit was chosen because it is a 12-channel receiver and it permitted the setting of both a positional dilution of precision (PDOP) threshold and a signal to noise (S/N) ratio to user requirement. The receiver was initialised using manufacturer default values of 8.0 for PDOP and 6.0 for S/N filters, but the PDOP threshold was increased to 99 after preliminary trials in order to permit data acquisition under a wider range of canopies.
The marine beacon differential correction service was used because it is transmitted in the medium wave band and is therefore not a "line-of-sight" radio transmission. This means that landform and some obstructions have less impact than for FM transmissions, making it ideal for use in forests on the hilly terrain of the east coast of Ireland. For the duration of the sampling period, the service provided differential correction signals at all sites at all times.
Field sampling
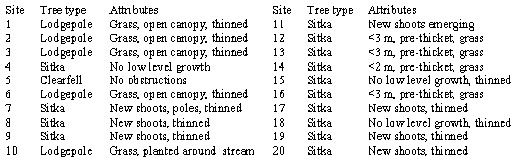
The GPS trials were performed in Roundwood state forest, Co. Wicklow, Ireland (centred on ING: 317240E, 207800N) and correspond to forest sites adjacent to those used in previous road studies [8]. Ten images were taken in 20 different stands (Table 1) at random locations, always further than 10 m from the edge of the stand, and the mean values of OP, DTp, and DTmax for the site were calculated. The role of perspective within the method was considered to be relatively unimportant. A small obstruction close to the camera lens would have the same influence on the quantified descriptors as a very large branch area a greater distance away, and would be expected to have a similar influence on GPS signal. At each site, the DGPS receiver collected data every two seconds for five minutes, and the two-dimensional standard deviation of the position fix (as a measure of precision) was compared with the canopy classification variables (percentage cover and pattern of obstruction) to quantify the influence of the forest stands on DGPS performance. DGPS data reported are the average of sampling on 10 days between May and August, 1999. Site visits were at different times of the day and in various orders to ensure a wide range of satellite geometries during the data acquisition period. The data collected were acquired before the removal of Selective Availability (SA). This should have little influence on the results presented because the use of differential correction removed most of the effects of SA, and all data used were differentially corrected.
Table 1. Site attributes noted for the 20 stands used for DGPS performance trials.
RESULTS AND DISCUSSION
Classification of forest canopy
The use of a 38 mm lens, instead of a "fish-eye" lens is justified because: (i) GPS is mostly used with an elevation mask of at least 150 (but newer algorithms mean values of 10-130 are now possible), and it has been established that an elevation mask greater than 300 will significantly degrade GPS performance [1, 5]. Given that within the forest there is a mask imposed of at least that order from all sides by the trees, only the satellites at high elevations will be used by the GPS receiver. The overhead area is therefore the part of the canopy that is of most importance; (ii) the density of tree spacing is reflected to a certain extent in the crown closure. Where there had been thinning there were distinct holes in the crown, thus the crown immediately overhead also reflected the relative blockage to the sides. This means that the sky shots also conveyed indirect information about the stem density of the stand. Where stem density is higher, the horizon masking effect will be greater. The quantified canopy data (Table 2) indicated that there was a range of canopy densities ranging from little or no obstruction (sites 5, 12, 13, 14 and 16) to high obstruction (sites 4, 7, 8, 9, 11, 15, 18, 19 and 20). Low obstruction was associated with a clearfelled site, and those that had just been replanted.
Table 2. Forest canopy descriptors for each site.
| Site | Op (%) | DTmax | DTp |
| 1 | 36 | 243 | 1.67 |
| 2 | 49 | 228 | 1.32 |
| 3 | 50 | 231 | 1.44 |
| 4 | 77 | 105 | 0.99 |
| 5 | 0 | 923 | 2 |
| 6 | 38 | 285 | 1.43 |
| 7 | 79 | 96 | 1.01 |
| 8 | 81 | 67 | 0.93 |
| 9 | 73 | 129 | 0.97 |
| 10 | 37 | 283 | 0.94 |
| 11 | 83 | 52 | 0.96 |
| 12 | 16 | 923 | 2 |
| 13 | 1 | 923 | 2 |
| 14 | 0 | 923 | 2 |
| 15 | 73 | 97 | 0.92 |
| 16 | 1 | 923 | 2 |
| 17 | 69 | 209 | 1.24 |
| 18 | 78 | 86 | 0.99 |
| 19 | 78 | 136 | 1.05 |
| 20 | 74 | 138 | 1.01 |
Using the quantified canopy data from 20 stands and statistical clustering, the resulting dendrogram revealed three significant groupings (Figure 2). Cluster 1 (centroid values in brackets) was characterised by a large DTmax (923), a low Op (4 %) and a non-measurable DTp (2). Cluster 2 had moderate Op (47 %), a large DTmax (246), and a DTp that suggested the presence of some large holes in the canopy (1.34). Cluster 3 had high Op (77%), a small DTmax (101), and a DTp value suggesting a fragmented sky view (0.98). The within cluster similarity was ca. 90%. On examining the sample sites that contributed to the three clusters, it was found that cluster 1 comprised the clearfelled and replanted pre-thicket sites, cluster 2 was all the Lodgepole Pine sites, and site 17 which was thinned sitka spruce, and cluster 3 was all sitka spruce. A one-way ANOVA indicated significant differences between all the sites for all canopy descriptors, and when grouped by cluster, there were significant differences between the groupings (in all cases, for Op, DTmax, DTp, p < 0.001). There was a distinct trend with obstruction whereby as percentage obstruction increased, the size of the holes in the canopy decreased while their numbers increased.
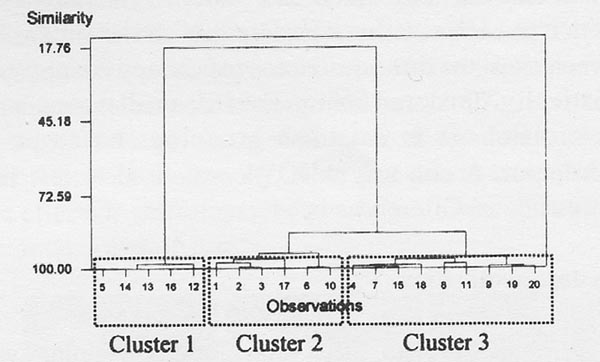
Figure 2. Dendrogram of clustering based on 0p, DTmax and DTp.
GPS Performance
The GPS position fix data (Table 3) were obtained with fixed receiver settings. The standard deviation of the position fix for each site was compared with the three stand descriptors. It was found that in each case there was a significant relationship between precision of fix and the stand characteristics, but these were not linear (Figure 3). The relationships can be summarised as (i) an increased percentage obstruction resulted in poorer precision; (ii) an increased maximum hole radius resulted in better precision and (iii) a reduction in sky view fragmentation resulted in better precision. These results can probably be explained by a combination of: (i) the trees causing direct blockage of the satellite signals resulting is less than ideal geometry, (ii) the canopy causing multipath effects and (iii) the canopy adversely influencing the signal to noise ratio. These influences over time were integrated by the precision value calculated for each site The canopy classification method can therefore be quantitatively linked to the performance of GPS due to signal attenuation.
Table 3. Mean two-dimensional standard deviation of DGPS position fix for the 20 test sites as measured on 10 occations for each site between May and August 1999. Clusters represent the groupings from the similarity dendrogram.
| Site | SD(m) | Cluster | Site | SD(m) | Cluster |
| 1 | 0.57 | 2 | 11 | 3.71 | 3 |
| 2 | 1.92 | 2 | 12 | 0.80 | 1 |
| 3 | 2.24 | 2 | 13 | 0.53 | 1 |
| 4 | 3.69 | 3 | 14 | 0.38 | 1 |
| 5 | 0.24 | 1 | 15 | 1.88 | 3 |
| 6 | 1.27 | 2 | 16 | 0.57 | 1 |
| 7 | 2.74 | 3 | 17 | 1.89 | 2 |
| 8 | 7.13 | 3 | 18 | 3.31 | 3 |
| 9 | 3.82 | 3 | 19 | 2.72 | 3 |
| 10 | 1.98 | 2 | 20 | 9.40 | 3 |
Towards prediction of GPS precision based on quantified canopy characterisation
Given the relationships between the canopy descriptors and the GPS precision recorded at the sites, a series of equations to predict DGPS precision (p, metres) based on the three variables were calculated:
p = 0.4185e0.02830p (R2 = 0.81) (2)
p = 202.19DTmax-0.8827 (R2 = 0.74) (3)
p = 3.3981DTp-2.7922 (R2 = 0.78) (4)
The manufacturer's specification for the Trimble ProXRS DGPS receiver used in this study indicated that it should have a sub-metre horizontal precision, which equates to a standard deviation of about 1.5 m in three dimensions. Using representative values for the 3 canopy classes to predict DGPS precision (Table 4) cluster 1 (little or no obstruction) had no measurable influence, cluster 2 (open canopy) cause a 2 -3 fold degradation of precision and cluster 3 (closed canopy) caused a 5-7 fold degradation of precision.
Table 4. Prediction of DGPS precision (standard deviation, metres) from quantified canopy descriptors for each cluster
| Cluster | From Op | From DTmax | From DTp |
| 1 | 0.5 | 0.5 | 0.5 |
| 2 | 0.7 | 1.6 | 1.5 |
| 3 | 3.7 | 3.4 | 3.6 |
Using the method presented it is possible to asses forest canopy impact on DGPS performance at particular locations. This information would be useful for both planning and recording machine operations as part of improved mechanisation systems, and will be a necessary part of future error management protocols.
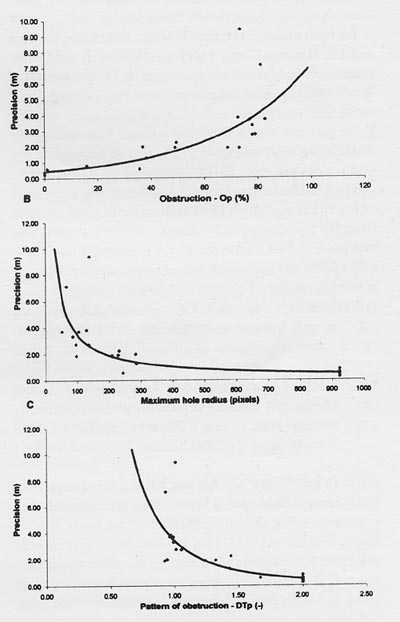
Figure 3. Plots of precision (expressed as standard deviation) of position fix vs. (a) Op. (b) DTmax, and (c) DTp.
CONCLUSIONS
The quantified descriptions of stand characteristics allowed a quantified link between forest cover and DGPS signal attenuation to be developed, and thus a means of predicting the relative performance of DGPS in any stand. In general, as the total GPS signal from 4 or more satellites is attenuated, the standard deviation of the position fix will increase. This attenuation can be linked to the total obstruction and to the pattern of obstruction caused by the forest canopy. For many purposes, DGPS can be used successfully in forests as the reduction in precision is constrained to <10 m. The methodology should be applicable to any forest canopy, and can be used for the future planning of GPS related machine management.
ACKNOWLEDGEMENTS
We wish to thank The Irish Forestry Board (Coilte Teo.) and The National Council for Forest Research and Development (Coford) for their assistance. P. M. O. Owende is the Coford Newman Scholar in Forest Engineering.
AUTHOR CONTACT
Dr. Holden can be reached by e-mail at --
Nick.Holden@ucd.ie
REFERENCES
[1] Bonnor, G. M. 1967. Estimation of ground canopy density from ground measurements. J. For. 65:544-547.
[2] Deckert, C. and Bolstad, P. V. 1996. Forest canopy, terrain and distance effects on global positioning system point accuracy. Photogrammetic Eng. and Remote Sensing 62:317-321.
[3] D'Eon, S. P. 1995. Accuracy and signal reception of a hand-held global positioning system (GPS) receiver. For. Chron. 71:192-196.
[4] Forgues, I. 1998. GPS testing in eastern division of FERIC. GPS in forestry, Western Workshop. Kelowna, British Columbia. 16 - 18th November, 1998.
[5] Gerlach, F. L. 1989. Global positioning system canopy effects study. USDA Forest Service Technology and Development Program. MTDC 89-34. 18 pp.
[6] Jennings, S. B., Brown, N. D. and Sheil, D. 1999. Assessing forest canopies and understory illumination: canopy closure, canopy cover and other meaures. Forestry 72:59-73.
[7] Lemmon, P. E. 1957. A new instrument for measuring forest canopy overstory density. J. For. 55:667-638.
[8] Martin, A. A., Holden, N. M., Owende, P. M. and Ward, S. M. 2001. The effects of peripheral canopy on DGPS performance on forest roads. Int. J. For. Eng. 12(1):71-79.
[9] Norman, J. L. and Campbell, G. S. 1989. Canopy structure. In: Pearcy, R. W., Ehleringer, J. R., Mooney, H. A. and Rundel, P. W. (eds.) Plant physiological ecology. Field methods and instrumentation. Chapman Hall, London. pp 301-325.
[10] Pierce, L. I. and Running, S. W. 1988. Rapid estimation of coniferous forest Leaf Area Index using a portable integrated radiometer. Ecology 69: 1762-1767.
[11] Peterson, C. 1990. Into the woods with GPS. GPS World 1:31-36.
[12] Reutebuch, S., Johnson, L. and Reed, P. W. 1998. Tracking forest vehicle movements under varying canopy densities. GPS in forestry, Western Workshop. Kelowna, British Columbia. 16 - 18th November, 1998
[13] Rich, P. M. 1990. Characterising plant canopies with hemispherical photographs. Remote Sensing Review 5:13-29.
[14] Sigrist, P., P. Coppin and M. Hermy. 1999. Impact of forest canopy on quality and accuracy of GPS measurements. Int. J. Remote Sensing 20:3595-3610.
[15] Stoddard, C. H. 1987. Essentials of forestry practice. 4th Edition Wiley, New York. pp 407.
[16] Synoptics. 1994. Semper 6 Command Reference, Part 1. Manual number: SEM005, update 1. Synoptics Ltd. UK.
[17] van Gardingen, P. R., Jackson, G. E., Hernandez-Dumas, S., Russel, G., and Sharp, L.1999. Leaf Area Index estimates obtained for clumped canopies using hemispherical photography. Ag. and For. Meteo. 94:243-257.
[18] Warren Wilson, J. 1963. Estimation of foliage denseness and foliage angle by inclined point quadrats. Australian J.Bot. 11:95-105.
[19] Wilkie, D. S. 1989. Performance of a backpack GPS in a tropical rain forest. Photogrammetic Eng. and Remote Sensing 55:44-48.