 (1)
(1)Vol. 12 No. 2 July 2001
Antti Asikainen
Finnish Forest Research Institute
Finland
ABSTRACT
Logging on islands differs considerably from logging carried out on the mainland. The transportation of machines to the islands and between islands calls for special equipment. Furthermore, the long distance transport must be done simultaneously with logging, because the buffer raft between ground forwarding and vessel transport is very small and used also for the transport of logging machines and crews between islands. There are several options to arrange long distance waterway transport by using boats and various kinds of barges. In this study different vessel transport systems carrying wood from islands were studied by using discrete-event simulation. A new push barge system suitable for transport of wood from islands was compared to the current powered barge system. A three barges' setting system gave the lowest harvesting costs when the transport distance exceeded 100 km. At shorter transport distances the current system was most competitive. Direct loading of barges by forwarders was cheaper than the use of a separater loader. Direct loading, however, requires new driving ramps and is not applicable everywhere.
Keywords: wood harvesting, island, waterway transport, simulation, Finland, barges, Pinus, Picea, single-grip harvester, shortwood, forwarders, cut-to-length .
INTRODUCTION
Water transportation represents 5 % of the long distance transportation in Finland. About two thirds (1 627 000 m3) of this is transported by floating and about one third (681 000 m3) by vessels of various types [10]. The long distance transport of wood from islands has been done either by trucks or floating. Trucking can not be utilized every year, because the winters are not always cold enough for ice road construction. In summer, floating can be utilized, but the collection of small bundles around the lake can be relatively expensive. During recent years, powered vessel transport of wood from island forests has been growing rapidly on lake Saimaa, which is the largest lake in Finland. In 1991 the volume of wood transported by vessels was 160 000 m3 and in 1997, 836 000 m3 [7, 12]. This results from rapid transport speed and also the quality of wood can be better maintained in vessel transport rather than floating.
The vessels used for direct transportation must be able to float in shallow water; their draught is 2-2.5 meters. A typical harvesting system used on islands consists of a single-grip harvester, a forwarder, a raft and a vessel (powered barge). The raft is used for the transport of machines between islands and it acts as a buffer between logging and vessel transport.
Small barge systems operating outside marked passages have not been studied previously in Finland. With large barges able to carry 3000 m3 of timber, truck transport, loading and unloading of barges was found to be the bottleneck of the transport system [8]. Setting up the feeding transport and finding enough timber from a reasonable area for large barges was found to be difficult. Truck transport prior to shipment can be expensive because of long transport distances [8]. In this study, the capacity of the logging system limited the operation of barges to short transport distances.
Currently timber is transported by powered barges, the volume of which varies from 200 to 500 m3. These barges have not been originally designed for wood transport from islands. Loading of wood is done by hydraulic crane mounted on the barge deck. Loading is done either from the buffer raft or directly from the piles on the bank. There are often difficulties in finding a suitable bank for loading due to a requirement for adequate draught. In addition, storing wood on the bank often causes soil and landscape damage. Therefore, the buffer raft is favoured. While the barge is on its way to the mill, a forwarder continues to drive timber to the raft. The barge is unloaded at the mill either by its own grapple loader or by a separate unloader truck. Machine waiting times are very common in the system - either the boat or the logging machines wait. The supervisors responsible for wood harvesting on the islands suggested that new loading systems should be developed. For instance, longer ramps should be designed in order to enable the direct loading of a vessel by a forwarder. Furthermore, the use of interchangeable barge systems could be one solution to diminish the interactions between logging and waterway transport.
Logging and vessel transport form a harvesting system in which machine interactions play a significant role. The forwarder forwards the timber to the raft, which acts as a buffer between logging and boat transport. The volume of the raft is 100- 250 m3. The barge is loaded with timber from the raft and transports it to the mill. As the pockets of the raft are full, the forwarder must discontinue working or unload the timber back onto the ground and transfer them later to the raft. The vessel waits, if there is no timber to load on the raft. Waiting for other machines generates extra costs. In addition, random elements such as machine failures and transportation distance affect the performance of the whole system [1]. Because of these interactions, waiting of machines is typical in the operation.
The aim of this study was to test how interchangeable barges fit into the harvesting system and also compare direct loading by forwarder, current loading done by the hydraulic crane mounted on the barge deck and loading done by a separate loader excavator. Five barging scenarios were modelled. Finally, the cost competitiveness of different systems was estimated at various transport distances. The applicability of discrete event simulation in the modelling of waterway transport of wood was investigated.
MATERIAL AND METHODS
Three simulation models were constructed for the purpose of comparing alternatives. The models emulate logging and barge transport of wood from islands to the mill. The models begin in the stands to be cut and end at the unloading of vessels at the mill. The following systems were modelled:
1. Cutting - forwarding onto the buffer raft - loading by barge's loader - barge transport by powered barge (current system).
2. Cutting - forwarding and unloading onto the barge
by forwarder - transport of barge to the mill (new
system under planning).
2a) one barge with the pusher.
2b) one barge with the pusher, one barge at the
island for loading.
2c) one barge with the pusher, one barge at the
island for loading, one barge at the mill for unloading.
3. Cutting - forwarding and unloading onto the raft
by forwarder - loading by a separate loader to the
barge - transport of barge to the mill; three barges as
in system 2c (new system under planning).
In all systems cutting was done with a single grip harvester and forwarding with a forwarder. In all systems there was a buffer raft between forwarding and vessel transport. The buffer raft had capacity of 250 m3. In systems 1 and 3 it was used as a buffer and in systems 2a, 2b and 2c it was used as a loading ramp. The barges were unloaded at the mill with their own unloading device in the situations 1, 2a and 2b. If the barge was left at the mill for unloading (situations 2c and 3) it was unloaded by a separate loader truck, which causes extra unloading costs of $0.44 USD/m3.
Logging site data consisted of 15 islands on which 75 pine dominated stands were harvested. This data were collected during the summers 1995 and 1996 from islands that were harvested by Enso Gutzeit Ltd.. The average size of a stand was 1 ha with standard deviation of 0.6 ha and the size of the stand was lognormally distributed. and the density of harvested timber was 220 m3/ha. Mean stem volume was 0.525 m3, standard deviation was 0.124 and stem volume was lognormally distributed. Forwarding distance was normally distributed with mean of 240 m and standard deviation 48 m. The number of stands marked for cutting was 5 on an island. The logging method applied was regeneration cutting. Aforementioned random number distributions were used for describing the harvesting conditions on each island and these distributions were used as an input for the simulation model. Distance between islands was normally distributed with a mean of 11 km and standard deviation 2.2 km.
The productivities of a harvester and forwarder were estimated using productivity functions [6]. Activity times for the boats and moving of machines were collected by the entrepreneur during the summer 1996. For the new barge system, activity times were estimated by the system designer and also previous experiences of barge transport were utilized. Activity times were calculated deterministically using functions. Variation in the model was caused by random delays and randomly changing conditions (logging site characteristics and transport distances).
Single grip harvester
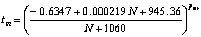
Moving time from tree to tree was calculated by Equation 1.
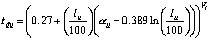
(1)
where:
tm = moving time from tree to tree, min/stem
N = removal, stems/hectare
pter = terrain parameter:
p (easy terrain) = 1.0
p (moderate terrain) = 0.765
The time required to process a tree was estimated by Equation 2.
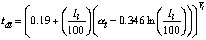
 (2)
(2)
where:
tp = processing time, min/stem
Vm = volume of stem, 1 (dm3)
an coefficients:
| pine | spruce | |
| α1 | 0.52967 | 0.44472 |
| α2 | 0.00089 | 0.00094 |
| α3 | -205.89 | -146.17 |
| α4 | -719.45 | -862.05 |
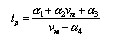
Forwarder
The loading time for timber was calculated by Equation 3.
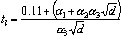 (3)
(3)
where:
t1 = loading time, min/m3
d = volume of timber, m3/100m trail
α = coefficients:
| sawlogs | long pulpwood | |
| α1 | 0.1504 | 0.1596 |
| α2 | 0.616 | 0.894 |
| α3 | 0.33599 | 0.26415 |
The driving time for loading was calculated by Equation 4.
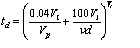 (4)
(4)
where:
td = diving time for loading, min/m3
Vl = size of load, m3
Vp = size of a loading position (stack), m3
d = volume of timber, m3/100 m trail
v = driving speed, m/min:
v (easy terrain) = 29
v (moderate terrain) = 24
The time consumed by driving loaded and unloaded was calculated using Equations 5 and 6. The durations of these activities were randomly varied, because the driving distance varies within a logging site. A theoretical logging site corresponding to conditions on islands was sketched on paper, and the driving distances and times for each load were estimated. As a result, the driving time seemed to vary according to a normal distribution, and the standard deviation was about 20% of the average value.
 (5)
(5)
 (6)
(6)
where:
tdu = time of driving unloaded, min/m3
tdl = time of driving loaded, min/m3
lu = distance of driving unloaded, m
ll = distance of driving loaded, m
Vl = size of load, m3
coefficients αl and
αu:
| α1 | α2 | |
| easy terrain | 2.37 | 2.01 |
| moderate terrain | 2.88 | 2.34 |
The unloading time for a forwarder was calculated by Equation 7.
 (7)
(7)
where:
tu = time required for unloading, min/m3
Vl = size of load, m3
tu = 0.57 min/m3(sawlogs), 0.56 min/m3 (long pulpwood)
Barges
For the old powered barge the loading and unloading times were estimated based on logbook data on loads transported in 1996 by Silvamarin Ltd. The loading time for sawlogs was 0.76 min.m-3, and for pulpwood 1.12 min.m-3, and unloading time for sawlogs was 0.60 min.m-3 and for pulpwood 1.04 min.m-3. The driving speeds were 10 km/h loaded and 15 km/h unloaded. The activity times for barge were constant over a simulation run. Changes in transport distances and delays caused variation between the runs. The capacity of the old barge was 450 m3.
The new barge system consists of a tug boat (pusher) and barge. The capacity of each barge was 650 m3 and the number of barges and their usage can be varied. An empty barge is left at the bank of an island for loading and when full is transported to the mill. The speed for new barges pushed by a tug boat were given according to technical plans produced by the planning engineers. They were 14 km/h loaded and 17 km/h unloaded. The indirect loading time was 0.5 h. If the loading was done by forwarders, the direct loading time was defined by the productivity of cutting and forwarding. The loading speed for a separate loader was 0.46 min.m-3.
Simulation models have been succesfully applied in the modelling of harvesting systems with interactions [11, 5,1, 2]. Also ferry traffic and port operations have been modelled with simulation techniques [9, 4]. A simulation model can take the effects of interactions into account and the costs of waiting can be estimated in monetary terms. Furthermore, it has been discovered that manufacturing simulators can be used for the modelling of wood harvesting [1]. Wood harvesting resembles manufacturing in many ways, and only the geographic scale of operations is different. Therefore, discrete-event simulation was used for the modelling and analysis of the harvesting system. A Witness manufacturing simulator was used in the model construction.
Randomly occurring delays have an important influence on machine performance. In this study machine failures and delays caused by the operator were handled as a whole. To describe the delay pattern of a machines time between delays and delay time were estimated for each machine. Delays (<15 min and >15 min) form 31.6% of the sum of the harvester's work-site and moving time and 14.5% of the forwarder's work-site and moving time [6]. The proportion of short (<15 min) delays was 43% of all delays for a harvester and 47% for a forwarder [6]. The duration of a delay or service time can be either exponentially or Erlang distributed [14]. Because of simpler estimation, delay time was assumed to be distributed exponentially . The mean delay was 26.7 min for a harvester and 23.7 min for a forwarder. The time between machine failures can be expressed by an exponential distribution for complex (forest)machines [13, 14]. The time between delays was also assumed to be exponentially distributed. Because the total proportion of delays was known, the mean time between delays was 57.8 min for a harvester and 139.7 min for a forwarder.
The delays for powered barge and tug boat were estimated based on logbook data based on similar distribution assumptions as by forest machines. The average time between delays was 330 min, that the mean delay lasts 36 min and that both are distributed exponentially. The delay patterns of machines are summarized in Table 1.
Table 1. Delay patterns of machines.
mean time between delays |
mean length of the delay |
|
| machine |
min |
min |
| harvester | 57.8 | 26.7 |
| forwarder | 139.7 | 23.7 |
| boats |
330.0 |
36.0 |
The following hourly costs were used: harvester US$57, forwarder US$40, powered barge US$39, tug boat (pusher) US$47, barge US$7, separate loader US$78. Waiting costs were as follows: harvester US$44, forwarder US$31, separate loader US$64. For the tug boat and powered barge the above mentioned hourly costs were applied, because waiting is included when loading and cannot be distinguished from the loading phase.
Transport distance varied from 50 to 200 km. Each situation was repeated seven times with the same input parameters; only the random number streams were changed. The length of each replication was 600 hours which corresponds to one month operation in three shifts.
RESULTS AND DISCUSSION
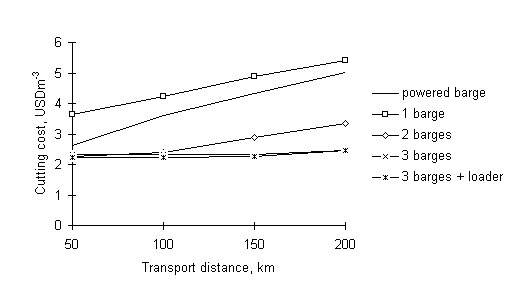
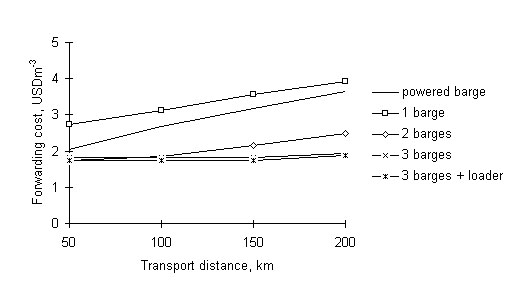
Cutting and forwarding costs were almost constant up to a transport distance of 200 km, if the long distance transport was done by three barge systems (Figures 1 and 2). This results from the fact that barge systems can transport wood fast enough and the buffer (empty barge at the island) is sufficient. The current powered-barge system reduces the productivity of logging because the buffer raft becomes full as the boat is transporting the load to the mill. The one barge system yields the highest logging costs because a forwarder can not unload unless the boat is at the island.

Display large image of Figure 1
Figure 1. Cutting costs of a single-grip harvester.

Display large image of Figure 2
Figure 2. Forwarding costs.
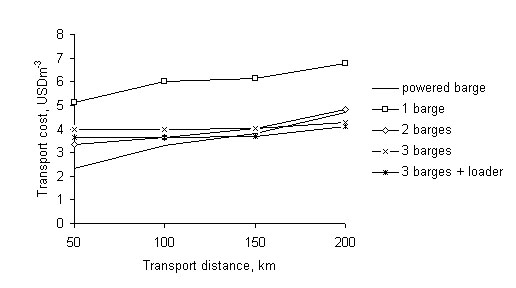
Transport costs are shown in Figure 3. At transport distances shorter than 130 km, powered barge transport was the cheapest alternative. More effective barge systems can not utilize their capacity, because logging restricts their operation. Thus, they have to wait for the logging operation. At longer distances, as the system becomes better balanced, three barge systems become most competitive.

Display large image of Figure 3
Figure 3. Barge transport costs.
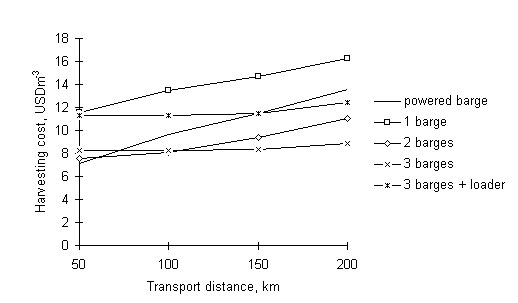
Total costs of logging, loading and long distance transport are shown in Figure 4. At short transport distances a smaller boat was sufficient, whereas at longer distances the three barge system gave the lowest harvesting costs. Difference between the three barge systems results from the costs of a separate loader excavator.

Display large image of Figure 4
Figure 4. Total costs of harvesting.
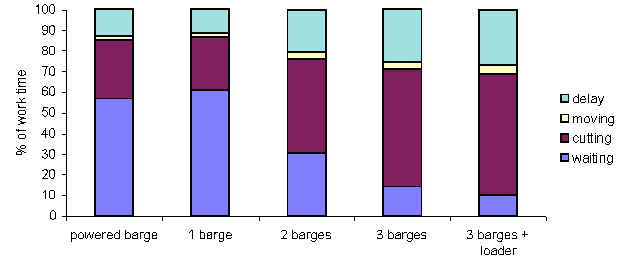
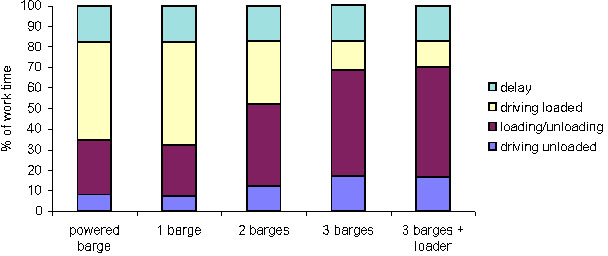
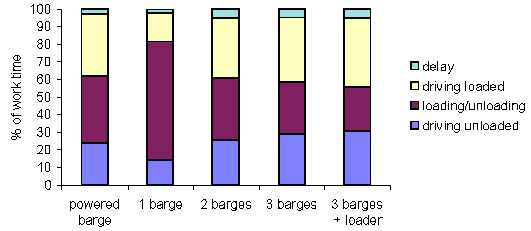
Figures 5, 6 and 7 show the work time distributions of harvester, forwarder and the tug boat (pusher) at a transportation distance of 150 km, which is the average transport distance in Saimaa region. A harvester must spend a large part of its work time waiting if a powered barge or one barge is used for long distance transport (Fig. 5). In the case of the forwarder the waiting time is included when driving loaded; forwarder waits loaded at the bank of the island because the buffer is full and/or there is no barge at the island (Fig 6). As more effective 2 or 3 barge systems are used for long distance transport, the forwarder and harvester can work more effectively. With the powered barge and 1 barge system a major part of the work time was used for loading and unloading (Fig. 7). With the one barge system, loading takes most of the work time, because a forwarder can only unload when the barge is at the island. This means, that barge loading productivity is the same as the productivity of the forwarder. If more barges are used, the loading time diminishes, because the tug boat only changes from the empty to full barge at the island. In 2 and 3 barge systems the forwarder keeps on loading the barge as the pusher and a barge are on their way to the mill. In the three barge system loading/unloading time is shortest, because tug boat can leave the full barge for unloading at the mill and yet continue to the island with an empty barge.

Display large image of Figure 5
Figure 5. Work-time distribution of a harvester, transport distance 150 km.

Display large image of Figure 6
Figure 6. Work-time distribution of a forwarder, transport distance 150 km.

Display large image of Figure 7
Figure 7. Work-time distribution of the powered barge/tug bpat.
CONCLUSION
In this study new barge-transport systems were modelled and analysed. An industrial manufacturing simulator was used for the model construction and experimentation. This tool was well suited in the modelling of barge transport. The model construction is often described as laborious [3, 9]. Here previous models for logging and trucking simulation were modified, which decreased the need for programming. One of the advantages of simulation in system modeling is the ability to quantify the machine interactions (queuing, waiting). These play a significant role also in waterway transport [9, 8, 4]. In this study the effect of interactions in a new barge systems was quantified in monetary terms. If they had not been considered, the current system would have misleadingly been estimated to be the most competitive one also at long transport distances.
The new barge concept for wood transport from islands was first designed according to the ideas of the entrepreneur. In this study its applicability was tested by a simulation model before further decisions to build the barges. It was found that a barge system consisting of a pusher boat and three barges is the most competitive waterway transport method when the logging is done by a harvester and a forwarder. If a harvesting system is working in lake Saimaa region, where the average transport distance is around 150 km, it seems reasonable to start utilizing barge systems. The loading should be done by a forwarder directly onto the barge. At the next stage, technical planning of a loading ramp suitable for several types of banks should be considered.
In the simulations only one logging system was working on the island. If there were two systems, the utilization of a three barge system would be reasonable at shorter transport distances. On the other hand, moving of forest machines would take more time. The islands are relatively small, with an average logging area of about five hectares. Therefore it is not feasible to bring two systems onto an island.
AUTHOR CONTACT
Dr. Asikainen can be reached by e-mail at --
antti.asikainen@metla.fi
REFERENCES
[1] Asikainen, A. 1995. Discrete-event simulation of mechanized wood-harvesting systems. University of Joensuu, Faculty of Forestry, Research Notes 28. 86 pp.
[2] Asikainen, A. 1998. Chipping terminal logistics. Scan. J. For. Res. V13(3):386-391.
[3] Banks, J. and Carson, J.S. 1984. Discrete-event system simulation. Prentice-Hall Inc. Englewood Cliffs, New Jersey. 514 pp.
[4] Darzentas, J. and Spyrou, T. 1996. Ferry traffic in the Aegean Islands: a simulation study. Journal of the Operational Research Society 47:203-216.
[5] Johnson, L.R. 1985. Simulation analysis of timber harvesting operations. FORS/FPRS 1985 Computer Symposium. pp 159-167.
[6] Kuitto, P.-J. 1994. Mechanized cutting and forest haulage. Metsäteho Report 410. 38 pp.
[7] Laajalahti, T. and Säteri, L. 1992. (Volumes and Costs of Wood Harvesting and Transport of Finnish Forest Industries in 1991.) Metsäteollisuuden raakapuun korjuun ja kaukokuljetuksen puumäärät ja kustannukset vuonna 1991. Metsäteho. 5 pp.
[8] Oijala, T., Terävä, J. and Tohu, J. 1993. Transportation of timber on barges. Metsäteho Review 10/1993. 8 pp.
[9] Ojala, L. 1992. Modelling approaches in port planning and analysis. Publications of the Turku School of Economics and Business Administration. Series A-4:1992. 119 pp.
[10] Statistical Yearbook of Forestry. 1995. The Finnish Forest Research Institute. 354 pp.
[11] Stuart, W. 1980. A simulation approach to the analysis of harvesting machines and systems. Virginia Polytechnic Institute and State University, Blacksburg, Virginia. 201 pp.
[12] Säteri, L. and Örn, J. 1997. Timber harvesting and long-distance timber transportation costs in 1997. Metsäteho Review 1/1998. 4 pp.
[13] Sundberg, U. and Silversides, C.R. 1988. Operational efficiency in forestry. Vol. 1: Analysis. Kluwer Academic Publishers, Dordrecht. 219 pp.
[14] Thesen, A. and Travis, L.E. 1992. Simulation for decision making. West Publishing Company. St. Paul. Minnesota. 384 pp.