 (1)
(1)
Vol. 12 No. 2 July 2001
Jukka Malinen
Matti Maltamo
University of Joensuu
Finland
Pertti Harstela
The Finnish Forest Research Institute
Finland
The authors are Forest Technology Researcher, Professor of Forest Mensuration, Faculty of Forestry, and Professor, Suonenjoki Research Station, respectively.
ABSTRACT
The purpose of this study was to develop and test the application of non-parametric Most Similar Neighbor Inference (MSN) for wood procurement planning. An application developed using this method would be a part of a stem database in Finnish forest enterprises and could predict characteristics of a marked stand with accuracy demanded by bucking simulation. A stem database includes representative samples of stands and stems, applications to control and update data and applications to utilize the database. The study materials used consist of two different kinds of data: data collected by harvesters and historical forest inventory data. The harvester collected stem data came from stands in central Finland, whereas forest inventory data was obtained from all over Finland. The accuracy of the MSN method was analyzed by estimating characteristics of tree stocks and by comparing simulated spruce, pine and birch log length-diameter distributions with the information from actual stands.
The application presented was found to be a useful and flexible tool for predicting characteristics of marked stands based on the stem data collected by a harvester. The forest inventory data was found less suitable for reference data. The most efficient way to create a length-diameter distribution was to calculate length-diameter class estimates from reference stands as weighted averages of the corresponding length-diameter class. The proposed method appears robust against measurement errors of search variables.
Keywords: non-parametric estimation, planning inventory, stand characteristics, stem database, wood procurement, Betula, Picea Abies, Pinus Sylvestris, forest inventory, Finland, harvester, log-length-diameter distribution.
INTRODUCTION
Customer oriented wood procurement requires more accurate information than what is present from characteristics of a marked stand (cutting area) for an evaluation of cutting possibilities in available stands [15]. When using cut-to-length methods, the decision to buck has to be made in the forest according to the price of and demand for timber assortments. Bucking optimization technology is already available in modern harvesters but until now production planning has been based on planner's experience.
This is followed by the marketing section selling the product beforehand on the marketplace. Optimal log distribution for an individual stand may not be the same as optimal log distribution for a forest enterprise [15]. Better and more accurate information on reserves of marked stands would result in more optimal allocation of cutting operations in stands. With the help of additional information, sawmills may reduce trimming losses, avoid unmarketable raw wood material and steer the flow of wood to the best secondary processing destinations [17].
When bucking to value and demand approach is used in optimization of harvester bucking, pre-logging information is crucial if a group of harvesters is to be controlled instead of single harvesters. Information on marked stands should contain log length-diameter distributions produced by a simulator with the entered bucking controlling parameters. Although forest management planning information on marked stands may be available in most cases it is not useful for bucking simulation [15]. Pre-measurements made while buying may be accurate enough, but these methods [9, 17] have turned out to be too expensive or not sufficiently reliable.
Tommola et al. [16] used a non-parametric k-nearest-neighbor regression to estimate characteristics of marked stands from data which was measured by means of log-measurement instruments installed at various sawmills. The results were encouraging, although estimates could be achieved only for previously used log length-diameter distribution constraints. For a situation where values or demand change, the method is not appropriate.
In other forest applications, non-parametric methods have been used mainly for forest inventory purposes. In Finland, for example, these methods have been used when estimating basal-area diameter distribution [3, 12], in generalizing sample-tree information [7] and with multisource forest inventory [6].
Non-parametric methods such as the k-nearest-neighbor regression and the most similar neighbor inference have proved to be very flexible and easy to use. The k-nearest- neighbor regression predicts the value of a variable of interest as the weighted average of the values of neighbor observations, the neighbors being defined with the predicting variables [e.g. 4, 1]. Moeur and Stage [13] used a method called Most Similar Neighbor Inference (MSN) in association with multivariate forest inventory. They used canonical correlation analysis to derive a similarity function for neighbor selection. According to Moeur and Stage [13], the advantages of the MSN inference are that it retains a full range of variation of the data as well as the covariant structure of the population. In their study, however, the number of neighbors was set to 1 in order to avoid averaging the variables and the distance function was formed from a canonical correlation.
The accuracy of the nearest neighbor method [3] and MSN-analysis [13] were found to be similar to the compared parametric methods. Maltamo and Kangas [12] compared parametric and non-parametric methods and found methods based on the k-nn regression to give more accurate description of the diameter distribution than the parametric methods. In addition, impossible predictions, such as seen with the case of parameter estimators, cannot occur because the most identical neighbors are chosen from among actual samples. However, these methods require extensive data from the application area and therefore cannot be utilized in situations where previously collected data is not available.
While harvesting stands with modern harvesters, a huge amount of data from stems in marked stands can be collected without considerable additional cost or work. A harvester collects diameter from stem for every 10 centimeters and saves this detailed data as a specific file. Since the wood procurement managers are visiting the stands daily that they are supposed to buy, they can easily assess the mean stand variables. These variables can be connected to a previously collected stem database information without any additional workload. By predicting tree stock from the stem database according to collected stand variables it would be possible to receive accurate information on standing tree stocks without remarkable costs. Within this approach it could also be useful to utilize previously collected forest inventory data, at least in situations where appropriate harvester collected stem data is not available. This principle corresponds with studies by Haara et al. [3] and Maltamo and Kangas [12].
The purpose of the present study was to introduce and test the non-parametric k-nearest-neighbor MSN method used with the harvester collected stem data and the forest inventory data. The purpose of prediction was to form tree stock estimates accurate enough for bucking simulations. Different amounts of information when forming stand characteristics from selected most identical stands were also tested.
MATERIAL AND METHODS
Materials
The study material consists of two different kinds of data: harvester collected stem data and forest inventory data measured in the 1980s. The basic concept of the stem database is to use harvester collected stem data where available, whereas the forest inventory data is tested in order to be used as complementary data for situations were harvester collected data is not available.
Harvester collected stem data was measured and stored by Finnish forest enterprises in order to be used as the stem database prototype (Table 1). Stem measurements were collected from harvesters' measurement units. Due to different practices in enterprises, the data also includes information which was not usable as actual study material. The suitable study data consist of 224 stands located in central Finland, 58 of which were dominated by Scots pine and 166 by Norway spruce.
Table 1. Description of the mean stand characteristics in harvester collected stem data according to the tree species present in the stand.
| | Scots pine | Norway spruce | Birch |
| Number of stands containing tree species | 217 | 215 | 204 |
| Basal area (m2·ha-1) | 4,9 | 13,8 | 1,2 |
| Basal area median diameter (cm) | 28,7 | 25,8 | 19,5 |
| Stand height (m) | 22,4 | 20,9 | 19,0 |
| Stand age (yrs) | 94 | 93 | 93 |
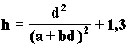
Forest inventory data was initially gathered from various locations around Finland for practical purposes for Finnish forest enterprises. It consists of 15434 work units, which are used as the basic units in this study and called from now on as stands (Table 2). Of this total, 7710 stands were dominated by Scots pine (Pinus sylvestris L.) and 7219 by Norway spruce (Picea abies Karst.). The remaining 497 stands were dominated by two birch species (Betula pendula Roth., Betula pubencens Ehrh.) and 8 stands were dominated by other broadleaves, such as, alder (Alnus incana Moench, Willd.) and aspen (Populus tremula L.). Diameter at breast height was recorded in 2 cm classes by tree species from all the trees included in stands. Height estimates were measured from sample trees describing the height-diameter relationship. These measurements were used to generalize height for other trees using the Näslund height curve [14] which was estimated separately for each stand.
(1)
where:
h = height (m)
d = diameter at breast height,
a, b = parameters
Table 2. Description of the mean stand characteristics in forest inventory data according to the tree species present in the stand.
| Scots pine | Norway spruce | Birch |
|
| Number of stands containing tree species | 14138 | 13384 | 12849 |
| Basal area (m2·ha-1) | 6,8 | 8,5 | 2,3 |
| Basal area median diameter | 25,4 | 20,1 | 18,2 |
| Stand height | 18,4 | 16,2 | 16,4 |
| Stand age | 109 | 106 | 107 |
Stand variables of these materials were calculated as means and sums of standwise measurements. Other variables such as forest site, location and stand development class were registered when these stands were originally measured.
K-Nearest-Neighbor MSN Method
In the harvester collected stem data a target stand is a stand which is excluded from reference stands and for which estimates are calculated. Each stand from reference data is in turn used as the target stand. The forest inventory data was divided in two equal-sized groups of data according to geographical distribution to ensure that both groups of data include evenly placed observations. One half of the data was used as reference data and the other half was used as test material.
In this study the estimation method is based on distance-weighted nearest neighbor estimation, where k-most-identical stands are used for predicting the characteristics of the target stand. The distance measures of similarity are needed to compare different stands and their characteristics. Measure of distance can be formed from the stand variables and is calculated for each stand in turn.
Before the k-nearest-neighbor method can be applied, it is necessary to decide:
1. the form of distance function to be used to find
the most similar reference stands,
2. the number of nearest neighbors to be used, and
3. the form of weight function for weighting the
reference stands.
In this study the similarity of stands is measured according to the Most Similar Neighbor Inference [13]. Similarity function used in MSN method is generalized Mahalanobis distance [11]. A canonical correlation analysis provides a unified multivariate approach to the computation of the weighting matrix in the distance function, by summarizing the relationship between a set of search attributes and a set of design attributes simultaneously. The MSN similarity measure derived from the canonical correlation analysis is:
 (2)
(2)
where:
D = distance between observations
Xu = vector of known search variables from target
observation,
Xj = vector of search variables from reference
observation,
G = matrix of canonical coefficients of indicator
variables,
L = diagonal matrix of squared canonical correla- tio
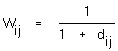
In the MSN similarity function (equation 2), W (equation 3) weights the elements of search variables according to their predictive power for all elements of design variables simultaneously, while incorporating the covariance between the elements of design attributes.
 (3)
(3)
where:
W = weight of search element
The nearest neighbor MSN method can be summarized as follows:
1. Obtain search variables: complete coverage of
search variables on all parcels.
2. Determine design variables. Concentrating on the
relationship of search and design variables allows
the MSN analysis to be tailored to a particular set of
interesting characteristics.
3. Estimate the canonical coefficients and
correlation from search and design variables for the MSN
distance function.
4. Select the number of nearest neighbors to be used.
5. Perform the k-nearest-neighbor MSN analysis,
selecting the most identical neighbors from the
reference data to assign to each search parcel "u"
minimizing the squared distance function.
6. Form estimates from selected most
identical neighbors using weighed averages.
In this study, the search variables were chosen from among commonly measured stand characteristics (Table 3). With design attributes it is possible to tailor the MSN analysis to meet the objectives of each case. In this study, design attributes used were obtained diameters in percentage points of 0% (the smallest diameter), 20%, 40%, 60%, 80% and 100% (the largest diameter) of accumulated basal area, a and b of Näslund's height parameters [14] and volume of tree species. Using percentile points, the MSN analysis was tailored to predict size distribution, while Näslund's height parameters were used to give information on diameter-height ratio (see also [5]) and volume was used as a density variable. For the basal area calculation, the diameter of stems in the forest inventory data were assumed to be regularly distributed within diameter classes.
Table 3. Variables used in selection of the nearest neighbors.
| Harvester collected stem data | Forest Inventory data |
|
| Variables describing site: | Location | Location |
| Temperature sum | Stand area | |
| Stand area | Stand age | |
| Stand age | Forest site type | |
| Forest site type | Stand | |
| Main tree species | Development class | |
| Logging period | Logging method | |
| Logging method | ||
| Variables describing growing stock: | Mean diameter | Mean diameter |
| Mean height | Mean height | |
| Mean volume | Relative proportion of species | |
| Relative proportion of species | Basal area per hectare | |
| | Basal area per hectare | |
The optimal number of nearest neighbors depends on prediction objectives and data used. Increasing the number of neighbors leads to decreasing variation of the predicted values and therefore to more average results. Moeur and Stage [13] set number of neighbors to 1 to avoid averaging of the estimates. Small number of variables may be appropriate in situations where each stand is considered one by one, but if a group of stands is viewed more average results may be acceptable if better average goodness is achieved. Too small a number of neighbors may lead to very poor predictions if there is no reference stand similar to target stand. The variable used to measure a method's ability to predict variation of stands was Root Mean Square Error (RMSE). Distribution level was used to describe average goodness.
The weights for the reference stands were calculated inversely according to similarity distance. Thus, the nearest reference stands are weighted according to the similarity distance when target stand characteristics are formed. The Wij weight of reference stand i for target stand j, belonging to the nearest stand, was as in Equation 4.
 (4)
(4)
where:
Wij = weight of reference stand.
dij = distance between target stand and reference stand.
Forming of Stand Characteristics
The estimates of stand characteristics can be derived according to the distance between the similarity measures of the chosen reference stands and the target stand. Stand characteristics for the forest inventory data were formed from estimated diameter distribution and from length parameters. In the case of the harvester collected stem database, the characteristics of a target stand were formed according to the estimated diameter distribution by selecting actual stems from the stem database using selected neighbor stands (Figure 1). The estimated stem population was bucked with a bucking simulator to obtain estimates of log length-diameter distribution for the target stand. Log length-diameter distribution was also estimated from reference stand's corresponding characteristics by using weighted averages of each log length-diameter class. Estimated diameter distributions were scaled to the measured basal area of target stand, which were assumed to be known.
Bucking Simulation
Height for each stem was calculated with a standwise height-diameter ratio using Näslund's parameters [14]. Stem taper was described using taper curve functions [8]. For the harvester collected stem data taper curves were smoothened as taper curve parameters before saving on the stem database.
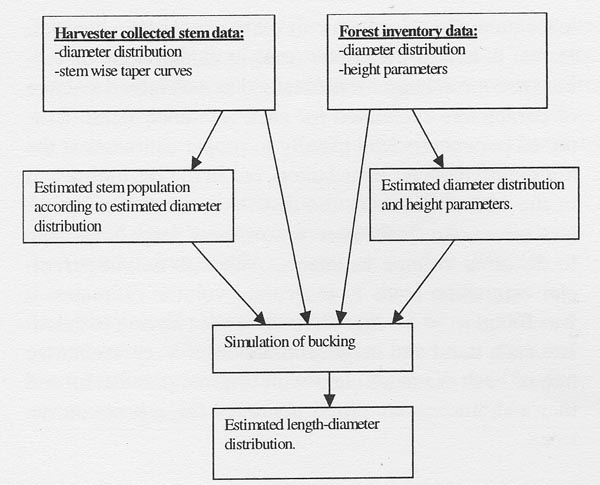
Figure 1. Possibilities of forming stand characteristics.
The stem was divided into 10-cm sections. For each section the thin-end diameter was obtained from the taper curve. Optimal bucking was performed by using dynamic programming [2] and bucking to value.
Comparison of Results
The RMSE is a widely used criteria to evaluate the estimations given by the k-nearest-neighbor model. In the present study, relative RMSE was used to evaluate the estimations of volume, sawtimber volume, sawtimber/pulpwood ratio and median tree height. The relative root mean squared error (RMSE %) was defined as in Equation 5.
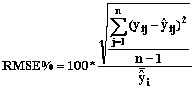 (5)
(5)
where:
RMSE % = relative root mean square error,
n = number of observations,
yij = the real value of the variable i in
stand j,
íij = the estimated value of the variable
i in stand j.
íi = the mean of estimates of variable i
The estimations of length-diameter class distribution achieved from bucking simulation were compared to length-diameter class distribution achieved from bucking simulation using real stand values. These two distributions were compared with a distribution level (see Equation 6).
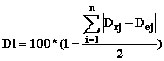 (6)
(6)
where:
Dl = distribution level,
Drj = length-diameter class distribution of actual
output in stand j,
Dej = length-diameter class distribution of estimated
output in stand j.
Distribution level is a simple and illustrative variable which has been used with comparisons of demand and actual output distributions [10]. Distribution level indicates the similarity of two distributions. Identical distributions get value 100 (%) and smaller the value is, the more different distributions are. It is also suitable for comparing predicted and actual output distributions.
The optimal number of neighbors used can be determined by using the cross validation method, thus by maximizing the distribution level or minimizing the RMSE of certain characteristics. Minimization of the RMSE estimates describe deviation better than maximizing distribution level, whereas distribution level is better for depicting average accuracy.
Sensitivity of prediction due to measurement errors of search variables was tested by calculating estimations in situations, where each stand variable was randomly inaccurate by 5%, 10%, 15% or 20 % from its original value. The importance and required number of different search variables were tested in situations where variables describing tree stock (proportion of tree species, basal area or mean variables) were not involved.
RESULTS
The optimal number of neighbors was defined by searching for the nearest neighbors with different amount of neighbors. The number of neighbors was 3-5 if minimizing the relative RMSE of tree stock variables (Figure 2) and approximately 10 if distribution level was maximized.
When predicting tree stock variables with harvester collected stem data the relative RMSE of estimates were relatively low (Table 4). While actual measurements from actual trees were used, impossible height/diameter combinations could not appear. Mean height was achieved by calculating height curve parameters and basal area median diameter from the estimated tree stock.
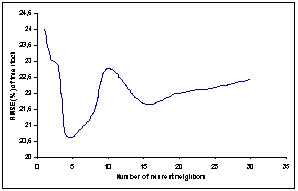
Figure 2. RMSE (%) of sawtimber ratio for spruce as a function of the number of the nearest neighbor in harvester collected stem data.
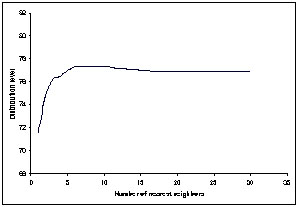
Figure 3. Distribution level for spruce as a function of the number of the nearest neighbor in the harvester collected stem data.
Table 4. Accuracy (RMSE %) of stand estimates for growing stock using the k-nearest-neighbor MSN method (k=5) with the forest inventory data and the harvester collected stem data.
| Harvester collected stem data | Forest inventory data |
|||||
| | Pine | Spruce | Birch | Pine | Spruce | Birch |
| Volume | 6,67 | 4,93 | 29,47 | 10,22 | 10,20 | 15,35 |
| Sawtimber ratio | 22,84 | 20,63 | 51,43 | 17,98 | 26,08 | 38,01 |
| Sawtimber sized stem | 26,16 | 28,37 | 46,44 | 29,50 | 42,20 | 60,74 |
| Mean height | 3,44 | 2,82 | 4,74 | 7,62 | 7,88 | 8,85 |
For the forest inventory data, the proportion of sawtimber and sawtimber sized stem (diameter at breast height >18 cm) estimates were less accurate in most cases (Table 4). Volume and mean height estimates were inaccurate due to an error in the height parameter estimates. A height parameter used in calculations of volume and mean height was obtained as a weighted average of parameters calculated for each reference stand. Estimated parameters lead usually to proper estimates at the middle of diameter distribution, but in the beginning and in the end of diameter the distribution estimates were less inaccurate. Inaccurate estimates of large trees lead to distorted volume estimates. Although height parameter estimation leads to inaccurate volume estimates, it was found to be a better alternative than having to calculate each stand and height estimation of a representative tree of each diameter class with original parameters and then calculating weighted averages for representative trees.
While need for information on forest stand characteristics is based on the need for estimation of length-diameter distribution with given price and demand list, we simulated bucking for pine and spruce for target stands and for estimated tree stocks (Table 5). Forest inventory data estimates included inaccurate height estimates, which were reflected in estimated bucking.
Due to the error caused by model chains, it proved better to estimate the log length-diameter distribution directly from simulated bucking of reference stands (Table 5). In the case of the forest inventory data this led to considerable improvements in the estimates. Correspondingly, distribution level for the harvester collected data was much better when compared to bucking made from estimated tree stock.
In order to find out method's robustness in contrast to inadequate number of search variables we analyzed the model with different search variables. Results varied considerably from the original model when the MSN method was applied without variables describing the growing stock (Table 6). On the other hand, results were almost as good as in the original model if only mean tree variables were used. Size distribution of stands correlated strongly with mean tree variables. It could be said that the mean tree variables indicate right place for size distribution while other variables indicated shape and deviation of distribution.
Table 5. Distribution levels for the forest inventory and harvester collected stem data with length-diameter class distribution generated from estimated tree stock by bucking simulation, as well as length-diameter class distribution generated by weighted averages from bucking simulations of reference stands.
| Forest inventory data | Harvester collected stem data |
|||
| | Pine | Spruce | Pine | Spruce |
| Length-diameter distribution levels
generated from estimated tree stock by bucking simulation | 70,20 | 75,63 | 73,36 | 81,78 |
| Length-diameter distribution levels
generated by weighted averages from bucking simulations of reference stands | 83,64 | 88,86 | 77,31 | 84,67 |
Table 6. Robustness against an inadequate number of search variables. (k=10).
| Distribution level | ||
| | Pine | Spruce |
| Original model Without variables describing | 77,31 | 84,67 |
| tree stock | 72,54 | 81,54 |
| Mean tree variables only | 76,96 | 84,24 |
The k-nearest-neighbor MSN method seems to be robust against measurement errors of search variables (Table 7). Distribution level decreased only 1,88 percent with pine and 3,37 percent with spruce from original values with a 20% measurement error. Slightly inexact values (5%) for search variables did not have any effect, on the contrary they may even produce better combinations of the nearest neighbors than the accurate values.
Table 7. Robustness against a measurement error (k=10).
| Distribution level | ||
| | Pine | Spruce |
| Real values | 77,31 | 84,67 |
| Deviation ±5 % | 77,52 | 84,59 |
| Deviation±10 % | 76,66 | 83,22 |
| Deviation±15 % | 75,17 | 82,36 |
| Deviation ±20 % | 75,43 | 81,30 |
DISCUSSION
In this study, the k-nearest-neighbor MSN method was used to predict the characteristics of marked stands. The method was tested with two kinds of data; harvester collected stem data, which will be primary reference data in the stem database application for Finnish forest enterprises, and forest inventory data, which was tested to complement data for situations where harvester collected data is not available. The most similar stands were found by using variables describing site and tree stock. Search variables were chosen to be easily collectable within the wood procurement manager's visit to the target stand.
The study shows that the method presented is a practical approach to predict stand characteristics with harvester collected stem data. The most efficient way to generate length-diameter distribution is to calculate length-diameter class estimates from reference stands as weighted averages of the corresponding length-diameter class. Actual outputs can be used when database includes enough data with same diameter and quality constraints. With new or less used constraints (e.g., log dimension restrictions) it would be suitable to use simulated bucking outputs.
With respect to diameter distribution prediction, the forest inventory data was comparable to the harvester collected stem data. However, height-diameter ratio estimates were inaccurate, which made estimates of tree stock unsatisfactory. Nevertheless, estimated length-diameter class distributions from simulated length-diameter class distributions were notably better than those derived using bucking simulation based on estimated tree stocks.
A basic requirement of information produced by this study was to be accurate enough to fulfill the needs of bucking simulation. However, due to difference in size and quality requirements used in bucking, distribution levels cannot with compared to other studies. The nearest neighbor method has shown to be a suitable method for estimating log length-diameter distribution from previously measured log length-diameter distributions [16] as well as for estimating basal area diameter distribution [3, 12]. In this study, we could produce different log length-diameter distributions from tree-wise data. The accuracy of estimates was comparable to a study by Tommola et al. [16] when comparing sawtimber/pulpwood ratio.
Systematic errors have been among the biggest problems associated with the planning inventory methods. The nearest-neighbor method does not include this kind of error. Reference data used by Tommola et al. [16] was strongly contingent in size and quality requirements and in control of bucking. With the use of bucking simulations, this kind of deficiency can be avoided.
In this study, basal area was used for scaling diameter distribution. Scaling improves volume estimates, but leads to overestimates, especially within the smallest diameter classes (see also [12]). This may be avoided by using density instead of basal area. However, basal area can be measured more accurately than stem number density and is more closely related to stand volume. By using information from previous logging operations, it may be possible to select neighbors more accurately from stands with similar history and diameter distribution.
The most important factor in the use of the MSN method is its flexibility in different situations and with different search variables. Due to canonical correlation- based weighting, the weighting matrix can be calculated without notable calculation time with different data or different combinations of search variable. While stem databases are updated with new data from harvested stands, the weighting matrix can be re-calculated after each update.
Non-parametric methods are, even when at their best, only as good as the data used. These methods only point out the most similar stands and if the data does not include similar stands, then the target stand estimates may be inaccurate. Nevertheless, if properties of reference data are uniform enough and used in estimations with common sense, small data sets may also be usable.
Within this study, the quality of tree stock was not predicted. With Norway spruce, quality characteristics (i.e. the amount of rotten wood) reduce timber volume. With Scotch pine the amount of different timber grades have a significant influence on bucking and value of a stand. Both quality measures could be estimated from the harvester collected stem database with the method presented by adding some search variables describing quality of the tree stock and collecting real quality based cutting points. Bucking simulation could then be done by utilizing these quality cutting points.
ACKNOWLEDGEMENT
This research was funded by the Academy of Finland, research project "Data basis of timber procurement enterprises and forest mensuration as a basis for operational planning". The authors would like to thank Mr Vesa Imponen and Mr Tapio Räsänen for their cooperation during research.
AUTHOR CONTACT
Mr. Malinen can be contacted by e-mail at --
Jukka.Malinen@joensuu.fi
REFERENCES
[1] Altman, N. S. 1992. An Introduction to Kernel and Nearest-Neighbor Non-parametric Regression. Am. Stat. 46: 175-185.
[2] Bellman, R. E. 1954. The Theory of Dynamic Programming. Bull. Am. Math. Soc. 60: 503-516.
[3] Haara, A., Maltamo, M. and Tokola, T. 1997. The K-Nearest-Neighbour Method for Estimating Basal-Area Diameter Distribution. Scand. J. For. Res. 12:200-208.
[4] Härdle, W. 1989. Applied Nonparametric Regression. Cambridge University, Cambridge, 323 pp. ISBN 0-521-38248-3
[5] Kilkki, P. and Siitonen, H. 1975. (Simulation of Artificial Stands and Derivation of Growing Stock Models from this Material.) Metsikön puuston simulointimenetelmä ja simuloituun aineistoon perustuvien puustotunnusmallien laskenta. Acta Forestalia Fennica Vol. 145. 31 pp.
[6] Kilkki, P. and Päivinen, R. 1987. Reference Sample Plots to Combine Field Measurements and Satellite Data in Forest Inventory. Helsingin yliopiston metsänarvioimistieteen laitoksen tiedonantoja 19: 209-215.
[7] Korhonen, K. and Kangas, A. 1997. Application of Nearest-Neighbor Regression for Generalizing Sample Tree Information. Scand. J. For. Res. 12:97-101.
[8] Laasasenaho, J. 1982. Taper Curve and Volume Functions for Pine, Spruce and Birch. Comm. Inst. For. Fenn. 108:1-74.
[9] Lemmetty, J. and Mäkelä, M. 1992. (Methods for Measurement of a Stand for Harvest Planning.) Suunnittelumittauksen perusteet ja toteutus. Metsätehon katsaus 11. 4p.
[10] Lukkarinen, E. and Vuorenpää, T. 1997. (Steering Harvester Bucking from Office.) Hakkuukoneiden apteerauksen ohjausta konttorista käsin. Koneyrittäjä 1/ 1997: 12-13.
[11] Mahalanobis, P.C. 1936. On the Generalized Distance in Statistics. Proc. Nat. Inst. of Sci. India 2:49-55.
[12] Maltamo, M. and Kangas, A. 1998. Methods Based on K-Nearest Neighbor Regression in the Prediction of Basal Area Diameter Distribution. Can. J. For. Res. 28:1107-1115
[13] Moeur, M. and Stage, A.R. 1995. Most Similar Neighbor: An Improved Sampling Inference Procedure for Natural Resource Planning. For. Sci. 41(2): 337-359.
[14] Näslund, M. 1936. (Swedish Institute of Experimental Forestry Thinning Experiments in Pine Forests.) Skogförsöksanstaltens gallringsförsök i tallskog. Meddelanden från Statens Skogsförsöksanstalt 28(1).
[15] Räsänen, T. 1999. (Stem Database As An Instrument of Wood Procurement Planning.) Runkopankki puunhankinnan ohjauksen apuvälineenä. Metsätieteen aikakauskirja 4/1999:727-729.
[16] Tommola, M., Tynkkynen, M., Lemmetty, J., Harstela, P. and Sikanen, L. 1999. Estimating the Characteristics of a Marked Stand Using K-Nearest-Neighbor Regression. Journal of Forest Engineering. Vol. 10 (2):75-81.
[17] Uusitalo, J. 1995. Pre-harvest Measurement of Pine Stands for Sawing Production Planning. University of Helsinki, Department of Forest Resource Management, Publication 9. 96 pp.