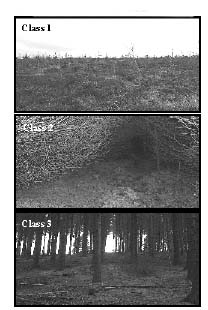
Figure 1. Examples of Sitka Spruce stands from the three defined forest stand classes. Class 1: no canopy above 2 m, Class 2: pre-thinning with closed canopy, Class 3: mature trees, high canopy with openings.
Vol. 13 No. 1 January 2002
N. M. Holden1
F. Criado Delgado2
P. M. O. Owende3
S. M. Ward4
University College Dublin
Ireland
ABSTRACT
Quantified, performance indicators for dynamic mode Differential GPS (DGPS) were collected at 31 sites established under 3 canopy classes (none, pre-first thinning and mature) of Sitka spruce stands in Ireland with varying altitude (100-500 m) and aspect. Canopy cover was quantified using total obstruction, size of largest opening and fragmentation of sky view. At sites with no canopy above 2 m, a mean precision of 1.5 m was recorded. Where canopy was present, precision ranged between 2.6 m and 2.8 m. The results indicated that in dynamic mode, differences in DGPS performance between canopy cover types were limited to a presence/absence effect. oss of 3-dimensional operation (i.e. only 3 satellites in view) occurred more frequently than loss of differential correction signal and thus had a greater impact on recorded precision over the duration of the experiment. It was concluded from the data collected that the most versatile approach when using dynamic DGPS is to collect more (potentially poorer quality) data, rather than to apply a filter at the signal acquisition stage. The observations made, and the conclusions drawn in this paper are relevant to the forest industry in the selection and operation of DGPS equipment for dynamic tasks where ~ 2 m precision is required.
Keywords: Dynamic DGPS, accuracy, precision, Picea sitchensis, Ireland. The authors are, respectively, 1College Lecturer, 2Research Assistant, 3Senior Research Fellow and 4Associate Professor, at University College Dublin.
INTRODUCTION
It is now well established that GPS is a useful tool in forest management because of an inherent need for geo-referenced, spatial information within the industry. For example, over the last decade GPS has been evaluated for the estimation of timber value [1], inventory plot location [4], forest road surveys [7], feature boundary surveys [9] and the tracking of harvesting machines [14].
The performance of GPS at forest sites is of concern because of potential signal loss due to canopy and terrain interference. GPS in differential mode (DGPS) has been evaluated in a number of geographical regions and forest conditions. Signal attenuation has been judged to be about 1 dB per metre of foliage [8], therefore a receiver should theoretically still operate below a canopy up to 15 m thick. It was also found that once the receiver was moving (i.e. in dynamic mode), then the quality of the position fix depended on the number of available channels (i.e. how many satellites could be tracked simultaneously), the density of foliage and branches, the number of lines of sight and the algorithms used by the receiver software. Differences between receivers are important when considering comparative performance. Point accuracy of post-processed differential correction data from both 6 channel (mean accuracy <7.34 m) and 12 channel (mean accuracy <3.70 m) units was evaluated [11] confirming that receiver quality is important for forest applications. Raising the height of the antenna significantly improves the quality of the position fix (using PDOP - positional dilution of precision, as a measure of performance) [3]. It has been concluded that anywhere between 30 [10] and 300 [13] static position fixes are necessary to achieve a reliable point accuracy, and that PDOP alone is not a good indicator of positional accuracy [13].
Relating DGPS performance to quantitative canopy descriptors has received modest attention in the literature. Position fix has been observed to be more erratic under coniferous canopy compared to deciduous [2], but the effect has not been quantified. Various brands of GPS receiver have performed poorly under forest canopy [5], but relating performance to quantifiable canopy attributes has not been undertaken seriously. A method for quantifying canopy structure in terms of total obstruction, largest opening and pattern of obstruction (fragmentation of sky view) using digital images has been developed, and statistically related to the static point performance of DGPS [6]. Quantified peripheral canopy obstruction around forest roads has also been related to DGPS performance [10].
Studies have also been undertaken to evaluate the potential of using GPS in dynamic applications such as machine tracking. A filter algorithm for a GPS unit was developed to remove poor data on import to a GIS [14]. Even a forest stand density of only 40 trees per ha reduced the quality of GPS position data so they were not sufficient to estimate reliable travel distances [12]. When working in dynamic mode there is one position fix per geographical location (in static mode there can be many fixes). If the task being undertaken does not require real-time position data (e.g. for machine management) then post-processing will provide the most reliable GPS positions [11], because there is no influence of dropped correction signals. For real-time applications it is necessary to evaluate DGPS performance to quantify the effect of dropped differential correction signal and constantly changing satellite view.
The aims of this work were: (i) to quantify the performance of DGPS in dynamic mode with respect to precision, repeatability, and reliability; (ii) to relate DGPS performance to the canopy characteristics of the forest stand and (iii) to account for the influence of aspect of the stand with respect to the general satellite constellation and correction service beacon. The approach of the study was to derive quantified measures of DGPS performance related to types of site, rather than to try and mechanistically relate GPS constellation characteristics to on-the-ground performance at specific moments in time. The study was undertaken before Selective Availability was discontinued. However, the change in the status of Selective Availability should have little impact on the results presented because to achieve a precision of ~ 1 m as expected from the receiver used, it is still necessary to use a differential correction service.
MATERIALS AND METHODS
Field sampling sites
Three canopy classes in stands of plantation Sitka spruce (Picea sitkensis) were defined for the purposes of evaluating the dynamic DGPS performance (Figure 1):
Class 1: No significant canopy over 2 m (pre-planting /pre-thicket /clearfelled)
Class 2: A very closed canopy (pre-thinning, sites with trees up to 20 years)
Class 3: Mature, thinned stands (post-thinning/pre-clearfelled; sites designated to be clearfelled were chosen for this study).
The study was confined to Sitka spruce plantations because they are the most common commercial tree crop in Ireland. The classes were chosen to represent stages of commercial forest development. A total of 31 sites were selected. Within each defined class, sites were located facing generally north, east, south and west (and coded as in Figure 2) to test for the influence of site aspect with respect to the known lack of satellites in the northern sky area over Ireland [10], and the relative position of the marine beacon differential correction service located about 90 km east of the experimental area. Sites were located within four forest areas (Roundwood _ Lat. 51o39', Long. 11o37'; Glenmalur _ Lat. 52o58', Long. 06o21'; Kilmacrea _ Lat. 52o55', Long. 06o09'; Ennisboyne _ Lat. 52o55', Long. 06o04'). All sites were within range of the Point Lynas DGPS correction beacon.
Figure 1. Examples of Sitka Spruce stands from the
three defined forest stand classes. Class 1: no
canopy above 2 m, Class 2: pre-thinning with
closed canopy, Class 3: mature trees, high canopy
with openings.
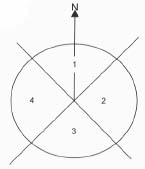
Figure 2. Aspect classes defined for the DGPS trial sites.
Tree Stand Characterisation
The stand at each site was characterised by the defined class and canopy cover. The method [6] was modified and used to quantify the canopy cover. Ten skyward facing digital images were collected using a digital camera at approximately 3 m intervals along the track defined for DGPS data collection resulting in a characterisation of the whole stand area equivalent to a representative elementary area [6]. The images were converted to greyscale and thresholded to define sky and trees using an automated algorithm. The obstruction of sky view by canopy (Op) was calculated as the percentage of black pixels in the total image (mean derived from 10 images reported). A Euclidean distance transform was then applied to the threshold image. The maximum pixel value of the transformed image represented the approximate radius of the largest opening in the canopy (DTmax). The maximum value from the 10 images for the site was reported. The fragmentation of the sky view (DTp) was determined indirectly by fitting a sigmoidal curve to the cumulative area frequency distribution of the distance transform images [6]. However, for images with only very small fragments of sky visible it was not possible to optimise curve fitting to obtain a value for DTp. For these sites DTp was estimated by the following procedure: (i) the total area (t) of visible sky was calculated, (ii) the radius of a circle (r) of area t was calculated, (iii) the ratio (f) of DTmax/r was determined (which is an estimate of the fragmentation of the sky area) and (iv) the value of DTp was estimated by a regression (Equation 1, Figure 3) derived from f and DTp values for data from the previous study [6]:
DTp = 0.426 + 1.558f (r2 = 0.94) (1)
where both parameter values were significant. The values used in calculations were based on mean f values for 10 images at each site.
The forest sites were grouped by allocated canopy class and the separation of the groups was tested using an ANOVA (H0: there was no significant difference between the canopy descriptors for the three defined canopy classes).
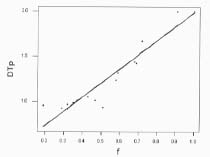
Figure 3. Plot of
DTp and f (see above for
definitions) including the best fit, straight-line
regression curve.
DGPS Data Acquisition
At each site a "track" was defined consisting of 3 randomly oriented straight line segments and a total length of 25-35 m. The track lines were fixed using string markers attached to trees. A relatively short length was chosen to reflect the short track lengths and non-predictable movement of harvesting machinery and foot surveys. Each site was visited on 10 separate occasions, at various times of day, between January 2000 and April 2000. During a visit, the defined track was traversed twice, at 3 km h-1, with the DGPS beacon (Trimble ProXRS GPS and integrated GPS/Satellite/Beacon antenna purchased in 1998 without multipath rejection) held 1.75 m above the ground. The DGPS receiver was configured with a signal to noise ratio (SNR) of 0.0, a PDOP threshold of 99.9 and an elevation mask of 150. The marine beacon correction service was selected because it is less prone to line-of-sight errors than geostationary satellite services (due to being transmitted in the medium wave band), there was a suitable beacon within range of the experimental sites and in Ireland there is little weather influence on the service. For each traverse the following were determined:
(i) the track precision (pr, m) as reported by the Trimble Pathfinder Office software which is the average precision for all the points that make up the track. The exact details of the calculation were not available from Trimble, but it takes account of: (a) the type of receiver; (b) the dilution of precision at the time of observation; (c) the distance between the base station and rover and (d) the reference variance produced during differential correction [15].
(ii) the percentage of points with real-time correction (%RTC) was calculated from the receiver status data as:
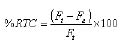 (2)
(2)
where Ft is total number of instantaneous fixes and Fu is number uncorrected. The mean value for 10 visits was reported.
(iii) the percentage of points with 3D position fix (%3D) calculated from the receiver status data as:
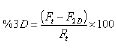 (3)
(3)
where F2D is number of 2 dimensional fixes The mean value for 10 visits was reported.
(iv) the mean coefficient of determination (r2) for the best-line fit for each straight segment of the track was calculated for each visit and the mean for the 10 site visits reported. The value of r2 is used in this instance as a mathematical measure of the spread of data around the line and not as a statistical tool. The mean r2 value was an indirect measure of DGPS performance which indicated the magnitude of spread of data around the best-fit straight line for each track; effectively this is a measure of the noise imposed on the DGPS track due to all sources of error, but principally the tree canopy.
(v) the grid bearing of each straight segment of the track was calculated for each visit from the best-fit straight line, and the standard deviation for the 10 visits reported.
The performance indicators were analysed with respect to the canopy classes using ANOVA (H0: there was no significant difference between performance indicators by canopy class).
RESULTS AND DISCUSSION
Forest Canopy Characteristics and Forest Stand Classes
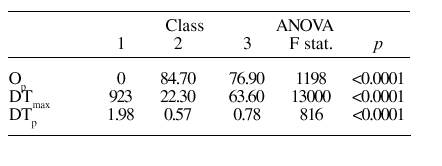
Results of mean Op, DTmax and DTp for each forest stand class are presented in Table 1. The forest stand classes had significantly different canopy structures; there was a clear distinction between Class 2 and Class 3 sites. The ANOVA test revealed that the was little risk of error (p<0.001) in rejecting the null hypothesis. From field observation the skyward looking data can be related to obstruction in all directions from the observation point, that is, where obstruction overhead was severe there was significant obstruction from the sides (e.g. the images in Figure 1 illustrate how a Class 3 site tends to be more open laterally than Class 1 or 2). As the value of DTp increased, sites became more open and had less obstruction, with less fragmentation of sky view (i.e. the difference between Class 2 and Class 3 sites). The forest stand classes of the selected sites had significantly different canopy structure, and presented distinct operating conditions for DGPS.
Table 1. Mean canopy descriptors for the three forest canopy classes quantified by Op, DTmax and DPp. Discrimination of the three classes was tested using an ANOVA analysis.
DGPS Performance Indicators:
- Precision, % Real-time Corrected, % 3D Mode
Due to the discontinuation of Selective Availability, the data presented in this paper may slightly over-estimate inaccuracy where a significant proportion of data in a line feature were collected without differential correction (not common in this study).
The mean pr, %RTC and %3D data for the 3 forest stand classes are presented in Table 2. The mean precision for the Class 1 sites, at 1.5 m, was poorer than expected given the specification of the receiver to operate at ~1.0 m precision. The value obtained can be explained by the influence of poor satellite geometry, poor orientation with respect to the satellite constellation and the correction service transmission and the possible inclusion of multipath signals due to the low SNR filter. For example at site GL10, on one occasion the PDOP was above 70 and the precision ~40 m. In normal operations the GPS software would have rejected the poorest data. These results show that acceptable performance is possible with less strict data filtering than recommended by the manufacturer.
Table 2. Variation in DGPS performance indicators by management class
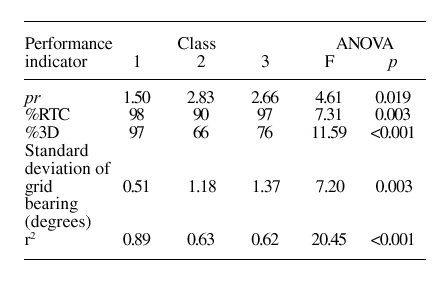
The canopy had a significant effect on precision, causing it to degrade from about 1.5 m to about 2.8 m. The difference in DGPS performance under the young and mature canopy was small. The effect of canopy type on performance can be more clearly understood by evaluating the percentage of points without real-time correction and the percentage of points in 3D mode. There was no significant difference in the amount of data with real-time differential correction between Classes 1 and 3, but there was a significant loss of correction signal (10%) under Class 2 canopy. The fact that there was little difference in precision under the two closed canopy forest stand classes indicated that intermittent differential correction signal drop was not a great problem. Under canopy the GPS operated in 2D mode for 24 - 34 % of the time. The associated precision did not result in the system being unusable. There was no significant correlation between the final precision and the loss of the differential service (r = -0.340, p = 0.061, Figure 4A), but there was a significant effect by the loss of 3D fixes (r = -0.724, p<0.001, Figure 4B). For forest stand classes 2 and 3 the poorer precision was due to the canopy forcing the use of less suitable satellite geometry (increased PDOP) rather than an overwhelming effect of dropped correction signal. The data possibly reflect an acquisition situation not generally recommended, i.e. all available data were used to derive these mean values. In normal operations it would be usual to filter out position fixes with high PDOP and poor SNR. Even with these poor data (PDOP >6.0 represents ~ 45 % of the total collected) the performance of the DGPS was considered to be adequate for forest inventory surveying because it would be an improvement over estimation by eye using large scale maps. Similar conclusions were drawn from data collected in Indiana, USA [13].
The relationships between precision and other site characteristic were also evaluated graphically (Figure 4C-H). The data pattern for pr vs. Op (Figure 4C) compared well with that found for static mode [6][10]. A similar relationship between percentage canopy closure and Root Mean Squared Error accuracy (i.e. precision) was found elsewhere [13]. Up to 30 % canopy cover causes a large degradation in DGPS performance, while further increases in cover results in more erratic performance. The data for the largest opening in the canopy (Figure 4D) indicated a spread of precision over the whole range of values encountered. The same was found for fragmentation of sky view (Figure 4E). From the data collected, there was no correlation between precision and the aspect (Figure 4G) or the altitude (Figure 4H) of the sites.
Track Repeatability: Direction and Spread of Data
The mean standard deviation of the grid bearing predicted for each track segment from the 10 visits (indicating the relative repeatability of a track) correlated significantly with forest stand class (r = 0.555, p = 0.001) and the 3 canopy descriptors (Op: r = 0.569, p = 0.001; DTmax: r = -0.563, p = 0.001; DTp: r = 0.558, p = 0.001). There was a significant difference between the forested (class 2 and 3) and non-forested sites (class 1), but there was little effect of forest stand maturity once a complete canopy was present (Table 2). Due to the relatively short track lengths used in this study, the error indicated by the grid bearings are probably greater than might occur in practice for longer straight line runs. Lack of a significant correlation between track repeatability and precision indicates that the standard deviation of the grid bearings was important because it was a good indicator of the influences of noise in the system.
The mean r2 value for each track derived from fitting straight lines to the co-ordinate data gave an indication of the noise within the data set for each site. r2 values correlated significantly with forest stand class (r = -0.683, p = <0.0001), %RTC (r = 0.367, p = 0.042), %3D (r = 0.578, p = 0.001), pr (r = -0.450, p = 0.11) and the 3 canopy descriptors (Op: r = -0.768, p = <0.0001; DTmax: r = 0.770, p = <0.0001; DTp: r = 0.760, p = <0.0001). A summary of r2 values for the forest stand classes is given in Table 2. The high value for class 1 indicates that the DGPS tracks were very good in the open (where dropped correction and number of satellites in view were less of a problem), but were more noisy for class 2 and 3 as would be expected due to poorer satellite view and periodic loss of differential correction service.
The combination of gradient and r2 value indicate that it is possible to fit a good quality straight line to the data, but that it may not be a true representation of the actual line of travel. It can be concluded that for tracking operations where machines move over short distances, DGPS may not be good enough, but it may be adequate for longer track length operations and mapping applications.
PDOP Filter Settings For DGPS Applications In Forest Operations
In order to get the most from DGPS in forest operations it is probably necessary to work with data that would normally be excluded under ideal conditions. The maximum PDOP and mean horizontal precision for over 900 line features, collected at the 31 sites used in this study were examined by total distribution (Figure 5) in an attempt to investigate the possibility of drawing up recommendations for using DGPS in the forest environment. It can be seen that the frequency distribution of values for both variables were positively skewed, which means that using standard deviation as a distribution descriptor will result in misleading conclusions. From the distributions it can be seen that 95% of the data have a PDOP <16.2 which corresponds to a maximum precision of ~ 7 m, with the vast majority of the data being far superior (75% of data with a precision <2.13 m). Thus for survey work in forests it is suggested that the PDOP filter on a DGPS unit should be set to 20, and a worst-case mean precision of 8.6 m can be expected for line features mapped in this manner. Increasing the SNR filter, and use of multipath rejection technology might improve this value further. For stand mapping and machine tracking applications this would be an acceptable DGPS performance (< 2.5 m most of the time), and would ensure a sufficiency of data for the application.
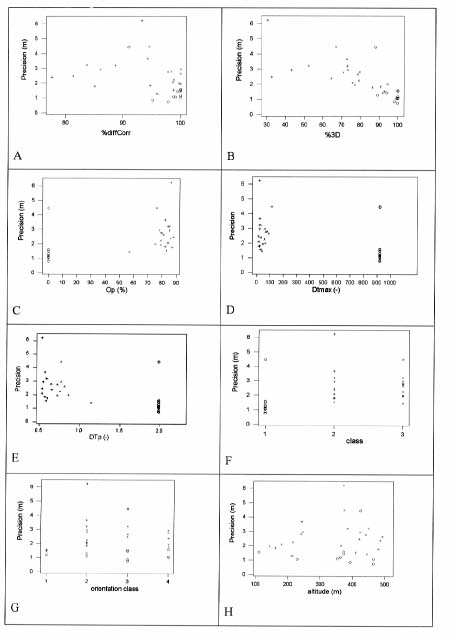
Figure 4: Graphs of precision vs quantified site characteristics and classes. ( O = Class 1, + = Class 2, X = Class 3).
A: precision vs. percentage of real-time differential correction. B: precision vs. percentage of 3D fixes.
C: precision vs. percentage canopy obstruction. D: precision vs. largest hole in canopy. E: precision
vs. canopy fragmentation index. F: precision vs. management class. G: precision vs. aspect class. H:
precision vs. altitude.
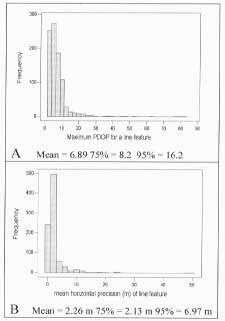
Figure 5. Frequency of maximum PDOP (A) and
mean horizontal precision (B) for line features
CONCLUSIONS
Based on the results of this study it may be concluded that DGPS performance (precision, repeatability) under Sitka spruce canopy is adequate for forest operations such as inventory survey but for machine tracking, where real-time data are not required post-processing for differential correction might ensure better quality results. In general, merely the presence of canopy was enough to degrade the quality of the DGPS position fixes _ no specific relationship with canopy cover could be derived, probably due to the dynamic nature of the data acquisition. No effect of site aspect or altitude could be detected in the study which suggests that the marine beacon correction service is suitable for use in forestry where it is available.
When using DGPS, it is better to collect with little filtering and then apply post hoc processing, rather than to be strict about the raw data because the GPS software will "block" operations under poor conditions even though data can be salvaged that are quite useable. For dynamic mode applications DGPS offers a precision of ~ 2.5 m under forest canopy which is similar to static mode, but there is more "noise" in the data collected.
AUTHOR CONTACT
Dr. Holden can be reached by e-mail at: Nick.Holden@ucd.ie
REFERENCES
[1] Bergstrom, G. C. 1990. GPS in forest management. GPS World September/October 1990, 46-49.
[2] Deckert, C and P. V. Bolstad. 1996. Forest canopy, terrain and distance effects on global positioning system point accuracy. Photogram. Eng. and Rem. Sens. 62: 317-321.
[3] D'Eon, S. P. 1996. Forest canopy interference with GPS signals at two antenna heights. N. J. App. For. 13: 89-91.
[4] Evans, D, R. W. Carraway and G. T. Simmons. 1992. Use of global positioning system (GPS) for forest plot location. S. J. App. For. 16: 67-70.
[5] Firth, J. and R. Brownlie. 1998. An efficiency evaluation of the global positioning system under forest canopies. New Zealand For. 43: 19-25.
[6] Holden, N. M., A. A. Martin, P. M. O. Owende and S. M. Ward. 2000. A method for relating GPS performance to forest canopy cover. Inter. J. For. Eng. 12(2):51-56.
[7] Jalinier, C. and J. Courteau. 1993. Forest road surveys with GPS. For. Eng. Res. Inst. Canada. Technical Note TN-196.
[8] Lachapelle, G. and J. Henriksen. 1995. GPS under cover: the effect of foliage on vehicular mavigation. GPS World March 1995, 26-35.
[9] Liu, C. J. and R. Brantigan. 1995. Using differential GPS for forest traverse surveys. Can. J. For. Res. 25: 1795-1805.
[10] Martin, A. A., N. M. Holden, P. M. O. Owende and S. M. Ward. 2001. The effects of peripheral canopy on DGPS performance on forest roads. Int. J. For. Eng. 12(1):71-79.
[11] Nœsset, E. 1999. Point accuracy of combined pseudorange and carrier phase differential GPS under forest canopy. Can. J. For. Res. 29: 547-533.
[12] Reutebuch, S. E., J. L. Fridley and L. R. Johnson. 1999. Integrating realtime forest machine activity with GPS positional data. ASAE annual meeting, July 18-21, Toronto, Canada. Paper # 995037.
[13] Sigrist, P., P. Coppin and M. Hermy. 1999. Impact of forest canopy on quality and accuracy of GPS measurements. Int. J. of Rem. Sens. 20: 3595-3610.
[14] Thompson, J. D., G. Delbridge, R. J. McCormack and J. Coleman. 1998. Tracking forest harvesting machines with global positioning system (GPS) in south eastern Australia. ASAE annual meeting, July 12-15, 1998, Orlando, Florida. Paper # 987018.
[15] Trimble information supplied from the Irish distributor CharterNavGPS, Cork.