Vol. 13 No. 1 January 2002
Nuutti Kiljunen
University of Joensuu
Joensuu, Finland
ABSTRACT
A method and functions are introduced for estimating the dry mass of logging residues for the most common Scandinavian tree species. Functions were formulated for single trees using different combinations of independent variables that can be measured by standard measuring equipment on harvesters. Cross-validation was used to test the functions and to assess their validity. According to the cross-validation, the total dry mass of logging residues in a clear-cut area could be estimated with a relative standard error of 9.4 - 11.2%. For individual trees, however, the relative standard error for estimating the dry mass of logging residues was as high as 21.5 - 27.6%, depending on the tree species and on the independent variables used in the functions. The models introduced were however more accurate than the generally applied method of estimation, which is based on the average ratio of the dry mass of logging residues to the volume of merchantable wood.
Keywords: measurement of logging residues, residual forest biomass, slash, Finland, harvester, Pinus sylvestris, Pinus abies, Betula pendula, Betula pubescens.
The author is a Research Scientist at University of Joensuu.
INTRODUCTION
Logging residues have recently become more important as a source of energy in Finland. For the year 2003, there are plans to increase the use of logging residues for energy by five times the level used in the year 2000 [6]. Logging residues for fuel have been procured by specialized energy-fuel companies or by timber-harvesting companies. As research and pilot projects come to an end, the collection of logging residues for fuel will become more business oriented; therefore more efficient tools for planning are needed. Accurate data about reserves of logging residues on clear-cut areas will give companies the possibility to plan their use of residues more efficiently. If the logging residues have commercial value, a forest owner may also be interested in knowing how much will be available from his or her forest.
In modern, mechanised, Nordic-style timber harvesting the information used for timber measurement is obtained with measuring equipment that is integrated into the mechanical harvester. Due to the location of the measurement equipment in the harvesting head, the data produced offer information on the stem form starting some tens of centimetres up from the initial cut at the stump; the unmerchantable top is not measured. The information provided by the measurement equipment allows for the construction of most of the stem taper curve. Because of the allometric relationship between different parts of a tree, this information itself, or complemented with additional information about the crown of the tree, can be used to estimate dry mass of the logging residues.
In previous studies, different types of equations for the common Scandinavian tree species have been created in order to estimate the branch biomass of a tree with easily measured characteristics [1,5,12]. In addition, information about the establishment, treatment history, and age of a stand was valuable when the properties of the crown were modelled [13,14,15]. The independent variables used in those studies were not applicable to the measurement data obtained from the measurement system of a harvester. The original idea for this kind of estimation method for the mass of logging residues was presented by Hakkila et al. [7].
For an individual tree, the dry mass of the logging residues that can be estimated in a harvester's data management system consists of three parts. For harvested trees, the greatest proportion of the total mass of the logging residues is made up of branches. Smaller proportions are made up of the unmerchantable top sections of the stem and of cull-log sections, which do not meet the standards for utilisation by wood-processing facilities [7].
In this paper, models for estimating the dry mass of logging residues using the data management system of a modern harvester are introduced and validated. Functions are presented for estimating both branch dry mass and unmerchantable top dry mass. Branch mass includes both fresh and dead branches as well as intact needles. The dry mass of the cull-log sections, which form an additional proportion of the logging residues, can be estimated from their volume by using a simple conversion factor that is specific for each tree species. This volume can be obtained from the measuring system of a harvester. This method is compared with a simpler method for estimating the dry mass of logging residues, which is based on the average ratio between the dry mass of residues and the volume of merchantable wood. Models of needle percentage for conifers are introduced, because the proportion of foliage is important in determining the yield and quality of the residues as fuel.
MATERIALS AND METHODS
Data Collection
Between 1984 and 1986, 2050 trees located in 41 stands in different parts of Finland were harvested by the Finnish Forest Research Institute for measurements of stem and branch biomass. The species included were Scots pine (Pinus sylvestris), Norway spruce (Picea abies) and birch (Betula pendula and B. pubescens combined). The fieldwork was carried out between April and October of the above-mentioned years. For each stand the measurement date, geographical co-ordinates, dominant tree species, and yield of timber from the harvest (m3/ha) were recorded as variables. For a more detailed description of sampling, measurements and locations of the sample stands see Hakkila [5]. The owners of all the stands had already planned to harvest their stands by the date the measurements were made, so they are actual samples of real harvests. Some of the data contained incomplete records or unclear figures; because these records were deleted from the data, the analyses began with 2022 trees. Before the functions were constructed, small-diameter trees that did not meet the size requirements for merchantable wood were removed from the data.
Five sample plots were placed in each stand. The centre of the first plot was located exactly fifty metres from the initial entry point of the stand. The next plots were located in line with the first in the same direction, with fifty metres between each. If the stand shape did not allow the plots to be located in the same direction, the next plot was located fifty metres orthogonally from the previous one. On each plot, the type of forest vegetation, basal area, average tree height, average stem volume and average tree age were recorded.
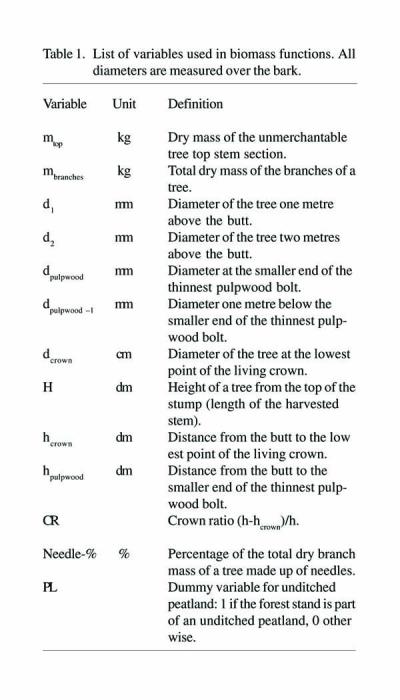
On each plot, the ten trees closest to the centre of the plot were felled for measurements. Trees with less than a 45 mm diameter at breast height (1.3 metres) were not selected as sample trees. On each sample tree the diameter of the main stem over the bark was measured at various points including: the butt, one metre above the butt, breast-height, at two-metre intervals from the butt to the top of the tree, and at the lowest point of the living crown. The distance from the butt to the lowest point of the living crown (hcrown) was also recorded. The descriptions of each variable and symbol are presented in Table 1.
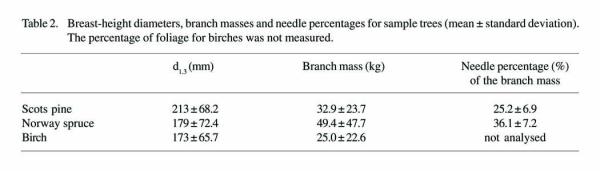
Sample trees were delimbed at two-metre intervals from the butt. The mass of the intact branches for each interval was recorded. The sum of the weights from the two-metre intervals is the total branch mass of a tree. In addition, one tree from every plot was randomly chosen for measurement of the moisture content. If the tree was a conifer, samples of the needle mass were also taken. The mass of birch foliage was not measured. Samples were dried at a temperature of 103°C. The dry mass for the needles and wood of coniferous trees is described separately (Table 2). Because the field measurements were taken over a long period of time, variation in the needle percentages was great, due to the increase in needle mass, especially in pines, during the growth period [5].
Data Treatment and Analysis
Stem taper curves, based on Laasasenaho's simultaneous equations [11], were fitted individually to each of the stems in the sample using the Finnish Forest Research Institute's KPL (Koealojen puu- ja puustotunnusten laskentaohjelma) program for calculating tree and stand characteristics [8]. Variation in the top diameter of the smallest pulpwood log, which was due to the combined effects of limits on log length, unmerchantable damaged or flawed top sections of the stem, etc., was simulated. To randomise any error in the selection process, different diameters of pulpwood top (in centimetres) were chosen randomly for each stem from a uniform distribution of natural numbers from 5 to 9. When a randomized diameter of the pulpwood top was chosen for the stem, the distance from the butt of the tree to this randomly determined point had to be calculated. However, the data included only diameters measured at 2-meter intervals (except close to the butt where the interval was 1 meter). Therefore, the taper curve between the measured points was assumed to be linear. Then it was possible to determine between which measured points the randomly chosen diameter was located, and by using the measured points on both sides of the randomized point, an estimate was obtained for the length of the utilizable part of the stem (up to the pulpwood top). If the distance between the butt and the pulpwood top diameter was less than two meters, the tree was not included in further analyses. For the actual cutting, such small trees are not felled by harvester. Therefore, they can't be measured by this system. The data for analysis therefore decreased from 2022 trees to 1903 trees, which included 653 pine, 805 spruce, and 445 birch.
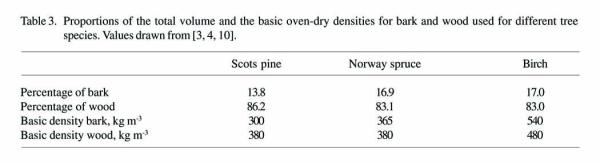
The dry mass of the unmerchantable tops of the stems was calculated based on the volumes of revolution obtained by integrating the stem taper curve from the pulpwood top to the treetop. The proportions of the volume and dry mass for bark and wood for the different species used in the study are shown in Table 3. The importance of the mass of the unmerchantable top decreases considerably as the size of the tree increases (Figure 1). In trees that have breast-height diameter of more than 20 - 25 cm, the proportion of the total dry mass of the logging residues made up by the unmerchantable top remained fairly constant.
The linear ordinal least-squares regression method was used to construct the functions with the computer software SPSS for Windows version 9.0. Models for calculating the dry mass of the unmerchantable top and the branch dry mass for individual trees were formulated by transforming the value for dry mass into its natural logarithm. The transformation was used as a dependent variable. Stem-length models and needle-percentage models were formulated without transformations.
The principles for making measurements with the measuring system of a harvester restrict the applicability of independent variables in these models. Measurements of the stem diameter at 1 metre and 2 metres from the butt and the stem taper between the 1-metre and 2-metre points were selected as basic measurements of independent variables. This was because on most trees these characteristics could be measured using the measuring equipment in a harvesting head. Diameter measurements farther from the butt might also give valuable information; but if only one pulp bolt less than 3 metres long is extracted from a tree, no other (upper) diameters would be measured. The diameters at 1 and 2 metres are highly correlatated with each other, so only the diameter variable that produced the greater coefficient of determination was included in the model. Length of the stem was also included in the branch-mass models, although it has to be calculated first with a separate model. The diameter at the smaller end of the smallest merchantable piece of wood (dpulpwood) and its corresponding distance from the butt (hpulpwood) provide information about the top of a tree. For models of stem length and top mass, stem taper from the point one meter below the smaller end of the smallest merchantable piece of wood to the smaller end was considered to be the independent variable. In some versions of the models, the distance from the butt to the lowest point of the living crown (hcrown) and the diameter at this point on the living crown (dcrown) were added as independent variables. In studies where plant form has been analysed quantitatively, a strong relationship has been found between the diameter at a certain height and mass of the living branches [16].
[3,4,10].
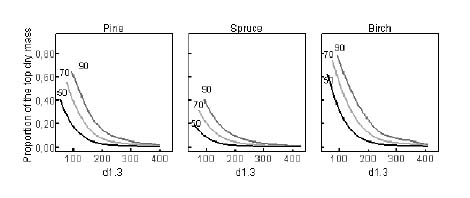
Figure 1. For final harvests, the proportion of the total dry mass of logging residues from an individual tree accounted for by the unmerchantable top is presented as a function of the smallest pulpwood top diameter (50 mm, 70 mm, or 90 mm) and breast-height diameter (d1.3).
When the functions were constructed, the significance level of 0.05 was used as a basic criterion for including variables into functions. All available independent variables were first included in the models; then one by one the least significant variables were removed until the criterion was fulfilled. In some cases a slightly higher level of significance was accepted, but in every case the significance of each variable was less than 0.07. Branch-mass functions for two different levels of accuracy were formulated for each tree species. On the first tier, information obtainable only from the stem curve was used. On the second tier, variables describing characteristics of the lower end of the crown were added. Residual plots of all functions were checked for non-linearity. Where necessary, appropriate natural logarithmic transformations were applied to independent variables.
RESULTS
Mass of the Unmerchantable Top
Models for the unmerchantable top give a value for the dry mass of the treetop, i.e. the stem section above the pulpwood bolt with the smallest diameter (Equations 1 to 3). The branches connected to this part of the stem are not included in this treetop dry mass; they are part of the branch dry mass. The functions are presented in a form that gives the actual value of the mass, eventhough they were constructed in logarithmic form.
Dry Branch Mass
Models for estimation of the total dry mass of the branch biomass of an individual tree, including branch wood, bark, and needles; were based on two different tiers of independent variables (Equations 4 to 9). Increasing the number of independent variables would improve the accuracy of the model, but would also require more computational time in the harvester's computer. Measuring variables other than those obtainable from the taper curve, such as distance from the butt to the lowest point of the living crown, also increases the work load of a harvester operator because these points have to be determined when the timber is being bucked. Roman numerals in parenthesis indicate the tier of the model. The first-tier models include only variables associated with the stem. For the second-tier models, information concerning the lowest point of the living crown is also included.
Length of Stem
To calculate the length of the stem of a harvested tree for branch-biomass and needle-mass proportion models, models for the stem length are needed if there is no other model for calculating the tree length in the harvester's system of data management. The models give the length of the tree stem measured from the butt (Equations 10 to 12).
Proportion of Needle Mass
Models of proportion of needle mass were calculated for both coniferous species. These equations can be used to estimate the proportion of the total dry biomass of the branches made up by the foliage (Equations 13 to 16). Loss of needles during drying of logging residues diminishes the yield of usable fuel, but it also has some advantages in that it improves the quality of the fuel by lowering the moisture and chlorine contents.
Models for the unmerchantable top
Two different tiers of independent variables were used to construct the models for needle percentage. Roman numerals in parenthesis indicate the tier of the model. The first tier included variables that were directly measured from the stem or were calculated with the help of the stem-length model. For the second-tier models, crown ratio was added as an independent variable. The use of crown ratio as an independent variable required an additional computation phase. The crown ratio was calculated using the calculated value for the length of the harvested tree stem and the observed value for distance from the butt to the lowermost portion of the living crown.
Pine
mtop = exp{-9.293 - 0.876 ln(d2) + 0.003492
hpulpwood + 3.047 ln(dpulpwood)
+
1.220 (dpulpwood /dpulpwood _1)}
R2=0.91
(1)
Spruce
mtop = exp{-11.161 - 0.610 ln(d1) + 0.002527
hpulpwood + 3.298 ln(dpulpwood)
+
0.888 (dpulpwood /dpulpwood _1)}
R2=0.94
(2)
Birch
mtop = exp{-8.025 - 1.066 ln(d2) + 0.00470
hpulpwood + 3.172 ln(dpulpwood)
+
0.636 (dpulpwood /dpulpwood _1)}
R2=0.88
(3)
Models for the Branch Biomass
Pine
mbranches (I) = exp{-11.166 + 2.915 ln(d2) _
0.006380
h} R2=0.86
(4)
mbranches (II) = exp{-8.356 + 1.919 ln(d2) + 0.00205
hcrown
+
0.724 ln(dcrown) - 0.001964
h} R2=0.93
(5)
Spruce
mbranches (I) = exp{-8.195 + 2.349 ln(d2) _
0.0001767
h} R2=0.91 (6)
mbranches (II) = exp{-3.415 + 0.378 ln(d1) + 1.753
ln(dcrown) - 0.0009532
h} R2=0.94
(7)
Birch
mbranches (I) = exp{-10.629 + 2.913 ln(d2) _
0.002480 h _ 1.166
(d2/d1)} R2=0.91 (8)
mbranches (II) = exp{-7.085+ 1.560 ln(d2) + 1.067
ln(dcrown) _ 0.947
(d2/d1)} R2=0.93
(9)
The mean r2 value for each track derived from fitting straight lines to the co-ordinate data gave an indication of the noise within the data set for each site. r2 values correlated significantly with forest stand class (r = -0.683, p = <0.0001), %RTC (r = 0.367, p = 0.042), %3D (r = 0.578, p = 0.001), pr (r = -0.450, p = 0.11) and the 3 canopy descriptors (Op: r = -0.768, p = <0.0001; DTmax: r = 0.770, p = <0.0001; DTp: r = 0.760, p = <0.0001). A summary of r2 values for the forest stand classes is given in Table 2. The high value for class 1 indicates that the DGPS tracks were very good in the open (where dropped correction and number of satellites in view were less of a problem), but were more noisy for class 2 and 3 as would be expected due to poorer satellite view and periodic loss of differential correction service.
Models for Stem Length
Pine
h = 93.780 _ 24.579 ln(d2) + 1.093 hpulpwood
+
25.374(dpulpwood/dpulpwood _1) + 0.507
dpulpwood R2=0.98
(10)
Spruce
h = 69.244 - 20.755 ln(d1) + 0.686 dpulpwood +
1.086 hpulpwood
+
21.651 (dpulpwood /dpulpwood -1)
R2=0.99
(11)
Birch
h = 160.388 - 37.517 ln(d1) + 1.151 hpulpwood
+
0.832 dpulpwood + 10.533 (dpulpwood /dpulpwood
_1) R2=0.96
(12)
Models for Proportion of Needle Mass
Pine
Needle-% (I) = 44.921 _ 0.09661
d2 R2=0.56
(13)
Needle-% (II) = 37.882 _ 0.08850 d2 + 11.085
CR R2=0.58
(14)
Spruce
Needle-% (I) = 42.005 _ 0.0817 d2 + 0.0651 h _ 14.518
PL R2=0.33
(15)
Needle-% (II) = 24.610 _ 0,124 d2 + 0,110 h + 23.305 CR _ 14.308
PL R2=0.43
(16)
Reliability and Capability of the Models
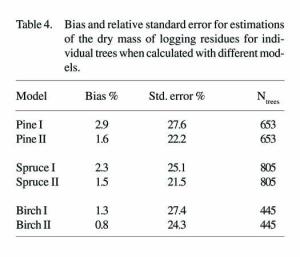
All of the bias percentages in the following tables were calculated by subtracting the calculated values from the measured values, then dividing the remainders by the measured values and finally, calculating the mean value. A positive error or bias therefore refers to a predicted value smaller than the real value. Standard error percentages are the standard deviations of the errors as percentages (Table 4). The small biases that occurred in the models were caused by transformations when the result of a logarithmic function was transformed back to the original units (i.e. kilograms).
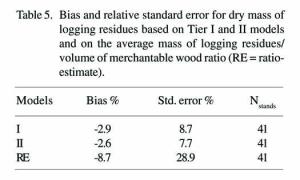
A simple method for estimating the amount of logging residues within a stand is to base the estimate on the ratio of the mass (or volume) of logging residues to the volume of merchantable wood. The accuracy of this method is compared here with the results obtained using the models (Table 5). In this case, the average ratio figures were 92.5 kg/m3 for Scots pine, 198.5 kg/m3 for Norway spruce, and 101.8 kg/m3 for birch. The stand-level errors were calculated by adding up the errors for individual trees from a stand and dividing this total by the sum of the calculated total masses for the trees. Thus, "stand level" does not strictly mean a real "stand" here, but rather a sample of trees from the same stand.
Cross-validation was used to test the validity of the method for estimating logging residues [2]. Thirty stand samples were drawn from the data. When the samples were selected, each stand had an equal probability (67%) of being included in the sample. The stands chosen as samples were used as data for constructing branch-mass models based on the same dependent variables as used in models constructed with the whole data set. The model constructed from the sample stands was then used to estimate the branch mass for the trees of those stands not selected as sample stands. The mass of the unmerchantable top stem section was calculated using the same functions that had been constructed using the whole data set. This model for the unmerchantable top wood was not cross-validated because the top wood constituted such a small proportion of the total mass of the logging residue. Although the measured lengths of the trees were available from the data, the lengths needed during the cross-validation, for the branch mass functions and the unmerchantable top mass functions were calculated using the stem-length model. This was done to simulate the situation in which the data would come only from the harvester.
A total of 382 stands were used as test data for the cross-validation functions created with the selected sample data. The cross-validation procedure was iterated 40 times; therefore, every stand in the entire data set was, on average, included in the test data 9.3 times. The relative bias for cross-validation was slightly higher than if it had been calculated with the whole set of data (Table 5). The standard error was also slightly higher. At the stand level, for the first tier models (I) the bias was 4.6% and the relative standard error was 11.2%. For the second tier models (II) these figures were and 3.2% and 9.4% , respectively. The error distributions are presented in Figure 2.
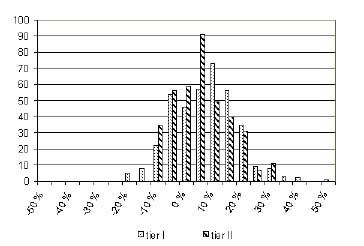
Figure 2. Cross-validation stand-scale distributions of relative error for model tiers I and II. The total number of stands used for cross-validation was 382.
DISCUSSION
Although the relative standard error was at least 20% for individual trees on every tree species studied, on the stand level the error was closer to 10% (Tables 4 and 5). With the "ratio estimation method", the relative error was almost three times that of the models. It must be noted that in this case the stand level examination is based only on trees measured from the same stand, not on entire real stands. Nevertheless, in this case the number of trees (at least 38) from each stand gives a basis for estimating of the variation between stands. The observed bias at the tree level was not in itself a big problem as long as the stand level bias was small.
Unfortunately, due to the limited availability of this kind of data for Finnish forests, the basis for validation was not the best possible. The widely used correction factor for models with logarithmic transformation, 0.5se [9], which was added to the models in logarithmic form, was in this case found to be useless in because it corrected too strongly the stand level bias. However, the bias could be corrected later with a percentage calculated during cross-validation. Another way to correct for bias could be to add a small constant (in this case about 0.05) to the logarithmic branch-mass functions (Equations 4 to 9) within parentheses as a correction factor. For production planning, it is important to determine what percentage yield of the measured logging residues would be available as chips for the end user, probably a power station or heating center.
When an appropriate percentage, which may vary according to environmental conditions, is determined, accurate estimations of the amount of residues in the forest at the beginning of the wood fuel procurement chain would not be so important.
Diameter at a height of 1 metre or 2 metres and tree length seem to be a good basis for estimating of the mass of the branches. As information about the lower point of the living crown is added, the figure becomes more accurate but the improvement is not large. In future, if determination of the end of the crown becomes advantageous for timber-bucking algorithms, the use of tier II models would be much more practical. The models for percentage of needles did not have a high coefficient of determination. More accurate models need independent variables that at present can't be measured with the standard equipment on a harvester.
In addition to unmerchantable tops and branches, low quality cull sections also form a part of the logging residues, especially in spruce stands [7]. A harvester can usually measure these cull sections in the same way as it measures normal commercial wood. Due to problems with comminution, however, their usefulness as raw material for fuel may be low. Small-diameter trees that do not meet the minimum requirements for commercial timber are usually not cut by a harvester during clearcutting and were thus not included in the models presented here. Hakkila et al. [7] estimated the average total volume of undersized trees on clear-cut stands in Finland to be about 2-3 m3/ha, which is usually about half the total volume of the unmerchantable tops from the same stand.
The amount of logging residues from a tree varies considerably independently of the basic tree variables usually measured, such as diameter at a height of 1 metre or 2 metres and total height. Variables describing the properties of the crown of a tree provide more accuracy, but the error is still quite large. Information about upper diameters (above 2 metres) would make the functions more accurate, but then another model would be needed for smaller trees. Fortunately, the error diminishes markedly at the stand level, and it is reasonable to estimate the amount of residues using models based on some variables that can easily be measured with the measuring equipment on a harvester.
At the stand level, the models provide a fairly good estimate for planning the procurement of logging residues. These models also provide a possible way to determine the amount of logging residues for commercial purposes, if the usable percentage yield of the residues can be estimated. Higher accuracy than what was possible on the stand level with the models tested may not be needed, because at the moment either there is no stumpage value for logging residues or the value is very low. To determine the usable proportion of residues, further large-scale research is needed to determine the effects of drying time and stand variables.
AUTHOR CONTACT
The author can be reached by e-mail at --
nuutti.kiljunen@metla.fi
REFERENCES
[1] Albrektsson, A. 1980. Biomass of Scots pine (Pinus sylvestris L.). Amount _ development _ methods of mensuration. The Swedish Univ. for Agric. Sci., Dept. of Silvi. Report 2. 189 pp. ISBN 91-576-0338. (In Swedish with English summary.)
[2] Efron, B. 1982. The jacknife, the bootstrap and other resampling plans. Regional Conference Series in Applied Mathematics 38. Soc. for Ind. and Appl. Math. Philadelphia. 92 pp.
[3] Hakkila, P. 1967. Variation patterns of bark weight and bark percentage by weight. Communicationes Instituti Forestalis Fenniae 62(5):1-37. (In Finnish with English summary.)
[4] Hakkila, P. 1989. Utilization of Residual Forest Biomass. Springer Series in Wood Sci. New York. 568 pp. ISBN 0-387-50299-8
[5] Hakkila, P. 1991. Crown mass of trees at harvesting phase. Folia Forestalia 773. 24 pp. ISBN 951-40-1160-0. (In Finnish with English summary.)
[6] Hakkila, P. and Alakangas, E. 2000. Wood Energy Technology Programme. VTT Symposium 205: 11-27. ISBN 951-38-5704-2. (In Finnish with English summary.)
[7] Hakkila, P., Nurmi, J. and Kalaja, H. 1998. Metsänuudistusalojen hakkuutähde energialähteenä. (Logging residues as a source of energy). Metsäntutkimuslaitoksen tiedonantoja. 684. 68 pp. ISBN 951-40-1624-6. (In Finnish.)
[8] Heinonen, J. 1994. Koealojen puu- ja puustotunnusten laskentaohjelma KPL: käyttöohje. (Calculation program for tree and stand characteristics: Instructions). Metsäntutkimuslaitoksen tiedonantoja. 504. 80 pp. ISBN 951-40-1369-7. (In Finnish.)
[9] Liu, C. J. and R. Brantigan. 1995. Using differential GPS for forest traverse surveys. Can. J. For. Res. 25: 1795-1805.
[10] Kärkkäinen, M. 1985. Puutiede. (Wood science). Sallisen Kustannus, Sotkamo. 415 pp. ISBN 951-99628-2-4. (In Finnish.)
[11] Laasasenaho, J. 1982. Taper curve and volume functions for pine, spruce and birch. Communicationes instituti forestalis Fenniae 108. 74 pp. ISBN 951-40-0589-9.
[12] Marklund, L. 1988. Biomass functions for pine, spruce and birch in Sweden. The Swedish University for Agricultural Sciences, Department of Forest Survey. Report 45. 73 pp. ISBN 91-576-3524-2. (In Swedish with English summary.)
[13] Niemistö, P. 1995. Influence of Initial Spacing and Row-to-Row Distance on the Crown and Branch Properties and Taper of Silver Birch (Betula pendula). Scand. J. For. Res. 10: 235-244.
[14] Petersson H. 1997. Functions for Predicting Crown Height of Pinus sylvestris and Picea abies in Sweden. Scand. J. For. Res. 12: 179-188.
[15] Saramäki, J. and Silander, P. 1982. Lannoituksen ja harvennuksen vaikutus männyn latvukseen. (The effect of fertilization and thinning on the crown properties of crown of Scots pine). Metsäntutkimuslaitoksen tiedonantoja 52. 42 pp. ISSN 0358-4283. (In Finnish.)
[16] Shinozaki, K., Yoda, K., Hozumi, K. and Kira, T. 1964. A quantitative analysis of plant form. The pipe model theory I. Basic analysis. Jap. J. Ecol. 14:97-105.