
Display large image of Figure 1
Vol. 13 No. 2 July 2002
Raffaele Spinelli
University College Dublin
Ireland
Bruce R. Hartsough
University of California
Davis, CA, USA
Philip M. O. Owende
University College Dublin
Ireland
Shane M. Ward
University College Dublin
Ireland
The authors are Graduate Student; Professor, Biological and Agricultural Engineering; Senior Research Fellow, and Professor, Agricultural and Food Engineering.
ABSTRACT
The performance of alternative equipment for the whole-tree harvesting of eucalypt stands was evaluated, using data from five different commercial operations. The study covered three machines for felling and bunching, two for extraction (skidding), and two for combined delimbing, debarking and chipping. Productivity and operating cost models were evaluated for each of the machines, in order to estimate the net harvesting costs under varying forest stand and site conditions.
It was found that under easy terrain conditions (flat terrain, dry ground), trees should be felled by three-wheeled feller-bunchers and extracted by front-end loaders, as this combination had the lowest harvesting costs. Due to mobility limitations, this equipment may have to be replaced by tracked feller-bunchers and conventional skidders in steep terrain and/or soft ground
It was estimated that the cost of using the wheeled feller-buncher and the front-end loader system ranged between 16-22$ per oven-dry-ton (odt), depending on tree size. If difficult terrain imposes a shift towards the second, more expensive combination, harvesting cost will increase by about 30% and may exceed 25 $/odt for an average tree weight less than 0.1 odt. Unit costs are inflated by 30% if the hog fuel is considered a by-product and the harvesting cost is charged entirely on the clean chip.
Keywords: Eucalyptus, Whole-tree Harvesting, Biomass, Feller-buncher, Chipper, Skidder, Front-end loader, productivity, short-rotation, California.
INTRODUCTION
Fast-growing forest plantations are becoming more important in world forestry. They are established for different purposes (viz. wood fuel and fibre production, and soil protection) and often result in large concentrations of wood resources that can be exploited profitably. Currently, the market prospects for products from plantation forests seem very promising, due to reduced output from natural forests. Consequently, many forest products companies are establishing large clonal and/or seedling plantations of fast-growing tree species such as poplar and eucalypt.
Commercial eucalypt plantations already cover at least 7 million hectares worldwide [15] . Fast-growing eucalypt stands currently supply 10 million cubic metres of wood per annum to pulp factories in Southern Europe [4] . Forest products companies have also established vast eucalypt plantations all over South America. Elsewhere, large afforestation projects have been initiated with the objectives of minimising soil erosion and of creating employment in rural areas. For example, such projects have generated over 70,000 ha of eucalypt plantations in Italy [2] . Such stands may yield wood fibre at a competitive cost if the harvesting operations are optimised. Harvesting cost is estimated to be above 50 % of the total cost of wood-fibre produced from plantation forests [14] , which underscores the need for optimisation of related harvesting operations.
Whereas cut-to-length (CTL) harvesting is popular in Europe [13] , commercial Whole-tree harvesting (WTH) is common in North America, where large eucalypt plantations were established is the 1980s. WTH is characterized by the handling of whole trees, with top and branches but without the root system. The trees are felled, bunched and forwarded to landing-based large processing machines, which carry out the delimbing-debarking-chipping (DDC) of felled trees. The WTH concept is based on mass handling, which compensates for the small tree size and enables cost-effective harvesting of such stands. Trees are bunched after felling to enhance the efficiency of subsequent handling. The variability of forest stand and site conditions demands different harvesting techniques suited to each site.
This study evaluated the performance of mechanised systems for WTH, in order to identify the key variables that determine machine productivity and operating costs. In the future, combining this information with the results from comparable CTL studies [16] may provide the decision support system needed for selecting the machines and the harvesting method that is best suited to the harvesting regimes and the inherent stand characteristics of a given plantation. In addition, such decision support system may enable the preparation of reliable wood production forecasts and machine schedules.
MATERIALS AND METHODS
Description of the study sites and harvesting machines
The study was carried out at the Action Tree Farm in Corning, California (USA). The Farm consists of a eucalypt plantation of 4,000 ha, divided into several blocks of equal size, and harvested in 7 to 8 year rotations.
The experiments were located at 5 different sites (Table 1) and each was selected for a unique aspect of the WTH technique. The harvesting machines studied included three feller-bunchers, two skidders, and two delimbing-debarking-chipping (DDC) units (Table 2).
The five forest sites comprised of Eucalyptus camaldulensis and Eucalyptus viminalis plantations, of ages varying between 7 and 10 years. Many trees in the oldest stands were multi-stemmed because of a severe freeze when these stands were 18 months old [6] . Therefore, the estimated stem density was greater than the 1,540 trees ha-1 (2.1 m by 3.0 m tree spacing scheme) that were originally planted.
Although the operations differed in the types of machinery deployed, they had similar harvesting regimes: the trees were mechanically felled and bunched, and these were forwarded to the DDC by either a skidder or a front-end loader. Chips for pulp production were deposited directly into chip trucks.
Table 1. Descriptions of the clearcut harvesting sites.
|
|
|||||
| Inventory of Harvest | Site | ||||
|
|
|||||
| 1 | 2 | 3 | 4 | 5 | |
|
|
|||||
| Age | 9 | 10 | 10 | 7 | 8 |
| Stand density (stems/ha) | 2540 | 2610 | 2390 | 2110 | 2630 |
| Average tree weight (green kg)* | 145 (4-377) | 110 (7-360) | 86 (8-298) | 157 (8-270) | 104 (20-223) |
| Average slope (%) | 4.0 | 10.0 | 7.5 | 8.5 | 7.0 |
| Terrain description | Even, firm | Even, firm | Even, firm | Even, firm | Even, firm |
|
|
|||||
Table 2. Specifications of the harvesting, forwarding and processing machines studied.
|
|
|||||||
| Type | Feller-Buncher | Extraction Units | DDC Machines | ||||
|
|
|||||||
| Type | Drive-to-tree | Drive-to-tree | Swing-to-tree | Skidder | Loader | Disc Chipper |
Drum Chipper |
| Configuration | 4-wheeled | 3-wheeled | Tracked | Wheeled | Wheeled | Integral | Joined |
| Weight (kg) | 12400 | 7600 | 27800 | 15000 | 17300 | 40900 | 47200 |
| Power (kW) | 103 | 128 | 193 | 130 | 119 | 588 | 535 |
| Transmission | Hydrostatic | Hydrostatic | Hydrostatic | Powershift | Powershift | Belt | Belt |
| Width (m) | 2.8 | 2.8 | 3.1 | 2.9 | 2.7 | 3.2 | 3.1 |
| Length (m) | 6.8 | 3.3 | 4.7 | 6.9 | 8.1 | 15.8 | 19.7 |
| Height (m) | 3.2 | -- | 3.8 | 2.9 | 3.5 | 4..1 | 3.9 |
| Clearance (mm) | 530 | 600 | 760 | 700 | 450 | -- | -- |
| Attachments | Disc saw | Disc saw | Disc saw | Single-arch | Log-fork | 7.6 m loader | 6.9 m loader |
|
|
|||||||
The machines
The three feller-bunchers in the study were of different conceptual design (Table 2). Two drive-to-tree feller bunchers were used, one built on an articulated four-wheel prime mover and the other based on a three-wheeled chassis. The latter was a compact machine, with pivot steering for better manoeuvrability but, due to having only two powered wheels, it had limited terrain capability. The third feller-buncher was a swing-to-tree unit built on a tracked self-levelling base. It had the best terrain capability and the operator claimed that it could harvest on steep hillsides with gradients up to 50 %. The feller-bunchers worked on parallel 4- to 6-row harvesting strips.
A grapple skidder and a front-end loader were used in the forwarding operation. At each landing, the forwarded trees were unloaded in front of the DDC unit and within the range of its integral knuckle-boom loader. The DDC units used in the study consisted of a combination of chain flail and chipper: whole trees were fed to the chipper via the flail system, consisting of chains attached to drums that rotated at 350-580 revolutions/minute. The chains impacted on the trees and effectively removed the leaves, branches and bark, to produce pulp chips with bark content below 3%. Two different DDC units were evaluated: an integral machine that contained both the flail module and a disc chipper and a combination of two separate machines – a flail and a drum chipper – mounted on independent trailers and joined for the purpose. Both units had heavy-duty integral loaders (Table 2).
Both DDC machines were stationed at landings, with adequate turning area for the chip transportation trucks. One operator kept a spare trailer that was used as a surge container. Residue from the DDC process was piled at the landing and refined into hog fuel with a shredder, after the machines had moved out of their respective sites. Experienced personnel (all had >3 years work experience) operated the machines studied.
Data collection routine
The data collection procedure consisted of a set of time-motion studies. Cycle times for each machine were split into time elements, considered to be typical of the functional process analysed. This was done with the intent of isolating those parts of a routine that are dependent on one or more external factors (viz. tree size, percent of leaning trees, and travel distance), in order to enhance the accuracy of the productivity models. All time elements and the related time-motion data were recorded with Husky Hunter® hand-held field computers running Siwork3® time-study software [9] .
For the feller-bunchers, the diameter at breast height (DBH) of all trees in the rows to be harvested was measured. Trees with a DBH equal to or above 75 mm were attributed to one of six 50 mm DBH class, whose identifying number was spray-painted on the stem itself. Random sub-samples of heights by diameter class were also measured. The DBH of all trees felled during each cycle were then entered into the Siwork3® forms, together with their respective time elements. The DBH of trees smaller than 75 mm was estimated using marker stripes of known length applied to visible points on the felling head. A diameter-to-height relationship was derived for each stand, enabling the use of double-entry tariff tables. Tree volumes were inflated by a factor 1.3 to account for bark, branches and tops, since the tariff tables only accounted for stem volume under bark, to a minimum diameter of 25 mm. The factor of 1.3 had been established in a previous study on the same plantation [7] . Total tree weights were calculated by considering a density factor of 0.51 odt/m3, which had been established from long-term yield data of the plantation. Direct observation indicated the production of 3 loads of hog fuel for every 10 loads of wood chips. For each machine, observations were made for a total harvest of approximately 100 odt (minimum).
For the forwarders, the total stems collected in each cycle were counted. The daily chip output was obtained by weighing the chip load produced during each day of observation. Total tree weight was estimated by dividing the daily chip output by the daily tree count, and inflating this figure by a factor of 1.3 to account for the limbs and the bark. Moisture content of the chips was measured for each load at the receiving plant, and was estimated at 45% on a wet-basis. The extraction distances covered by the forwarding units were measured by pre-marking all paths at approximately 15 m intervals and recording the number of marks passed by the machine during each trip. The maximum slope of each path was measured using a clinometer.
RESULTS AND DISCUSSION
The time-motion data collected were analysed in order to establish the significance of selected independent variables to discrete machine process cycle times. Linear multiple regression and correlation analyses were used to express the machine process time expenditures as functions of only the most significant independent variables. The terms in the established relationships were tested for significance at p<0.01. Machine productivity is reported both as Productive Machine Hours excluding delays (PMH0), and Scheduled Machine Hours (SMH). The latter was obtained by dividing PMH by 0.75 for the chippers and 0.70 for the other machines. The coefficient of 0.70 is slightly higher than normal for analysis of forestry machine operations [3] , but was adopted to reflect the better work conditions offered by SRWC – namely easy terrain, optimum plantation layout and rational size of planted blocks. These are expected to result in higher machine utilisation rates.
Machine operating costs were evaluated in order to compare the cost-effectiveness of the alternative systems. The machine prices as at June 2000 and cost assumptions for similar machines [10] were adopted. The characteristic variation of machine productivity and operation costs with tree size (feller-bunching) and extraction distance (forwarders), were evaluated to compare the cost of two alternative WTH systems.
Felling and bunching
The summary of the time-motion study data and the derived time expenditure models for the recorded machine functions are presented in Table 3 and Table 4, respectively. In Table 3, it is shown that machine production rates ranged between 140 to 280 trees/PMH0 (10 to 14 odt/PMH0). From Table 4, it may be deduced that the main factors affecting the cycle times in tree felling and bunching are the total number of trees felled during each cycle and the proportion of fallen and leaning trees among them.
The effects of terrain factors (slope and terrain roughness) were insignificant, because the ground had adequate bearing capacity, was even and generally flat, with a maximum slope gradient within 20 %. However, it is reasonable that on poor terrain, the performance of drive-to-tree harvesters (four-wheel and three- wheel) will be affected, while the swing-to-tree self-levelling machines are likely to give sustained productivity. Extended operational capability may moderate the higher cost of operating such machines.
Table 3. Summary of time-motion data for feller-bunchers.
|
|
|||
| Observations | Stand 1 | Stand 2 | Stand 3 |
|
|
|||
| Machine | Drive-to-tree 4-wheeled |
Drive-to-tree 3-wheeled |
Swing-to-tree tracked |
|
|
|||
| Study duration in days | 2 | 2 | 2 |
| Total duration of valid observations, hours | 10.4 | 7.9 | 8.0 |
| Number of valid observations | 364 | 648 | 1087 |
| Number of trees harvested | 1492 | 2009 | 2283 |
| Total material harvested, odt | 110.4 | 112.5 | 100.5 |
| Time elements, cmin. (SD) | |||
| Move to fell | 41.5 (16.6) | 17.5 ( 7.9) | 7.1 ( 7.8) |
| Position | 0.0 ( 0.0) | 0.0 ( 0.0) | 16.2 (10.8) |
| Fell | 85.4 (38.3) | 35.7 (19.2) | 3.6 ( 2.2) |
| Move- / Swing-to-dump | 31.1 (14.3) | 11.4 ( 5.6) | 7.3 ( 3.3) |
| Dump | 6.0 ( 2.1) | 4.5 ( 1.8) | 3.8 ( 1.7) |
| Other | 7.8 (27.7) | 4.5 (12.2) | 6.3 (12.5) |
| Total | 171.8 | 73.6 | 44.3 |
| Average trees per cycle | 4.1 | 3.1 | 2.1 |
| Proportion of fallen/leaning trees, % | 20.2 | 33.8 | 21.4 |
| Average tree weight, odt | 0.074 | 0.056 | 0.044 |
| Trees/PMH0 | 143.2 | 252.7 | 284.4 |
| Trees/SMH | 100.2 | 176.9 | 199.1 |
| odt/PMH0 | 10.6 | 14.2 | 12.5 |
| odt/SMH | 7.4 | 9.9 | 8.8 |
| $/ PMH0 | 80.69 | 76.88 | 134.73 |
| $/odt | 7.6 | 5.4 | 10.8 |
|
|
|||
The significant (p < 0.01) relationships for the process times of the feller-bunchers studied are presented in Table 4. Duration of the functional processes and the stem volume inside bark are used to evaluate machine productivity. It is shown that only the duration associated with tree felling may be accounted for by independent variables such as the number of trees handled per cycle (T) and the proportion of leaning and fallen trees (d). Process time is longer when handling more than one tree or a fallen tree, but if the accumulation contains both, time expenditure will grow beyond the simple sum of their single effects. That is to say that one of the two independent variables – (d) in this case – works as a complicating factor, following a pattern already remarked when applying statistics to operational forestry [1] .
Table 4. Significant time expenditure models for the feller-buncher studied (p < 0.001).
|
|
||
| Process time elements by respective harvester type |
Regression models, centi-minutes |
R2 |
|
|
||
| Drive-to-tree, 4-wheeled | ||
| Move to fell | 41.50 | - |
| Position | - | - |
| Fell | 5.08 + 16.44 T + 0.17 T × d | 0.52 |
| Move/swing to dump | 31.10 | - |
| Dump | 6.00 | - |
| Other | 7.84 | - |
| Trees/Total volume (m3) | ||
| for Vol < Vtrans | 5.04 - 7.94 V | - |
| for Vol ³ Vtrans | 1 | |
| Vtrans | 0.64 | |
| Drive-to-tree, 3-wheeled | ||
| Move to fell | 17.50 | - |
| Position | - | - |
| Fell | 2.38 + 8.90 T + 0.07 T × d | 0.60 |
| Move/swing to dump | 11.40 | - |
| Dump | 4.50 | - |
| Other | 4.50 | |
| Trees/Total volume (m3) for | ||
| Vol < Vtrans | 4.35 +25.54 V2 - 18.59 V | 0.25 |
| For Vol ³ Vtrans | 1 | |
| Vtrans | 0.33 | |
| Swing-to-tree, tracked | ||
| Move to fell | 7.08 | - |
| Position | 0.60 + 5.64 T + 0.06 T × d + 13.73 V × T | 0.39 |
| Fell | 0.43 + 1.13 T + 0.004 T × d + 4.73 V × T | 0.39 |
| Move/swing to dump | 7.30 | - |
| Dump | 3.80 | - |
| Other | 6.35 | - |
| Trees/Total volume (m3) | ||
| for Vol < Vtrans | 2.50 - 5.93 V | - |
| for Vol ³ Vtrans | 1 | |
| Vtrans | 0.42 | |
|
|
||
T = number of trees per cycle (accumulation)
d = % of down or heavily leaning trees
V = Average tree volume under bark (delimbed and topped at 2.5 cm), m3
Vtrans = tree volume at which only a single stem can be can be handled by the
accumulator head m3
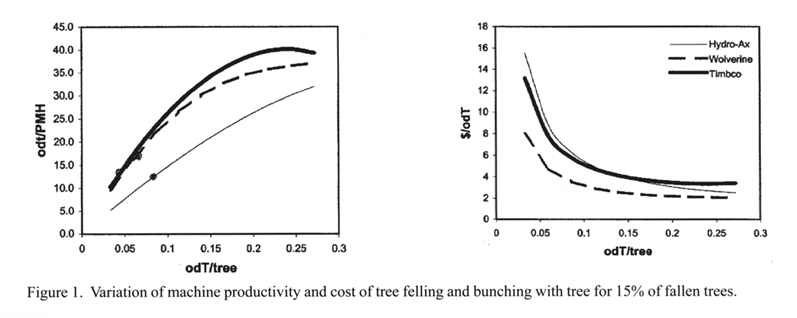
These relationships were used to evaluate the individual process times per cycle and the number of trees handled in each cycle. Only the time-expenditure relationships with a significant R2 (i.e. > 0.39) were used, whereas the other time elements were treated as constants. Machine productivity and production costs were calculated from the processing time, the number of trees processed, the tree size and the machine operating costs. Figure 1 depicts their respective variations with tree size for an assumed proportion of fallen and leaning trees equal to 15 %. As seen in Figure 1, machine productivity generally increased at reducing rates with tree size, while the unit cost decreased exponentially. This is in agreement with existing literature [5, 8 ,14, 15] .
Display large image of Figure 1
The accumulated volume of trees felled within a single cycle decreased with increasing tree size, which reflects the inherent physical limitations of accumulating felling heads. The corresponding variations for the 4-wheeled drive-to-tree feller-buncher are smoother because the wide accumulation pouch of the felling head (0.31 m2),and the stable base of the prime mover allowed the operator to harvest multiple trees over the entire range (0-0.30
The equations in Table 4 also show that handling of increasing numbers of fallen and leaning trees impeded the productivity of all the felling machines, with a highest influence on the 4-wheeled drive-to-tree feller-buncher. This may have been due to its lower agility, hence, more time was required where tree position necessitated extra manoeuvres.
In the absence of terrain constraints, the 3-wheeled drive-to-tree feller-buncher offered the best combination in productivity and operating cost (9.9 odt/SMH for 53.8 $/SMH). However, the self-levelling swing-to-tree feller-buncher may be preferred for rougher terrain as it has the same felling cost as the 4-wheeled drive-to-tree unit, but with the superior terrain capability offered by its tracked, self-levelling base.
The felling head of the 4-wheeled drive-to-tree feller-buncher could only work in a plane determined by the alignment of the base-machine and could not be adjusted for the prevailing micro-relief. Field observations indicated that this machine would leave higher stumps than the others. The 3-wheeled drive-to-tree feller-buncher had more manoeuvrability, while the head on the swing-to-tree machine had a lateral tilting capability, which allowed for re-alignment with respect to the orientation of the stem and the terrain.
Extraction performance
Results of the tree extraction time-motion study are presented in Table 5. Although the loader takes more time for essentially every extraction element, it is evident that its productivity is greater than the skidder by approximately two-thirds because of the larger payload ( 3.5 odt vs 1.5 odt). Productivity for the skidder and the loader averaged 22 and 37 odt/PMH0, respectively. A purpose built skidder is designed for rapid extraction, hence, it manages higher average travel speeds (30 to 40% faster than the loader) on both the empty and loaded components of the extraction cycle.
Effects of the key factors associated with productivity in forwarding operations (viz. travel distance, payload and number of bunches handled) were tested in a multiple linear regression and correlation of the extraction time elements (Table 6). It is evident that travel time is closely correlated to the distance covered, and also to the payload, in the case of the loaded part of the trip. Obviously, loading time (grab) is significantly influenced by the load size, with the larger loads taking more time to assemble.
Table 5. Summary of time-motion observations for the forwarding machines.
|
|
||
| Observations | Stand 4 | Stand 5 |
|
|
||
| Machine type | Skidder | Front-end Loader |
|
|
||
| Study duration, days | 2 | 2 |
| Total duration of valid observations, hours | 10.6 | 15.7 |
| Number of valid observations | 154 | 105 |
| Number of trees harvested | 1316 | 3212 |
| Total material harvested, odt | 276.9 | 449.0 |
| Time elements, cmin (SD) | ||
| Travel empty | 110.2 (23.6) | 121.7 (49.7) |
| Manoeuvre to load | 35.3 (19.2) | 65.8 (45.2) |
| Grab | 54.9 (38.5) | 115.8 (52.9) |
| Move while loading | 19.9 (30.7) | 69.5 (49.8) |
| Travel loaded | 159.7 (43.3) | 170.0 (66.8) |
| Unload | 24.8 (10.9) | 24.1 (10.8) |
| Total | 404.8 | 566.9 |
| Extraction distance, m | 251 | 201 |
| Average tree weight, odt | .087 | .058 |
| Trees per cycle | 17.1 | 61.2 |
| Tree bunches per cycle | 1.34 | 5.75 |
| Material per cycle, odt | 1.49 | 3.54 |
| Trees/ PMH0 | 253.4 | 647.7 |
| Trees/SMH | 177.4 | 453.4 |
| odt/ PMH0 | 22.0 | 37.5 |
| odt/SMH | 15.4 | 26.2 |
| Operating cost, $/ PMH0 | 89.0 | 97.6 |
| Wood extraction cost, $/odt | 4.0 | 2.6 |
|
|
||
Table 6. Significant time expenditure models for the forwarding machines used in the study (p< 0.001).
|
|
||||
| Time element | Predicted extraction process times by machine type (cmin) | |||
|
|
||||
| Skidder | Front-end loader | |||
|
|
||||
| Regression model | R2 | Regression model | R2 | |
|
|
||||
| Travel Empty | 35.5 + 0.299 D | 0.74 | 26.4 + 0.472 D | 0.76 |
| Manoeuvre | 35.3 | - | 65.8 | - |
| Grab | 45.6 B + 24.9 W - 43.3 | 0.50 | 41.8 + 12.4 B | 0.32 |
| Move | 30.4 B - 21.0 | 0.31 | 29.4 W - 34.5 | 0.25 |
| Travel Loaded | 24.0 + 0.436 D + 0.068 (D × W) | 0.77 | 11.1 + 0.604 D + 10.5 W | 0.79 |
| Unload | 24.8 | - | 24.1 | |
| Landing work | - | - | 328.4 | - |
|
|
||||
D = one-way distance, m
B = tree bunches per extraction cycle
W = average amount
of wood extracted per cycle, odt
The regression models highlight the different extraction modes of skidders and front-end loaders. The higher speed of the skidder is reflected in both the unloaded and loaded links of the forwarding cycle. The front-end loader is slower and the unloaded travel time increases more sharply with extraction distance. However, it encounters no drag -unlike the skidder - and the payload affects the return travel time as a fixed time increment per ton. This may be due to the need to find the correct lift height for each load, which takes longer for larger loads. Larger loads must have higher ground clearance to prevent dragging, but a higher lift compromised the machine stability, and especially for the heavier loads. This explains why the time required to adjust the height increased with load size. This effect may also have been compounded by the need for increased caution, which forced the operator to drive slowly at the beginning of the trip until the dynamic stability was attained.
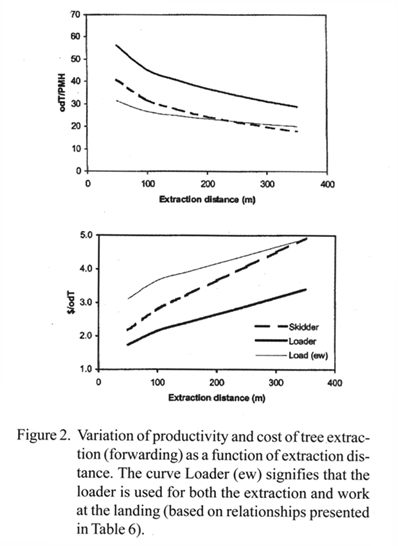
For both the forwarding machines, loading times were significantly correlated to the number of bunches and/or to the load weight. Using the observed averages for load weight and bunches per turn for each machine, the cycle time and productivity of the forwarders was evaluated as a function of extraction distance (Figure 2). It is shown that the productivity of the loader (30-55 odt/PMH0) exceeded that of the skidder (20-40 odt/PMH0) over the entire range (0-400 m) of distances covered. In normal circumstances, such capacity may be used to minimise the number of landings and possibly roading requirements by using the maximum extraction distance. Also, the loader is better suited to perform other work at the landing, e.g., gathering of tree debris. Coupled with the higher extraction rate, it is appropriate for sites requiring multi-task machines such as confined and narrow landings. Ordinarily, a second machine is required to remove the processing residue from under the chipper discharge outlet and to keep the landing clean when a purpose-built skidder is used for extraction. The time expenditure by the loader for work at the landing was recorded separately, so that its contribution to the total cycle time could be included in the model as a fixed additional element.
The loader also results in less contamination of the loads with soil, since trees are carried rather than dragged. On the other hand, the main advantage of the skidder is its superior terrain capability, which allows for operation on steep or soft ground. It could therefore be argued that where the terrain allows, the loader is a better choice because it can be used for both forwarding and work at landing. Contractors who operate primarily in SRWC plantations on dry and gentle terrain should opt for the loader. The skidder seems to be more robust and it has a wider range of operational capabilities.
Performance of DDC machines
Results of time-motion studies of the two DDC machines considered are presented in Table 7. The results are reported as average values for the short rotation eucalypt trees. The average chip processing rates for the two machines were 17 and 22 odt of total biomass/PMH0 at an estimated cost of 14 and 10 $/odt, respectively.
Productivity of the flail and drum chipper combination was higher than that of the integral unit with disc chipper by about 30%, even though the former was processing considerably smaller stems. However, the drum chipper had a large infeed opening that made it easier to feed the crooked stems conveyed out of the flail. With the integral unit, crooked tree butts often jammed into the chipper infeed opening and had to be retrieved.
Since the wood chips were discharged directly into the transportation trucks, the study excluded the truck waiting-time, hence, the productivity figures represent the net capacity of the chipping machines. In some operations, chipper waiting time is avoided by dumping the chips onto the ground and loading the transportation trucks with front-end loaders or conveyors: no studies are yet available on the profitability of this strategy. Due to the bulk handling of stems, the observations could not account for the effects of stem size and form on productivity of the DDC systems.
In order to demonstrate the potential use of the model, two alternative harvesting systems were simulated for easy (slope ≤ #10 %, dry) and difficult terrain conditions (slope up to 30 %, wet). The results are depicted in Figure 3. For easy terrain, felling was done with the 3-wheeled drive-to-tree feller-buncher, and forwarding with the front-end loader. The front-end loader also carried out the cleaning operation at the landing. For difficult terrain, the swing-to-tree tracked feller-buncher and the skidder were used. The combination DDC system was assigned to both cases. When extraction was by a skidder, the cost of a second skidder was added to that of the chipper to account for work required at the landing – as observed in actual operations. An average extraction distance of 200 m and an average proportion of fallen trees of 15% were assumed in all cases.
In Figure 3, it is shown that for easy terrain conditions, the harvesting cost charged to the total biomass (chips and hog fuel) may vary between 17 and 22 $/odt, depending on tree size, and exceeds 25 $/odt if average tree size drops much below 0.05 odt. Effect of terrain may increase these values by about 30% (5 to 7 $/odt) if it forces the loggers to use the more expensive system, based on the tracked feller-buncher and the skidder. However, if the total harvesting cost is charged exclusively on the more valuable clean wood chips, these figures should be increased by 30% to account for the material recovery ratio (chips to whole tree) of 0.77.
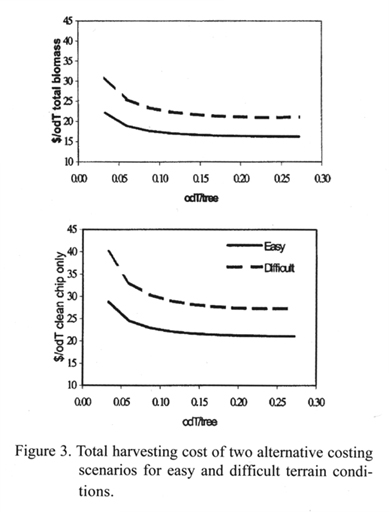
Table 7. Summary of time-motion study observations for the DDC machines.
|
|
||
| Observations by stand and DDC machine type | Stand 4 | Stand 5 |
|
|
||
| Integral unit | Combination unit | |
|
|
||
| Observation period, days | 2 | 3 |
| Productive time, h | 11.3 | 16.2 |
| Number of observations | 13 | 23 |
| Chips produced, odt | 158.7 | 277.5 |
| Average tree weight, odt clean chips | .067 | .043 |
| Average tree weight, odt total | .087 | .056 |
| Total throughput, odt/PMH0 | 17.3 | 22.4 |
| Total throughput (odt/SMH) | 13.0 | 16.8 |
| Clean chip throughput, odt/ PMH0 | 13.3 | 17.2 |
| Clean chip throughput, odt/SMH | 10.0 | 12.9 |
| DDC machine cost, $/PMH0 | 241.4 | 224.0 |
| Total biomass cost, $/odt | 14.0 | 10.0 |
|
|
||
CONCLUSIONS
The independent variables for time expenditure of the feller-bunchers and the forwarding units were average tree size, percent of fallen trees and extraction distance.
Where terrain is not a limiting factor, harvesting should be done with three-wheeled feller-bunchers and front-end loaders (for combined forwarding and work at landing), as this combination offers the lowest harvesting costs for tree sizes (weight) of up to 0.30 odt, and a maximum extraction distance of 400 m. However, such equipment would have limited mobility in steep (gradient > 20 %) or soft ground, in which case tracked feller-bunchers and conventional skidders may be more appropriate.
The average chip processing rates for the DDC machines were between 17 and 22 odt of total biomass/PMH0 at an estimated cost of 14 and 10 $/odt, respectively. The machine with a larger chipper infeed opening could out produce the chipper with a small infeed opening by 30 %. This was caused by the tendency of trees from coppice stands to have crooked butts that are more likely to jam the chipper infeed opening if this is not wide enough.
It was found that the harvesting cost with a three-wheeled feller-buncher and front-end loader ranged between 17-22 $/odt, for tree sizes in the range of 0.03 and 0.27 odt/tree. Where terrain gradient is a limiting factor and the tracked feller-buncher and wheeled skidder combination is used, the harvesting cost will increase by about 30 % and may exceed 25 $/odt if average tree weight drops much below 0.05 odt. Also, the costs will increase by about 30% if the hog fuel is the by-product, and the harvesting operation is exclusively for the production of clean chips.
ACKNOWLEDGMENT
The authors wish to thank the following for their assistance: Lyle Dawson (Action Tree Mulch), Dave Cooper (Simpson Fiber Farm), Paul Warner Logging, Van Meter Logging, Violetti Bros. and Tehama Bros.
AUTHOR CONTACT
Raffaele Spinelli can be contacted by e-mail at: spinelli@irl.fi.cnr.it
R.Spinelli is also a Researcher at the National Council for Research – Wood Research Institute, Florence – ITALY.
REFERENCES
[1] Bergstrand, K.G. 1991. Planning and analysis of forestry operation studies. Skogsarbeten Bulletin No. 17. 63 pp.
[2] Boggia, L. 1987. Conclusioni sull'eucalitticoltura nazionale [Remarks on the national eucalyptus growing sector]. Cellulosa e Carta, No.5: 11-17.
[3] Brinker, R.W. Miller, D. Stokes, B.J. Lanford, B.L. 1989. Machine rates for selected forest harvesting machines. Circular 296. Alabama Agric. Exp. Station, Auburn University, 24 pp.
[4] DIEF–Min. Agricultura, 2000. Informação estatìstica : Inventàrio Florestal 3a Revisão [Statistics : Forest Inventory, 3rd Revision]. Lisbon.
[5] Dos Santos S.L., Machado C.C., 1995 - Analise técnico-economica do processamento de madeira de eucalipto em areas planas, utilizando o processador [Techno-economic analysis of the mechanical processing of eucalyptus trees on flat terrain]. Revista Arvore 19(3): 346-357.
[6] Hartsough, B. and Jenkins, B. 1991. Energy and cost accounting for large-scale eucalyptus plantations. California Committee on the Relation of Energy to Agriculture (CREA) Annual Report 1990. Davis, California.
[7] Hartsough, B. R. and Nakamura, G. 1990. Harvesting eucalyptus for fuel chips. California Agriculture 44(1):7-8.
[8] Holtzscher M., Lanford B., 1997 – Tree diameter effects on cost and productivity of cut-to-length systems. For. Prod. J. 47 (3): 25-30.
[9] Kofman, P. 1995. Siwork 3: User Guide. Danish Forest and Landscape Research Institute, Vejle, Denmark. 37 pp.
[10] Miyata,E.S. 1980. Determining fixed and operating costs of logging equipment. U.S. Dept. Ag., For. Serv. North Cent. For. Exp. Sta. Tech. Rep. NC-55. 14 pp.
[11] Molano, J. 1999. Excavators and backhoe loaders as base machines in forest operations: the situation in Spain. In: Proc. of the first meeting of a Concerted Action. Swed. Univ. Ag. Sci. Dept. For. Mgt. and Prod.. Uppsala. Res. Note No.1, 1999: 47-52.
[12] Moiseyev, A. and Ince, P. 2000. Alternative Scenarios on SRWC as a fiber source for pulp. Paper presented at the Third Biennal Conf. "Short-Rotation Woody Crops Operations Working Group". Syracuse, NY – October 10-13, 2000.
[13] Pandey, D. 1995. Corrected forest plantation areas 1995 of certain tropical/subtropical countries – Report of FAO project GCP/INT/628/UK. FAO, Rome.
[14] Spinelli, R. Owende, P. Ward, S. 2002. A model for estimating the productivity and cost of mechanized harvesting-debarking process in fast-growing Eucalyptus globulus plantations. For. Prod. J. 52(1): 67-77.
[15] Visser, R. and Stampfer, K. 2000. Tigercat productivity study. Ind. For. Ops., Virginia Polytech. State Univ. Internal Report. 10 pp.
APPENDIX I – Notations used
Avg. = Average
CTL = Cut-to-Length
cmin. = centiminutes (100th of a minute)
DDC = Delimbing-Debarking-Chipping
odt = Oven-dry ton (metric)
PMH0 = Productive Machine Hours excluding all delays
SD = Standard
Deviation
SMH = Scheduled Machine Hours
SRWC = Short Rotation Woody Crop
APPENDIX II Machine cost calculations
|
|
|||||||
| Costing factor | Feller-bunchers | Skidders | DDC Machines | ||||
|
|
|||||||
|
Drive-to- tree (4-wheeled) |
Drive-to tree (3-wheeled) |
Swing-to tree |
Wheeled skidder |
Wheeled loader |
Disc Chipper |
Drum chipper |
|
|
|
|||||||
| Machine Cost Data: | |||||||
| Purchase Price (P) at June 2000, $ | 150000 | 130000 | 320000 | 175000 | 210000 | 610000 | 560000 |
| Machine Power Rating, kW | 103 | 128 | 191 | 129 | 118 | 589 | 537 |
| Machine life (n), Years | 5 | 5 | 5 | 5 | 5 | 5 | 5 |
| Salvage value (sv), % purchase price | 30 | 30 | 30 | 30 | 30 | 20 | 20 |
| Machine utilization rate (u), % SMH | 70 | 70 | 70 | 70 | 70 | 75 | 75 |
| Repair and maintenance cost (rm), % of depreciation | 90 | 90 | 100 | 90 | 90 | 100 | 100 |
| Interest rate (in), % of average yearly investment (Y) | 8 | 8 | 8 | 8 | 8 | 8 | 8 |
| Insurance and tax rate (it), % of
average yearly investment (Y) |
7 | 7 | 7 | 7 | 7 | 7 | 7 |
| Fuel consumption rate (fcr), l/kWh | 0.062 | 0.062 | 0.062 | 0.062 | 0.062 | 0.064 | 0.064 |
| Fuel cost (fc), $/l | 0.39 | 0.39 | 0.39 | 0.39 | 0.39 | 0.39 | 0.39 |
| Oil and lubrication cost (lo), % of fc | 37 | 37 | 37 | 37 | 37 | 37 | 37 |
| Operator wage (w), $/SMH | 24 | 24 | 24 | 24 | 24 | 24 | 24 |
| Scheduled machine hours (SMH), hours/year | 2000 | 2000 | 2000 | 2000 | 2000 | 2000 | 2000 |
| Salvage value (S), $ | 45000 | 39000 | 96000 | 52500 | 63000 | 122000 | 112000 |
| Annual depreciation (D) in $/year, D = [(P-S)/n] | 21000 | 18200 | 44800 | 24500 | 29400 | 97600 | 89600 |
| Average yearly investment (Y) in
$/year, Y = [(((P-S)*(n+1))/2n)+S] |
108000 | 93600 | 230400 | 126000 | 151200 | 414800 | 380800 |
| Productive Machine Hours (PMH) in
hours/year, PMH = (SMH × u) |
1400 | 1400 | 1400 | 1400 | 1400 | 1500 | 1500 |
| Ownership costs: | |||||||
| Interest on capital (I) in $/year, I= (in × Y) | 8640 | 7488 | 18432 | 10080 | 12096 | 33184 | 30464 |
| Insurance and tax cost (IT) in $/year , IT = (it × Y) | 7560 | 6552 | 16128 | 8820 | 10584 | 29036 | 26656 |
| Annual ownership cost (F) in $/year), F = (D + I + IT) | 37200 | 32240 | 79360 | 43400 | 52080 | 159820 | 146720 |
| Ownership cost per SMH (Os) in $, Op = (F/SMH) | 18.60 | 16.12 | 39.68 | 21.70 | 26.04 | 79.91 | 73.36 |
| Ownership cost per PMH (Op) in $, Op = (F/PMH) | 26.57 | 23.03 | 56.69 | 31.00 | 37.20 | 106.55 | 97.81 |
| Operating costs: | |||||||
| Fuel cost (Fu) in $/PMH, Fu = (kW × fcr × fc) | 4.62 | 5.74 | 8.58 | 5.78 | 5.28 | 27.60 | 25.19 |
| Lube cost (L) in $/PMH, L = (Fu × lo) | 1.71 | 2.12 | 3.17 | 2.14 | 1.95 | 10.21 | 9.32 |
| Repair and maintenance cost (RM) in
$/ph), RM = (D × rm/PMH) |
13.50 | 11.70 | 32.00 | 15.75 | 18.90 | 65.07 | 59.73 |
| Operator cost per PMH (Opc) in $/ph, Opc = (W/u) | 34.29 | 34.29 | 34.29 | 34.29 | 34.29 | 32.00 | 32.00 |
| Machine operating cost per PMH (Vp)
in
$/ph, V = (Fu + L+ RM+ Opc) |
54.12 | 53.85 | 78.04 | 57.95 | 60.42 | 134.88 | 126.24 |
| Machine operating cost per SMH (Vs)
in
$/sh, Vs = (Vp × ut) |
37.88 | 37.70 | 54.63 | 40.56 | 42.29 | 101.16 | 94.68 |
| Total Costs | |||||||
| Total machine cost per SMH in $/SMH = (Os + Vs) | 56.48 | 53.82 | 94.31 | 62.26 | 68.33 | 181.07 | 168.04 |
| Total machine cost per PMH in $/PMH = (Op + Vp) | 80.69 | 76.88 | 134.73 | 88.95 | 97.62 | 241.43 | 224.05 |
|
|
|||||||