Series
Canada GEESE 2.
Visualization of Integrated Marine Geoscience Data for Canadian and Proximal Waters
http://dx.doi.org/10.12789/geocanj.2013.40.0010
SUMMARY
The Geological Survey of Canada has made most of its holdings of marine geoscience data available online with unrestricted access. These holdings constitute the premier collections of geological and geophysical source data for Canadian and proximal waters. Multibeam bathymetric imagery, analog high resolution seismic and sidescan sonar data, seabed photographs, grain size analyses, and radiocarbon dates can be directly downloaded from NRCan’s Geogratis (http://geogratis.cgdi.gc.ca) servers. KML files allow the user to discover and explore these collections, highlighting the building blocks of marine data downloadable from ftp/http servers.
SOMMAIRE
La Commission géologique du Canada a mis en ligne la plupart de ses fonds de données géoscientifiques marines et y donne accès sans restriction. Ces fonds constituent des collections de premier choix de données géologiques et géophysiques de base des eaux canadiennes ou proximales. On peut ainsi télécharger des serveurs Géogratis de RNCan (http://geogratis.cgdi.gc.ca) des données d’imagerie bathymétrique par secteurs, des données analogiques séismiques haute résolution et de levé de sonar à balayage latéral, des photographies du fond marin, des analyses granulométriques, et des datations au radiocarbone. Le format KML des fichiers permet aux utilisateurs d’exploiter facilement le contenu de ces collections, en mettant en relief les données marines de base téléchargeables depuis les serveurs FTP/HTTP.
INTRODUCTION
1 The Geological Survey of Canada (GSC) of Natural Resources Canada (NRCan) has operated wide-ranging, multidisciplinary marine research programs for over 50 years out of its east coast and west coast offices, the Geological Survey of Canada (Atlantic) and the Geological Survey of Canada (Pacific). The geological and geophysical data collected as part of these programs provide the foundational evidence underlying our understanding of the modern and ancient geology and attendant geological processes that define and shape our marine territories. Although most Canadians live and work onshore, the offshore is being increasingly recognized as a significant and fundamental component of a nation’s economy and environment (Interagency Ocean Policy Task Force 2010). Making this marine survey information available for sustainable economic development of our off-shore is a cornerstone of Canadian government policy (Government of Canada 2012a; Government of Canada 2013b).
2 Marine geoscience data are used in a wide variety of applications in the offshore; a non-exhaustive list would include seabed habitat and fish-eries management, communication and power cable route planning and emplacements, military defense applications, search and rescue operations, hydrocarbon exploration and development, national boundary definition and studies of past and present climate change and adaptation.
3 The products of these activities have been, in part, released over the years in a number of summary efforts, e.g. DNAG (Keen et al. 1990) and the East Coast Basin Atlas series (Bell 1989), as well through both peer-reviewed scientific literature and informal communications. However, there is a need to make available the underlying marine geological and geophysical data of these missions for a variety of future and unplanned applications.
4 The most comprehensive, publicly available, online integrated collection of marine geoscience data available for Canadian waters is described herein. These data can be directly downloaded using standard ftp/http protocols. Coverage and content may be perused using a KML (Ballagh et al. 2011) discovery wrapper, i.e. a virtual globe (Bailey and Chen 2011; De Paor and Whitmeyer 2011) interface that displays and points to content in the ftp/http servers (Berners-Lee et al. 1994; Housley and Hoffman 1999). This collection is not static and will be augmented with new data and new data types in the future.
BACKGROUND
5 Fifty years is a long time in science and the ways in which marine survey data are collected and processed have changed radically over this period, accelerating in the last two decades into the digital realm. Although the Internet was a dim glimmer in the early 1990s (Poole et al. 1999), organizing and cataloguing the GSC’s marine survey data into in-house relational databases was well underway by this time. Many years of focused and patient effort by countless staff were spent organizing and transcribing sample and analysis data into in-house Oracle-based relational databases. This process is ongoing, and the GSC’s holdings continue to be augmented using new expedition data and a backlog of older data.
6 The GSC is a relatively large science organization of some eight hundred staff, housed in offices spanning the country. As with many similar institutions, the GSC had, over the past ten years, developed an enterprise solution to data management (Inmon et al. 1997) involving multiple linked database servers with integrated GIS systems. Much effort was spent developing web interfaces to these databases to make them publicly available, but many barriers, both internal and external to the GSC, have arisen to limit access.
7 Linking multiple instances of commercial database systems to the Internet involves substantial licensing fees; consequently, the plan to expose multiple, distributed database servers to the public has become unaffordable in the present fiscal regime. Consolidating and replicating databases in a central and secure public server has also proven extremely difficult and time-consuming. In the GSC, web services and server management have been recently centralized in corporate offices and reductions in staffing levels have further eroded the capacity to manage these relatively complex data management systems.
8 Following the guidelines of Government of Canada’s new Open Data Initiative (Government of Canada 2013b), operating principles of future data releases by the GSC will stress completeness, primacy of source data, ease of access, machine readability, commonly owned data standards and other tenets as articulated by the Sunlight Foundation (Sunlight Foundation 2010; Geiger and von Lucke 2011).
IMPLEMENTATION – A SNAPSHOT APPROACH
9 Given this environment, the GSC has decided to ‘step back’ in complexity and provide public data access using a simpler system that is sustainable within the current context, yet provides easier access than was originally achieved with the previous approach, while adhering and adapting to the new government-wide open data policy. In this simpler approach, in-house databases are maintained, populated and utilized in local offices as usual, but these holdings are programmatically transcribed onto a folder-based file system in simple file formats for public access, disconnecting the in-house source databases from the user. Vendor-specific forms and implementations are avoided in the transcription in keeping with open data principles, albeit at the loss of some functionality. Generic, well-known, open and documented data formats are used to convey database and image information (XML, XLS, PNG, CSV, JPEG2000, shape files, and KML).
10 Those data that fit well into the Open Geospatial Consortium (OGC) Web Service strategies (Scharl 2007; Open Geospatial Consortium 2013) are, and will continue to be, disseminated using these standards. Many GIS map layers and map sheets, for example, are accessible via WMS and will continue to be made available in this way. However, some data do not present well in the OGC framework, so the focus here is on providing informational building blocks to the user, who would download, aggregate and analyze these data objects using their own processing and analysis tools of choice. An attempt is made to minimize in-house efforts while making the data discoverable, available and usable. Freely available virtual globe technologies are leveraged, e.g. Google Earth, for viewing and discovery rather than crafting complicated web interfaces that provide GIS-like functionality.
11 At the most basic public access level, sample-level marine geo-science data can be accessed using ftp or http protocols from NRCan’s open Geogratis Server (Government of Canada 2013c; NRCan Marine Geo-science Data 2013). These servers allow anonymous access and download with an unrestricted distribution license (Government of Canada 2007). Entire directory trees or sub-trees of information can be batch downloaded using a variety of widely available ftp clients or Linux commands such as wget (Free Software Foundation 2012).
12 In-house custom applications have been built that scan these transcribed file systems and generate KML (Ballagh et al. 2011; De Paor and Whit-meyer 2011) files that can be used as discovery interfaces to these data holdings. The KML files are thin-layered in the sense that the data are largely not contained within the KML file itself, other than the location of placemarks or line segments; the entire KML content is derived from and points to the contents of the ftp/http repository. This simple structure allows the entire repository, other than WMS layers, to be copied and used in scientific expeditions without internet access, for use in situations where there is no Internet-based server-client access, greatly reducing complexity.
DATA HOLDINGS
13 In-house relational database holdings are housed in three major components: 1) ED (Expedition Database), in which ship tracks and sample data (grain size, radiocarbon dating information, seabed photos, sample locations and sample type) are housed; 2) PAD (Physical Archive Database), which details the type and location of physical samples (seismic records, piston core samples, etc.); and 3) BASIN (petroleum industry records including well and seismic line information). Some data sets (e.g. sediment grain size and radiocarbon dates) were relatively simple to transcribe into a tabular spreadsheet and graphic form, but other geophysical data, such as seismic and sidescan sonar data which cover thousands of kilometres of track coverage, were more problematic.
14 The GSC has chosen to implement this data release incrementally, guided by a somewhat arbitrary sense of external users’ data requirements. Those datasets already in relational databases were relatively simple to implement, but the largest and most inaccessible data set – the GSC’s analog seismic and sidescan holdings – required the last five years to make ready for digital release. Before this release, users had to visit the east or west coast labs to access the data, and pay large sums for specialized reproduction.
15 The collections described in the following sections can be explored using KML links found on NRCan’s Geogratis server (Government of Canada 2013c; NRCan Marine Geo-science Data 2013). At the time of writing, the web-accessible search interface (Government of Canada 2013c) of this server is in development and it is suggested that the ftp and KML links given in the references be used to access the contents.
Multibeam Bathymetric Data Collection
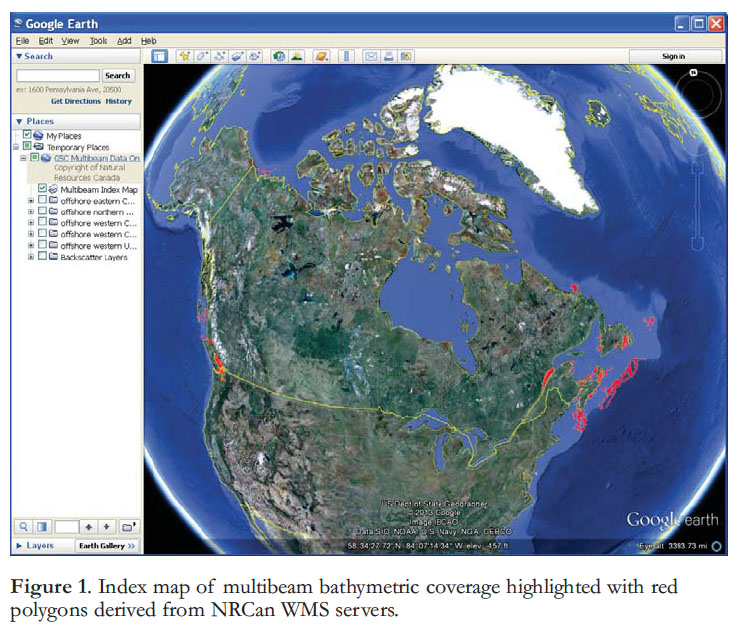
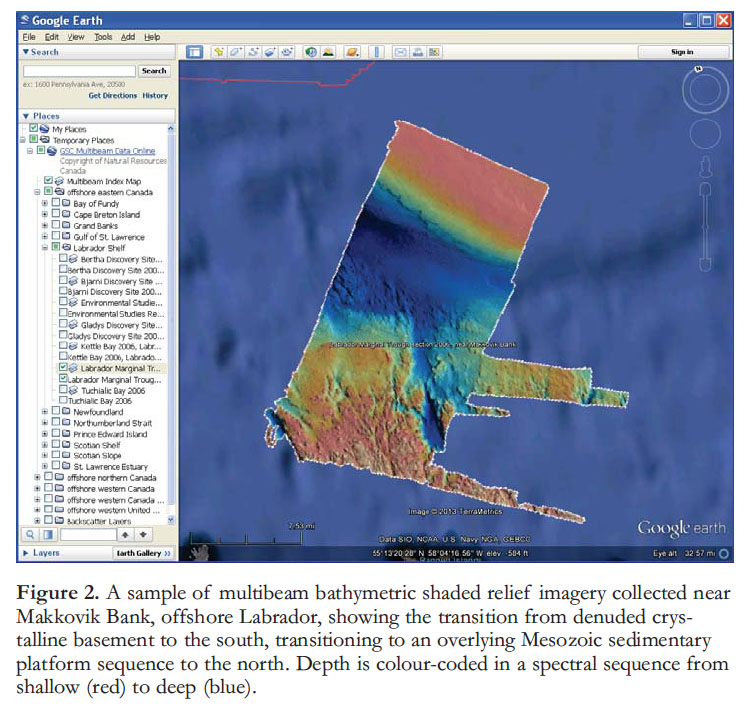
16 The GSC has compiled various datasets of high resolution, complete coverage, marine multibeam bathymetric data (Hughes-Clarke et al. 1996; Courtney and Shaw 2000), comprising survey data collected by NRCan and other partners, and has made over 140 colour-shaded relief bathymetry images of these datasets accessible using WMS services. Point data or individual bathymetric soundings are not available through this application, but may be obtained through the Canadian Hydrographic Service. These images are provided through NRCan’s Geoscience Data Repository WMS server (Government of Canada 2013a). These detailed bathymetric images provide outcrop scale imagery of the seabed; they commonly have a gridded resolution of less than 5 metres in horizontal scale, and vertical scale resolution approaching 5 centimetres. They provide a fundamental contextual backdrop to other high resolution geological data discussed in the following sections.
 Display large image of Figure 1
17 The WMS compilation can be viewed in a virtual globe application using a KML file (Courtney 2013d) found on the Geogratis server. By default, only an index coverage map is selected (Fig. 1). As the user zooms into a chosen study area, the high resolution of the bathymetric mapping is revealed (Fig. 2). To reduce loading on the WMS servers, the user is advised to minimize the number of layers displayed at any give time. This collection will be augmented, as it becomes available, with complementary acoustic backscatter data (Courtney and Shaw 2000), which can be used to deduce the nature of the seabed’s hardness and roughness (Courtney and Shaw 2000; Kostylev et al. 2001).
 Display large image of Figure 2
Analog Seismic and Sidescan Data Collection
18 Single channel, high resolution records of seismic and sidescan data have been collected by the GSC for over 50 years (Verbeek and McGee 1995; McRea, Jr., et al. 1999; Mosher and Simpkin 1999; Parkinson 2002). The seismic records acoustically image the Earth structure of the upper few kilometres below the seabed with varying degrees of resolution, ranging from high frequency (>1 kHz) examples of the uppermost few metres of the sediment column, to lower frequency (50–200 Hz), lower resolution images of the deeper structure. The sidescan sonar records display seabed surface backscatter imagery for a (typically) 150 to 300 m track on each side of the instrument as it is towed near the seabed.
19 Analog seismic and sidescan echograms were traditionally recorded on electrostatic paper rolls that often exceeded 30 m in length and 1/2 m in width; the GSC holds over 15,000 of these hardcopy records in its physical archives. In the past, copies of most of these records were made on micro-fiche, and the initial plan was to scan these films to build a digital archive. However, tests showed that the quality of these scans were poor, so five years ago rescanning of the original records to preserve the finest details in the source data was begun. Each echogram was scanned on a wide format, continuous-feed scanner at 300 dpi with 8 bits of grayscale and converted into a compressed JPEG2000 format (Taubman and Marcellin 2002). Typically, each of these files was from 1 to 2 gigabytes in size before compression, and was compressed by a factor of 10:1. Empirical tests with a number of test scans suggest that minimal visual distortion of the scanned data occurs at this level of compression.
 Display large image of Figure 3
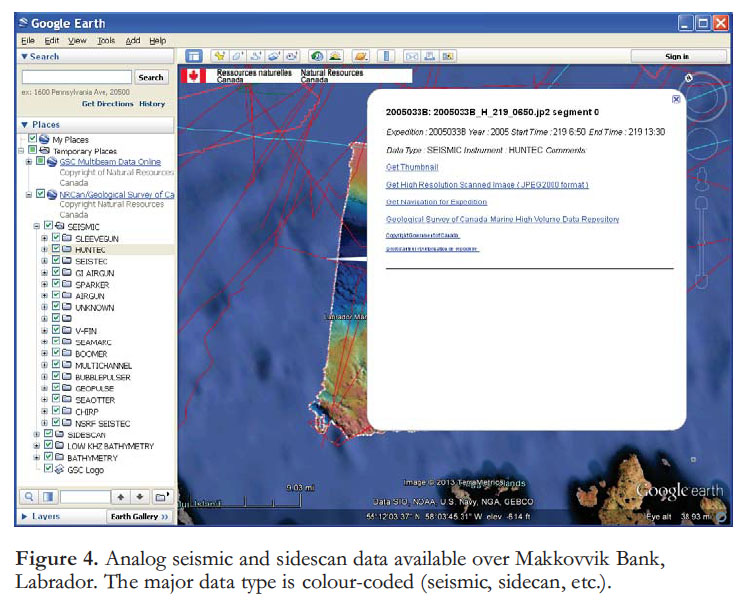
20 Seismic and sidescan scanned holdings are available for unrestricted access online (NRCan Marine Geo-science Data 2013) under the ‘Seismic_Reflection_Scanned’ folder (ftp://ftp2.cits.rncan.gc.ca/pub/geott/MarineGeoscienceData/Seismic_Reflection_Scanned). Subordinate folders contain data collected from distinct oceanographic expeditions. For example, the subfolder named 2005033B contains acoustic data collected as part of GSC expedition 2005033B, located on Makkovik Bank off the coast of Labrador. The scanned data in the folder are documented by an XML file in each directory, which includes meta-data for each high-resolution JPEG2000 image file, the instrument type, start and end times and dates for the sidescan, and latitudinal bounds. A thumbnail in PNG format for each full resolution scan is included here for ease of perusal. Navigation for the expedition is listed in a file called 2005033B_NAD83.csv; it is written in ASCII CSV format, and includes information on year, day, time and position, and the geographic datum denoted by the file suffix. A machine-readable composite master list of all the XML index documents, MasterScannedSectionList.xml, can be found in the base folder of the scanned seismic collection.
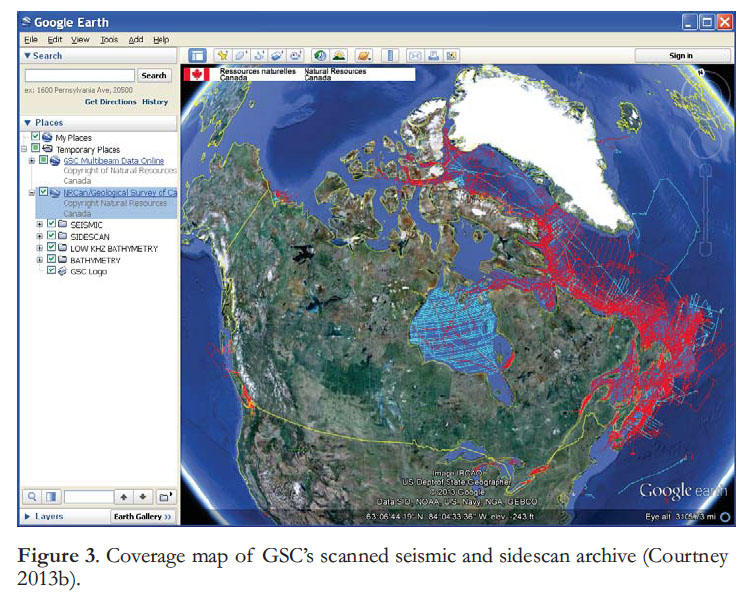
21 Although all these data are available and discoverable to an extent through the ftp/http server, exploring the seismic data within a virtual globe application (Courtney 2013b) makes the archive much more accessible. Figure 3 shows the extent of seismic and sidescan coverage in Canadian waters as displayed in Google Earth. The data type (seismic, sidescan sonar, high and low resolution bottom-penetrating bathymetric data) forms the top-level folders in the KML-specified menu structure, whereas instrument type is used to further subdivide the data at the next level down. Clicking on a line brings up a pop-up balloon containing data summary information and hyper-links for data download (Fig. 4).
 Display large image of Figure 4
22 Since the thumbnail of the scan is in PNG format, this MIME (Multimedia Internet Mail Extension) type should be recognized and displayed by most browsers by default; the same can be said for the navigation data, which is also in CSV format. Care should be taken when downloading the full resolution scan in JPEG2000 format. These files can be large, up to 2 to 3 gigabytes in uncompressed size, and may require special browser plug-ins (Lizardtech 2013) or stand-alone applications to view. The browser, Safari, provides native viewing support for JPEG2000 files for Mac OSX users. It is recommended to save the JPEG2000 download to hard-disk before attempting to view the contents.
 Display large image of Figure 5
23 The pop-up balloon also features a hyperlink (Courtney 2013a) directing the user to a software repository that hosts custom-written applications to manage and register these large images, so that these scanned sections can be efficiently converted into SEG Y (Norris and Faichney 2002) formatted files. These applications are free to download, use and distribute.
Seabed Photo Collection
24 Photographs of the seabed have been collected during GSC marine expeditions for over 50 years. Typically, a sequence of 10 to 20 photographs was taken at a sampling station as the vessel drifted with prevailing winds and currents and the camera was repeatedly lowered to and raised from the seafloor. The resulting suite of photographs may best be considered a representative ensemble from the proximal area. Only in more recent expeditions, in which differential GPS and ultra-short baseline positioning were used in camera placement, is the relative positional information given for each photo meaningful in interpreting the sequence as a transect.
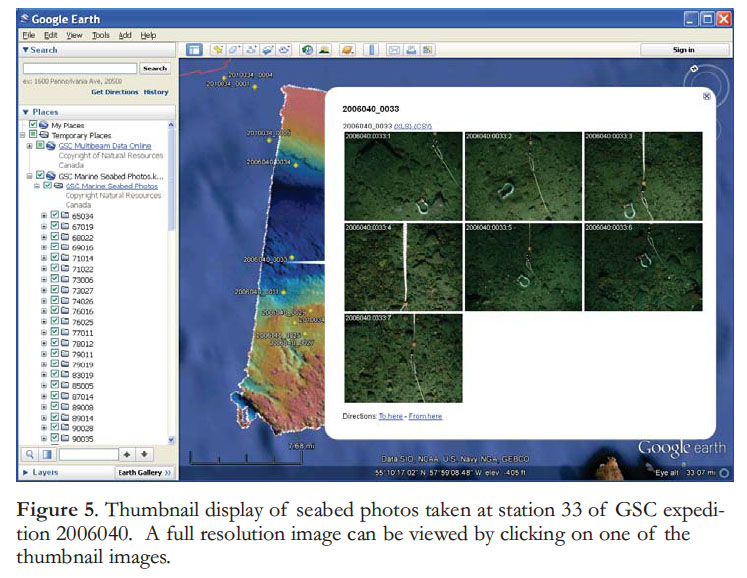
25 The photo collection is available online (Courtney 2013g) at ftp://ftp2.cits.rncan.gc.ca/pub/geott/MarineGeoscienceData/Seabed_Photo_Collection. As with the seismic collection, data are organized according to expedition identification number. Reduced-scale, thumbnail photos are displayed for the sequence of photos taken at each sampling station (Fig. 5); each photo is labeled with the expedition identification, the station number and the photo number. A full resolution image of each of the thumbnails can be viewed by clicking the thumb-nail. An excel (XLS) or comma-separated variable formatted table may be downloaded for the photos by pressing the XLS or CSV hyperlinks.
Grain Size Collection
26 GSC marine expeditions have been collecting grain size information on seabed and sub-seabed samples for over 50 years. Grain size is the most fundamental physical property of sediment (Poppe et al. 2000), and these data are widely used in a variety of applications in marine science. The GSC database contains primarily summary grain size data (percentage gravel, sand, silt, etc.), but in some cases more complete grain size distributions are recorded.
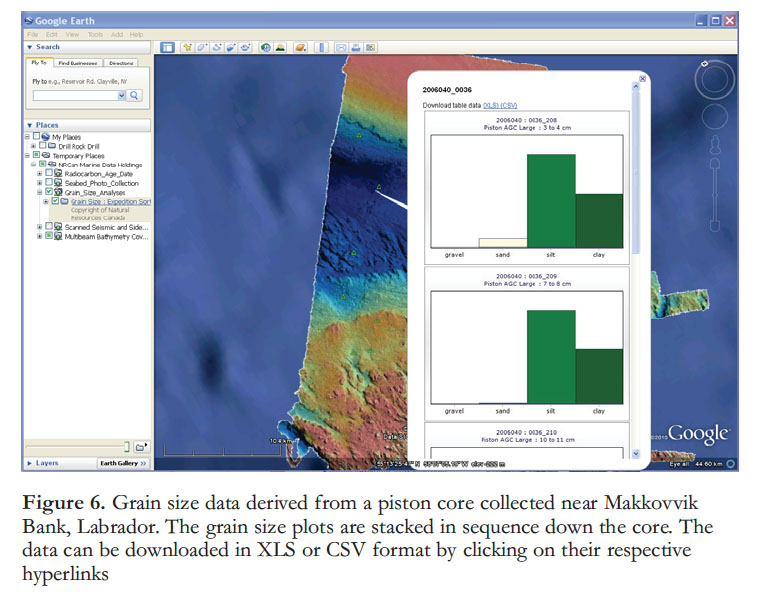
27 The GSC grain size collection is available online in KML format (Courtney 2013e) and for ftp download at ftp://ftp2.cits.rncan.gc.ca/pub/geott/MarineGeoscienceData/Grain_Size_Analyses. In this compilation, grain size data are sorted, as before, by the expedition identification number. Both coarse and detailed (when available) grain size distribution plots are shown when a placemark is chosen (Fig. 6). If the sample contains more than one sub-sample (e.g. as with a piston core sequence), the grain size plots are stacked in the display window from the top of the core downwards. Tabular data can be downloaded separately for each station, or for an entire expedition, in MS Excel (XLS) or comma-separated-variable (CSV) format by pressing the corresponding hyperlinked tag. These tables can then be imported directly into ArcGIS or similar geographic information systems.
 Display large image of Figure 6
 Display large image of Figure 7
Radiocarbon Date Collection
28 Radiocarbon dates, derived from organic samples collected through GSC marine expeditions, are available online in a KML compilation (Courtney 2013f). Radiocarbon data were collected by GSC scientists primarily to better understand the spatial and temporal coverage of sediments and seabed-fast marine ice during the last major deglaciation (Dyke et al. 2002). The quality of these data varies – ranging from imprecise bulk samples to more accurate accelerator mass spectrometer (AMS) estimates derived from single shell fragments or collections of foraminifera (Bowman 1990; Andrews et al. 1999).
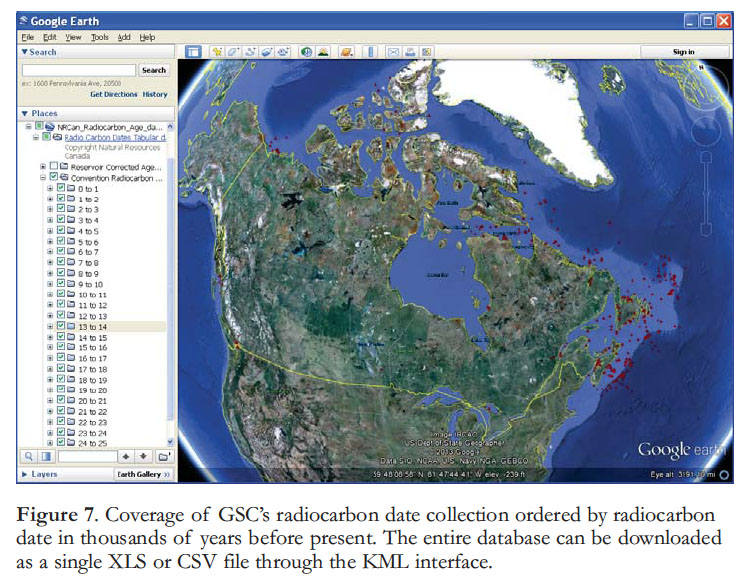
29 These data are ordered in the KML menu in 1000 year increments of radiocarbon date before present. By default, only conventional radiocarbon ages are displayed, and reservoir-corrected and measured ages are hidden (Fig. 7). To visualize the temporal and spatial marine limits of the last deglaciation, de-select the conventional radiocarbon dates en masse. Then incrementally turn on age layers in this menu from the bottom of the menu upwards, starting at 25 ka and moving upwards in time. In a general sense (caveat emptor), the displayed points show those areas not covered by glacial ice at or before the youngest date.
30 The entire marine radiocarbon holdings can be downloaded by pressing the XLS hyperlink (EXCEL format) or the CSV (ASCII Comma Separated Values) hyperlink in the dataset description of the KML file, or they can be downloaded directly from ftp://ftp2.cits.rncan.gc.ca/pub/geott/MarineGeoscienceData/Radiocarbon_Age_Date.
Putting it All Together
31 Although one can download separate KML files for each of the collections described in the previous sections, it is recommended that a composite KML file (Courtney 2013c) be used instead. This file contains network links to each of the marine data collections and it will be augmented with new data types as time permits. In addition, if any of the collections change then the network link will ensure that the most recent version will be downloaded and viewed.
DISCUSSION AND CONCLUSION
32 The use of KML and virtual globes (Ballagh et al. 2011; De Paor and Whit-meyer 2011) has become one of the most promising developments in the dissemination of geological data in the last decade. These developments, in conjunction with the establishment of metadata standards, the North American Profile of ISO 19115 (Federal Geographic Data Committee 2009; Government of Canada 2012b), will lead the way to a flood of discoverable geological source information on the Internet. Although agencies will continue to develop data portals (Government of Canada 2013b), the use of generic XML for metadata and KML discovery layers will make this information available and discoverable through standard search engines (e.g. Google, Bing), greatly enhancing their visibility to the general public.
33 Much scope remains in establishing standards for the way geological data is presented in KML and how to best make the source data available for download. For example, the KML files mentioned in this paper will continue to be refined, better addressing issues affecting level of detail, file size, and speed of redraw. The use of standard ftp/http access coupled with the use of ‘thin-layer’ KML discovery layers facilitates the online release of over 50 years of marine geological and geophysical data acquired in Canadian waters – the premier collection of its kind in Canada. Operating principles of data release make the collections unrestricted for download and reuse.
ESS contribution number 20130108.