Ice growth in the greenhouse: A seductive paradox but unrealistic scenario
Andrew J. WeaverSchool of Earth and Ocean Sciences, University of Victoria, PO Box 3055 Victoria, B.C., V8W 3P6, Canada;Tel: (250) 472 4001; Fax: (250) 472 4004
weaver@uvic.ca
Claude Hillaire-Marcel
Université du Québec, à Montréal C.P. 8888, Montreal, Québec, H3C 3P8 Canada
Accepted as revised 19 March 2004
ABSTRACT
The recent IPCC (2001) assessment stated that "Most models show weakening of the Northern Hemisphere Thermohaline Circulation (THC), which contributes to a reduction of surface warming in the northern North Atlantic. Even in models where the THC weakens, there is still a warming over Europe due to increased greenhouse gases." However, there is still a widespread misunderstanding of the possible consequence of climate change on the Atlantic Ocean Meridional Overturning. In particular, it is often touted, especially in the media, that a possible consequence of anthropogenic greenhouse gas emissions is: "the onset of the next ice age". Here we document the history of this misconception and quantitatively show how it is impossible for an ice age to ensue as a consequence of global warming. Through analysis of the paleoclimate record as well as a number of climate model simulations, we also suggest that it is very unlikely that the Atlantic Meridional Overturning will cease to be active in the near future. We further suggest that a region where intermediate water formation may shut down is in the Labrador Sea, although this has more minor consequences for climate than if deep water formation in the Nordic Seas were to cease.RÉSUMÉ
Lors d'une évaluation récente (2001) du GIÉC on a écrit « La plupart des modèles montrent l'existence d'un affaiblissement de la circulation thermohaline (CTH) dans l'hémisphère Nord, ce qui contribue à une réduction du réchauffement de surface de la région nord de l'Atlantique Nord. Et même dans les modèles montrant un affaiblissement de la CTH, il y a quand même réchauffement de la zone européenne à cause de l'augmentation des gaz à effet de serre. » Cependant, beaucoup d'incompréhension subsiste quant aux possibles conséquences d'un changement climatique découlant de ce retournement dans la portion méridionale de l'océan Atlantique. En particulier, on entend souvent, spécialement dans les médias, que l'une des conséquence possible des émissions de gaz à effet de serres anthropogéniques serait « le déclenchement d'un âge glaciaire ». Dans le présent article, nous présentons l'historique de cette méprise et démontrons qu'il est impossible qu'un âge glaciaire soit provoqué par le réchauffement de l'atmosphère de la planète. Aussi, par l'analyse des archives paléoclimatiques et l'étude de nombreux modèles de simulation climatique, nous suggérons qu'il est très improbable quele retournement en cours dans la portion méridionale de l'Atlantique Nord, cesse dans un avenir rapproché. Nous proposons aussi que la mer du Labrador est une région où la formation d'eaux intermédiaires pourrait s'arrêter, bien que les conséquences climatiques soient bien moindres que s'il s'agissait des eaux profondes de la mer du Nord.
INTRODUCTION
1 As noted in Weaver (2003), conveying the significance of climate change to the public is a difficult task for scientists and, unfortunately, the media often sensationalize the science with eye-catching headlines in an attempt to draw the reader to a particular story, often leaving the general public confused. An example concerns the erroneous and often cited consequence of anthropogenic fossil fuel emissions: Global warming will cause the onset of the next ice age. Perhaps it is not surprising that such a catchy and sensational hypothesis would spread like a virus through media outlets, and eventually end up setting the story for a blockbuster movie: "The Day After Tomorrow" (http://www. thedayaftertomorrow.com/), which hit movie theatres on May 28, 2004. According to comingsoon.net, in this movie, "Dennis Quaid plays a climatologist who tries to figure out a way to save the world from abrupt global warming. He must get to his young son (Jake Gyllenhaal) in New York, which is being taken over by a new ice age." But from where did the virus emerge?
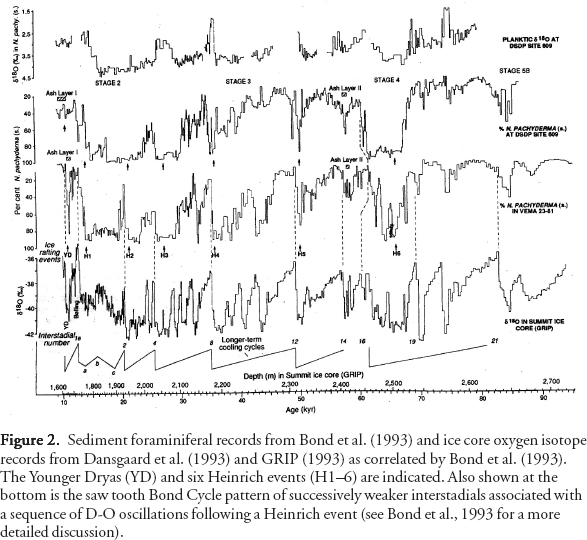
2 While under containmment for over two decades (e.g., see early ideas of Johnson and Andrews, 1979, concerning a warming-induced ice age), 1997 marked the first major outbreak of the "Global Warming Induced Ice Age Syndrome" (GWIIAS) virus following the publication of two popular articles: Rahmstorf (1997) and Calvin (1998). Their analysis was based on the realization that abrupt climate change was prevalent in the paleo proxy record (Fig. 1, 2) and in particular, that there was some early evidence from the Eemian, thought to be about 2°C warmer than preindustrial times (White, 1993; IPCC, 2001), that abrupt climate change was the norm (GRIP, 1993; Dansgaard et al., 1993). In particular, Rahmstorf (1997) states:"Evidence now emerging reveals a risk that global warming could plunge most of Europe into a big chill lasting hundreds of years, bringing with it effects that could be felt right around the world."Calvin (1998) notes:"We could go back to ice-age temperatures within a decade — and judging from recent discoveries, an abrupt cooling could be triggered by our current global-warming trend. Europe's climate could become more like Siberia's. Because such a cooling would occur too quickly for us to make readjustments in agricultural productivity and associated supply lines,it would be a potentially civilization-shattering affair, likely to cause a population crash far worse than those seen in the wars and plagues of history."
3 Despite the best efforts of several scientists to develop a vaccine to prevent the spread of the GWIIAS virus (e.g., Loutre and Berger, 2000), a second, and particularly virulent strain occurred on April 18th, 2002 after an Opinion Editorial entitled "The Heat Before the Cold" appeared in the New York Times. The GWIIAS virus spread to the Discover Magazine in September 2002, (Lemley, 2002) and then to national newspapers (e.g., the National Post in Canada published a piece in October, 2002 entitled: Rumbling of a coming ice age), and finally, local newspapers.
4 Berger and Loutre (2002) refined their original vaccine although it still didn't eradicate the spread of the GWIIAS virus. They noted the importance of reduced June insolation for ice sheet growth and suggested that "most CO2 scenarios led to an exceptionally long interglacial from 5000 years before the present to 50,000 years from now … with the next glacial maximum in 100,000 years. Only for CO2 concentrations less than 220 ppmv was an early entrance into glaciation simulated". They further argued that the next glaciation would not likely occur for 50,000 years.
5 Unfortunately, a BBC Horizon documentary aired on November 2003, once more releasing the GWIIAS virus on the unsuspecting public, just following a similar outburst for the benefit of the French speaking community, through the French TV network. Both prior to and in the follow-up to these documentaries, and not unlike past outbreaks, newspapers across the world picked up the story and conveyed to the public the dire consequences of an impending ice age. An even more virulent strain was released on January 26, 2004 following the Fortune Magazine publication of: Climate Collapse: The Pentagon's Weather Nightmare, three months after the report on which the story was based actually appeared (Schwartz and Randall, 2003). As we revise this manuscript (March, 2004), global warming-induced ice age stories are appearing around the world in the news media on a daily basis.
Figure 1. Variations in local Antarctic atmospheric temperature, as derived from oxygen isotope data, as well as concentrations of atmospheric CO2 and CH4 from Vostok, Antarctica ice core records. Figure redrawn from Petit et al. (1999).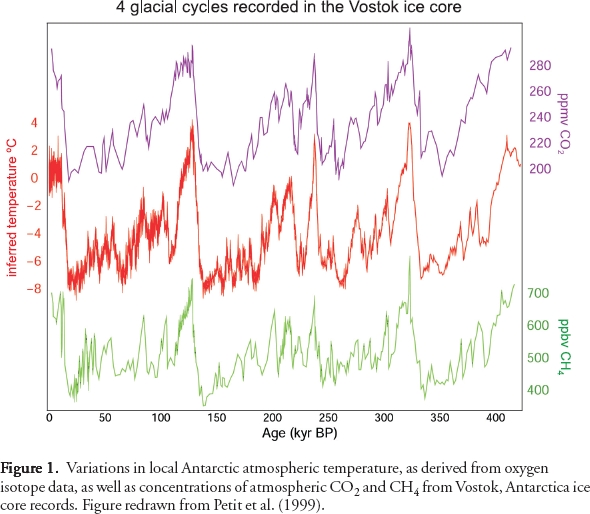
Display large image of Figure 1
Display large image of Figure 2
Glacial Inception: An Impossible Consequence of Global Warming
6 Over the years, a relatively solid understanding of glacial inception has emerged. Periods in late Quaternary Earth history that were characterized by reduced summer insolation in the northern hemisphere are those which are conducive to northern hemisphere glacial growth (i.e., Milankovich theory). The changes in seasonal insolation are then amplified through feedbacks (ice/snow albedo, vegetation, carbon cycle) operating within the coupled climate system. As demonstrated in Weaver et al. (1998), at equilibrium, changes in the strength of the Atlantic Meridional Overturning (AMO) have large local effects on North Atlantic surface air temperature and compensating effects elsewhere (especially the South Atlantic and North Pacific), such that when globally averaged, the surface air temperature is relatively insensitive to the strength of the AMO. Even in transient coupled GCM simulations where the AMO weakens over the 21st century, warming still occurs downstream over Europe (see Cubasch et al., 2001).
7 As an example, a version of the UVic Earth System Climate Model (Weaver et al., 2001) was integrated from 1850 until 1997 following prescribed observed levels of atmospheric CO2. The atmospheric CO2 level was then increased at 1%/ year until such time as doubling occurred (560 ppm). It was subsequently held fixed until year 4850. During the integration, which we term our control experiment, the AMO followed the typical path of a very slight weakening followed by a recovery once the radiative forcing was removed (Fig. 3). At equilibrium, the globally averaged surface air temperature was 3.4°C warmer than at 1850 (Fig. 4a).
8 Fresh water was then applied to the entire North Atlantic between 50°N and 70°N at a rather dramatic rate of1 Sv (1 Sv = 106m3s-1) for 500 years, 1000 times the maximum estimate for the rate of Greenland ice sheet melting over the 20th century. This was done to force the AMO to shut down (Fig. 3) in order to examine the warming relative to the case with an active AMO. While the results show a 3.0°C globally-averaged warming with an inactive thermohaline circulation (THC) (Fig. 4d), the simulation is not near equilibrium (Fig. 3). Continued integration would lead to enhanced warming (Weaver et al., 1998) as the compensating oceanic response in the South Atlantic and North Pacific equilibrated. Of particular importance is that even with an inactive AMO, there is warming everywhere except over the ocean in the immediate vicinity of the location of North Atlantic deep water (NADW) formation. The collapse of the AMO therefore acts as a local negative feedback to anthropogenic warming in and around the North Atlantic. That is, through reducing the transport of heat from low to high latitudes, sea surface temperatures (SSTs) are cooler than they would otherwise be if the AMO was left unchanged. As such, warming is reduced over and downstream of the North Atlantic. Of particular importance is that nowhere is there snow coverage over land in August (Fig. 4g), so glaciation is not possible.
Figure 3. Timeseries of the maximum overturning streamfunction in the North Atlantic. The model was started at 1850 and integrated to 1997 following prescribed observed levels of atmospheric CO2. The atmospheric CO2 level was then increased at 1%/year until it reached double pre-industrial values (560 ppm). Atmospheric CO2 was subsequently held fixed for 3000 years of integration. Fresh water was then added to the North Atlantic to ensure a cessation of deep water formation there at both year 2050 and at year 4850. The black line is the control experiment to which 1.0 Sv of freshwater was added to the North Atlantic between 50 and 70°N from 4850 to 5350. Blue: 1.0 Sv was added from 2050 to 2550; yellow: 1.0 Sv was added from 1950 to 2450; pink: 0.1 Sv was added from 1950 to 2450; green: 0.022 Sv was added from 1950 to 2450; red: 0.001 Sv was added from 1950 to 2450. Not that in the green case (0.022 Sv added from 1950 to 2450) Labrador Sea Water formation has been impeded.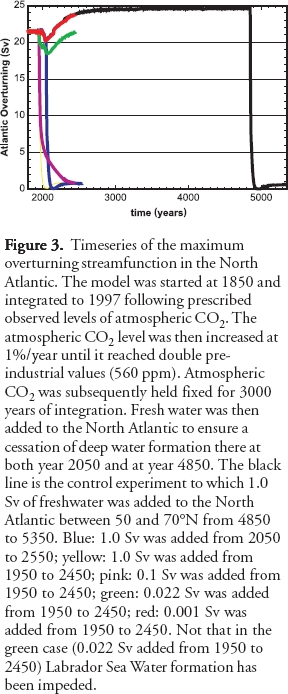
Display large image of Figure 3
9 In a similar vain, the transient climate states at 1950 and 2050 were used as initial conditions to which an unrealistically large amount (1 Sv) of freshwater was added to the North Atlantic for 500 years in order to force the AMO to shut down (Fig. 3). Comparing the climate of the collapsed AMO experiment at 2550 with the transient unperturbed control simulation, one sees that resulting surface air temperature conditions show similar patterns to the equilibrium response mentioned above. Once more the collapsed AMO case (Fig. 4c) has a slightly cooler globally averaged warming (2.6°C relative to 1850) than the control experiment (3.2°C relative to 1850, Fig. 4b), although again, the inactive AMO case is not in equilibrium. Of particular importance is that there is no snow over land in August (as temperatures are too warm) which is a necessary precursor for the growth of glaciers (Fig. 4h).
10 In the most extreme case, where we have assumed that 1Sv of water has been added to the North Atlantic since 1950, and will be continually added until 2450, we reach similar conclusions. In the control case the globally averaged temperature at 2050 has warmed by 2.1°C (Fig. 4c) whereas at 2050, with an inactive AMO case it is only 1.5°C (Fig. 4f). Once more, future warming would ensue as the inactive AMO case approached equilibrium and there is no snow coverage in August (Fig. 4i). The effects of an inactive AMO are amplified in the winter such that the globally averaged February warming at 2050 with an inactive AMO is 1.3°C (Fig. 5a), whereas it is 1.6°C in August (Fig. 5b). Much as envisioned in Rahmstorf (1997), there are regions of significant cooling in and around the North Atlantic associated with an inactive AMO. Certainly, the importance of the heat transport associated with an active AMO cannot be lightly dismissed as in a press release by Columbia University on February 5, 2003: "Columbia Research Dispels 150 Years of Thinking — Mild Winter Conditions in Europe Are Not Due to the Gulf Stream", following the publication of Seager et al. (2002).
Figure 4. a) Surface air temperature difference between equilibrium doubled CO2 climate (560 ppm) and the initial pre-industrial (1850) climate (280 ppm). b) As in a) but at year 2550; c) As in a) but at year 2050; d) As in a) but after NADW formation was forced to shut down (i.e., the end of the integration shown in Fig. 3); e) As in d) but at year 2550; f ) As in d) but at year 2050; g) Fractional area covered by sea ice (over the ocean) and snow (over the land) at the end of the integration shown in Figure 3 with NADW formation forced to shut down; h) As in g) but at year 2550; i) As in h) but at year 2050. The bold line in d)-f) represents the 0EC warming contour relative to 1850.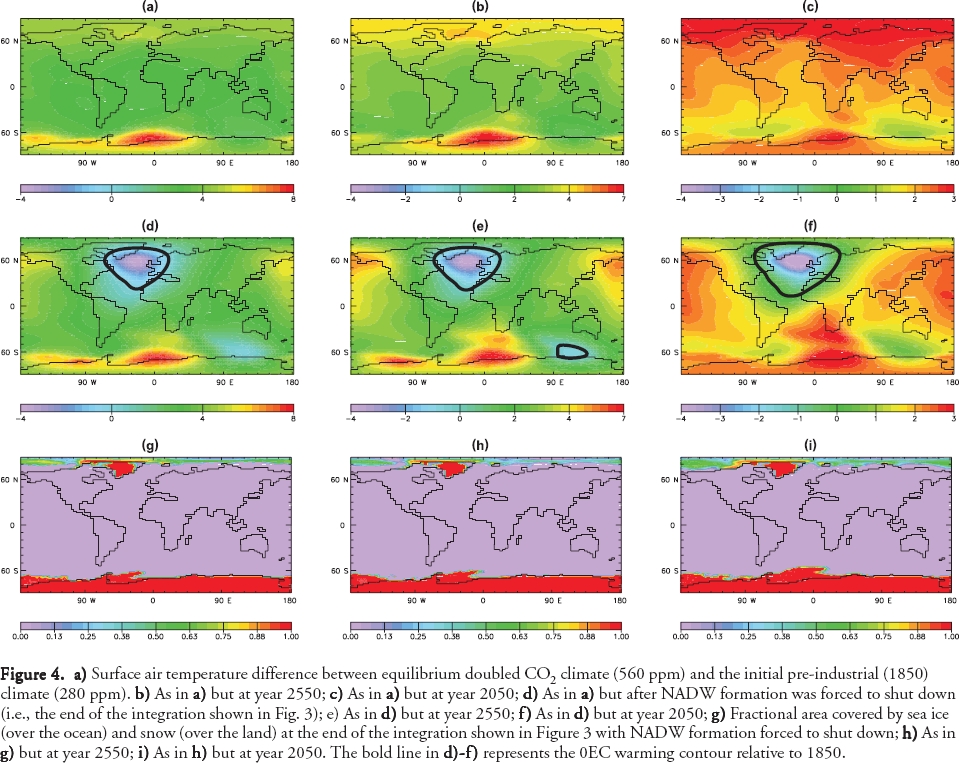
The Lessons of the Past
11 Although most paleoclimatologists would agree that the past is unlikely to provide true analogues of the future of the globe under the stress of global warming, past climate synopsis are often used to evaluate model experiments or as a means to illustrate global warming scenarios. In the present case, a significant reduction of the AMO due to a global warming-induced increase in freshwater supplies to the North Atlantic, is often discussed in relation to a short event that occurred some 8.2 ka ago (e.g., Renssen et al., 2002), when one of the largest glacial lakes of the Laurentide Ice Sheet (LIS), Lake Ojibway, drained into the North Atlantic through Hudson Strait, releasing in one or two years about 1.63 x 10⁵km3 of freshwater, at a maximum rate of 5 to 10 Sv (i.e., millions of cubic meters of water per second) (see Barber et al., 1999; Clarke et al., 2003). However, to our knowledge, there is not yet unequivocal evidence that this event has resulted in a significant reduction of the AMO. Some sea surface cooling has indeed been reported during this event, but at a local scale, for example in the eastern Norwegian Sea (e.g., Bauch and Weinelt, 1997). Most other records from the sub-Arctic North Atlantic do not reveal significant changes in paleosea surface conditions (e.g., Solignac et al., 2004). Of course, time resolution of deep sea records could be an issue here, in view of the short duration of the event. Keeping in mind this caveat, noteworthy is the fact that the Western Boundary UnderCurrent (WBUC) that carries the deep North Atlantic Water masses originating from the Norwegian and Greenland seas along continental slopes of Greenland and northeast America, remained apparently unchanged during this episode (e.g., Fagel et al., 1997; Kuijpers et al., 2003). Thus, the so-called "8.2 ka event" that has attracted so much attention from continental paleoclimatologists (e.g., Klitgaard-Kristensen et al., 1998) still remains unclear.
Figure 5. a) February surface air temperature difference between the 2050 collapsed AMO climate and the 1850 equilibrium climate. b) As in a) but for August; c) As in a) but for the experiment in which a 0.022 Sv perturbation is added to the North Atlantic; d) As in c) but for August. The bold line represents the 0EC warming contour relative to 1850. Note: there are no below zero values in c) and d).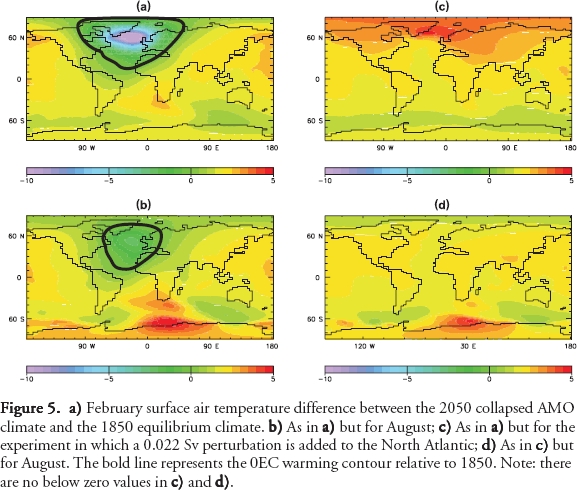
Display large image of Figure 5
12 At many places, the 8.2 ka event does not differ from several other climatic oscillations recorded throughout the Holocene. Moreover, it is assigned a duration varying from site to site from less to 200 years to 400 years (e.g., Clarke et al., 2003; Alley et al., 1997). Actually, its clearest recording in the circum-North Atlantic is found in Greenland ice cores and western European lacustrine sequences (e.g., Alley et al., 1997; von Grafenstein et al., 1998). In both cases, negative shifts in δ18O-values of paleoprecipitations have been inferred and assigned to temperature drops. From this view point, the incidence of the isotopic composition of Lake Ojibway water (originating from the final melting of the 18O-depleted innermost LIS ice; cf. Hillaire-Marcel et al., 1979) , has yet to be assessed. It could have modified the salinity vs. δ18O relationship of North Atlantic surface waters, during years subsequent to the drainage event, and thus account for part of the negative isotopic shift reconstructed for paleoprecipitations. As one does not foresee increases in freshwater inputs in the North Atlantic that could approach the 5-10 Sv discharge peaks of the Lake Ojibway drainage event (the present Arctic river cumulative discharge rate is about two orders of magnitude lower), and because the incidence of this event on the AMO is still unclear, further reference to the 8.2 ka-event, with respect to a near future reduction of the AMO, seems irrelevant for the time being.
13 As a matter of fact, unquestionable evidence for a significant reduction of the AMO has only been found for intervals such as the Last Glacial Maximum (LGM) and some short, particularly cold intervals of the last ice ages (e.g., Heinrich events, Younger Dryas event [1300 year duration ending 11,500 years ago]; see for example Broecker, 1994), when large ice sheets occupied the northern hemisphere. Sedimentological, geochemical and micropaleontological proxy data from deep sea cores converge to illustrate a reduction or near-collapse of the AMO during such intervals (e.g., Streeter and Shackleton, 1979; Boyle and Keigwin, 1987; Duplessy et al., 1988; Johnson et al., 1988; Yu et al., 1996). This reduction of the AMO seems to be have been related either to the dispersal of huge quantities of icebergs in the northern North Atlantic (notably due to major surges of the Laurentide Ice Sheet in the Hudson Strait area; see a review in Andrews, 1998), and/or to the direct release of meltwater from the Scandinavian Ice Sheet and surrounding ice-caps into the most critical sector with respect to the AMO – that of the northeast Atlantic (as pointed out below, such situations with fully developed ice-sheets are unlikely to have a near future analogue). Otherwise, during the two periods of deglacial time, when maximum ice retreat and maximum meltwater outflow are recorded (see Fairbanks, 1989), data indicate on the contrary a rapid inception of the AMO. This was due to the fact that meltwaters were evacuated along a "western route", in the North Atlantic, whereas relatively high salinity conditions still prevailed in the northeast sector, thus allowing convection and deep water formation to resume along this "eastern route" (e.g., Austin and Kroon, 2001; Hillaire-Marcel et al., 2001a; Solignac et al., in press). Even during the LGM, large east-west density gradients are reported in the northern North Atlantic (de Vernal et al., 2002). As a consequence, the most critical site, with respect to intermediate or deep-water formation sensitivity to enhanced freshwater supplies, has been and would be the Labrador Sea. Indeed, convection could stop there in response to global warming, as shown by recent model experiments, and this, apparently without any major incidence on the overall rate of AMO (e.g., Wood et al., 1999; Cottet-Puinel et al., 2004).
14 Two past situations may illustrate the different behavior of the eastern and western North Atlantic with respect to thermohaline circulation pathways: The early Holocene (Fig. 6) and the Last Interglacial. Both intervals correspond to high insolation rates over the northern North Atlantic and to an overall climate optimum (with a global temperature thought to be about 2°C higher than during preindustrial times, in the second case; e.g., White, 1993). During the early Holocene, immediately following the Younger Dryas slowdown of the AMO, evidence for a high inflow of North Atlantic waters, significantly warmer than at present, is found from the Barents Sea (Duplessy et al., 2001) to Western Arctic records (Hillaire-Marcel et al., in press). This is consistent with estimates of sea-surface temperatures in the northeast North Atlantic and Nordic seas, based on various proxies, that reveal marked cooling trends from the early to the late Holocene (e.g., Koç et al., 1993; Klitgaard-Kristensen et al., 2001; Marchal et al., 2002). Further evidence for this intensified northeastern AMO route during the early Holocene is provided by indications for a high subsequent outflow of North-East Atlantic Deep Waters (NEADW), from the Norwegian Sea, into the Iceland and Western European basins. These indications include enhanced fluxes of Reykjanes Ridge indicators (smectites/ illite clay ratios, Nd isotopic compostion of clays; see Fagel et al., 1997 and Innocent et al., 1997) in the Labrador Sea, and high deep current velocities at the latitude of the Bight Fracture Zone, resulting in deep sediment erosion (Solignac et al., 2004).
15 Nd isotopes in north-western Atlantic deep sediments do not show any significant geochemical imprints of the Denmark Strait Overflow Water (DSOW) prior to 8.5 kyr (Fagel et al., 2002). Production of DSOW increased between 6-8 kyr BP and peaked during mid-Holocene time (Kuijpers et al., 2003), as also indicated by 230Th-excesses in slope and rise sediments from the northwestern Atlantic (Veiga-Pires and Hillaire-Marcel, 1998). Finally, at ca. 7 ka BP, the production of the westernmost component of North Atlantic Deep Water (NADW), the Labrador Sea Water (LSW), started (Hillaire-Marcel et al., 2001a, b), suggesting a final major reorganization of the AMO at the same time (i.e., a reduced inflow of North Atlantic waters into the Arctic and a concomitant reduction of NEADW overflow). Thus, the westernmost site of deep (intermediate) water formation started to operate only after the final collapse of Laurentide Ice Sheet, i.e., when glacial meltwater supplies completely stopped in this sector. Maximum relative production of LSW has marked the late Holocene interval, leading to the modern AMO situation (Hillaire-Marcel et al., 2001a, b). In summary, the Holocene has been marked by a progressive reduction of east-west density gradients, in the Northern North Atlantic, with a switch from a prominent eastern AMO route (DSOW) during the early Holocene, to a prominent northern route (DSOW) during the mid-Holocene, then to the late Holocene– present situation with an enhanced rate of LSW formation, westward (Fig. 6).
Figure 6. Schematic diagram showing the behaviour of the Atlantic thermohaline circulation during the middle and late (Modern) Holocene (left) and the early Holocene (right). In green, intermediate or deep water masses; in red, the incoming North Atlantic warm and saline water mass. The routing of the Atlantic Water mass, in the Arctic, is from Jones (2001). Cold and dilute surface currents evacuating westward Arctic freshwaters, are not shown (i.e., the East, then West Greenland Current, and the Labrador Current). They follow practically the trajectory of the Denmark Strait Overflow Water (DSOW) in the Irminger and Labrador seas. Note the strong opposition between a high salinity northeast North Atlantic, and a low salinity northwest North Atlantic. Maximum formation of Norwegian Sea Overflow Water (NSOW) occurred during the early Holocene, whereas DSOW peaked during the mid-Holocene, and Labrador Sea Water (LSW) reached its maximum during the late Holocene. This east-west temporal shift is linked to increasing density of surface waters westward. NADW: North Atlantic deep water.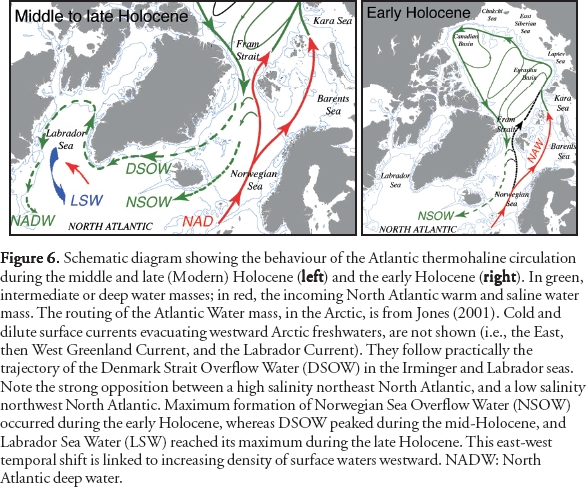
Display large image of Figure 6
16 A clear picture of the AMO under high freshwater supply rates arises from its recent history: high freshwater supplies may indeed impede convection in the Labrador Sea, but this would result in an increased eastward branch of AMO. Further indication for such behaviour is found in records of the Last Interglacial interval, i.e., when conditions warmer than today prevailed. Relatively dilute surface water was maintained in the Labrador Sea, preventing LSW to form through winter convection, but a high velocity WBUC was maintained throughout the whole episode, indicating a high AMO along the "eastern route" (Hillaire-Marcel etal., 2001b). During this episode, the Greenland Ice Sheet was significantly reduced (e.g., Cuffey and Marshall, 2000). The low salinity surface water layer of the Labrador Sea may have resulted at least partly from enhanced Arctic freshwater supplies through the Canadian Arctic Archipelago channels (thus, their partial rerouting from Fram Strait, northeast of Greenland, to this western route). A similar situation could also result from significant reduction of Arctic Ice due to global warming (e.g., Rothrock et al., 1999).
DISCUSSION
17 Despite the statement in the IPCC (2001) report:"Most models show weakening of the Northern Hemisphere Thermohaline Circulation (THC), which contributes to a reduction of surface warming in the northern North Atlantic. Even in models where the THC weakens, there is still a warming over Europe due to increased greenhouse gases."and its assessment that:"However, it is too early to say with confidence whether an irreversible collapse in the THC is likely or not, or at what threshold it might occur and what the climate implications could be."the media have portrayed a collapse of the AMO as almost inevitable, with the likely consequence of sending us into the next ice age. Global warming leading to the next ice age makes for catchy headlines but it is not based in science. What is required, of course, is a change in seasonal incoming solar radiation (warmer winters and colder summers) associated with changes in the Earth's axial tilt, longitude of perihelion and the precession of its elliptical orbit around the sun. This small change must then be amplified by albedo feedbacks associated with enhanced snow and ice cover, vegetation feedbacks associated with the expansion of tundra, and greenhouse gas feedbacks associated with the uptake (not release) of carbon dioxide and methane.
18 It is certainly true that as we have shown, were the AMO to become inactive, there would become significant short-term cooling, especially in the winter, in western Europe. Such conditions were as envisioned by the original Rahmstorf (1997) article before this idea was mutated into the notion of an impending ice age. However, it is important to emphasize that not a single coupled model assessed in IPCC (2001) found a collapse of the AMO during the 21st century. It is also important to emphasize that, unlike in glacial times, there is no Laurentide or Fennoscandian ice sheet over North America or Western Europe, respectively. As such one must question where the source of fresh water would come from in order to cause an abrupt transition of the AMO from an active to inactive mode.
19 The numerous coupled models assessed in IPCC (2001) have a range in the magnitude of the hydrological cycle response, characterized by increased precipitation at middle to high latitudes and increased evaporation in the subtropics, with the UVic model used here in the middle of this range. As noted earlier, none of these models show a cessation of the AMO during the 21st century, although many show a slight reduction in its intensity. In addition, even in those models where the AMO weakens, there is still a warming over Europe due to increased greenhouse gases. As such, it is very unlikely that AMO will shut down this century in response to an intensified hydrological cycle. Nevertheless, some have suggested, without quantitative support, that freshwater input to the oceans by melting land glaciers, ice sheets and permafrost, which is not included in the coupled model simulations assessed in IPCC (2001), could be sufficient to trigger a cessation of the AMO during the 21st century.
20 The best estimate of sea level change over the 20th century (IPCC, 2001) associated with the very slight net negative mass balance from Greenland (which itself is not significantly different from zero in a statistical sense) is 0.0– 0.1 mm/yr. This converts to only about 0.0– 0.001 Sv (1 Sv =106m3s– 1) of freshwater forcing. The maximum estimate, 0.001 Sv is 1/1000th the size of the perturbation we used earlier to collapse the AMO (although we can collapse the AMO with a 0.1 Sv perturbation for 500 years as well, Fig 3). In an additional experiment, we took this upper bound estimate (0.001 Sv) and added it continuously from 1950– 2450 as an external perturbation to the North Atlantic between 50 and 70°N. The resulting path of the AMO is indistinguishable from the control case (Fig. 3) as is the globally averaged warming at 2050(2.17°C in February and 2.02°C in August).
21 The range of observed rate of global sea level rise over the 20th century is estimated to be between 1.0 mm/year and 2.0 mm/year (IPCC, 2001). This, of course, includes a large component (about 1/3 of the total) associated with thermal expansion of the oceans. In addition, it includes sea level rise due to sediment deposition, terrestrial storage, permafrost, glacier and ice cap melting, isostatic adjustment, and changes in the mass balance of the Greenland and Antarctic ice sheets. Suppose that we make the clearly incorrect assumption that the entire rate of observed sea level rise is a consequence of fresh water being added to the North Atlantic between 50 and 70°N, and we further assume the upper bound (2.0 mm/yr) is the correct estimate. To be conservative we increase this upper bound slightly to correspond with the upper bound associated with model-based estimates (2.2 mm/yr, IPCC, 2001). We then consider the response of the AMO to an external and sustained perturbation of 0.022 Sv from 1950– 2450 distributed across the North Atlantic from 50 to 70°N.
22 This additional freshwater perturbation to the North Atlantic causes a slight further weakening of the AMO associated with a cessation of Labrador Sea Water formation, much as envisioned in our discussion of the paleoclimate record earlier. However, the effect on the climate over Europe is still small (Fig. 5c, d). Globally averaged, the 2050 warming relative to 1850 is 2.14°C in February and 2.00°C in August, whereas it was 2.17°C and 2.02°C in the control experiment. Of particular importance is that there is nowhere on the globe that temperatures are cooler than they were at 1850.
CONCLUSIONS
23 While much has been made in the media of global warming potentially leading to the onset of the next ice age, we believe we have shown that this is simply not possible. A more relevant question is what will happen to the AMO during the course of the next century. Some models assessed in IPCC (2001) find no reduction of the AMO during the 21st century while others find a slight reduction in its strength. Such a reduction leads to a negative feedback to anthropogenic warming in and around the North Atlantic. That is, through reducing the transport of heat from low to high latitudes, SSTs are cooler than they would otherwise be if the AMO was left unchanged. As such, warming is reduced over and downstream of the North Atlantic. It is important to note that in all models where the AMO weakens, warming still occurs downstream over Europe. While admittedly model-dependent, even in the case where we added an additional external freshwater perturbation to the North Atlantic for 500 years, whose magnitude was chosen to account for the upper estimate of the observed rate of global sea level rise this past century, we still do not get a cessation of the AMO and cooling down stream over Europe.
24 Worth mentioning here is the fact that the most sophisticated non flux-adjusted model of Wood et al. (1999) suggests that the freshening of North Atlantic surface waters presently observed (Curry et al., 2003) could be associated with an increasing AMO (Wu et al., 2004). This same model, praised by Rahmstorf (1999) as giving "for the first time a realistic simulation of the large scale ocean currents", also suggests that eventually it is only Labrador Sea Water formation that is susceptible to a collapse as it did during the most recent warmer episodes of the Earth Climate history (Hillaire-Marcel et al., 2001).
25 Climate change is offering decision makers and society as a whole many important challenges that need to be assessed and addressed, including the possibility of a reduction in the strength of the AMO or the very remote possibility of its cessation this century. One thing that they need not concern themselves with is Global Warming causing the onset of the next ice age. Unfortunately, such a conclusion is far less newsworthy than the one warning of the occurrence of an impending ice age.
ACKNOWLEDGEMENTS
AJW is grateful to both the Killam Foundation and the Canada Research Chair program for providing both research support and release time. We are grateful to M. Eby for assisting us with some of the numerical integrations and to Shawn Marshall for his constructive review. Funding support from NSERC and CFCAS is also acknowledged.REFERENCES
Alley, R.B., Mayewski, P.A., Sowers, T., Stuiver, M., Taylor, K.C. and Clark, P.U., 1997, Holocene climatic instability: A prominent widespread event 8200 yr ago: Geology,v. 25, p. 483-486.
Andrews, J.T., 1998, Abrupt changes (Heinrich events) in late Quaternary North Atlantic marine environments: a history and review of data and concepts: Journal of Quaternary Science, v. 13, p. 3-16.
Austin, W.E.N. and Kroon, D., 2001, Deep sea ventilation of the northeastern Atlantic during the last 15,000 years: Global and Planetary Change, v. 30, p. 13-31.
Barber, D.C., Dyke, A., Hillaire-Marcel, C., Jennings, A. E., Andrews, J.T., Kerwin, M.W., Bilodeau, G., McNeely, R., Southon, J., Morehead, M.D., and Gagnon, J.-M., 1999, Forcing of the cold event of 8,200 years ago by catastrophic drainage of Laurentide lakes: Nature, v. 400, p. 344-348.
Bauch, H.A. and Weinelt, M.S., 1997, Surface water changes in the Norwegian sea during last deglacial and holocene times: Quaternary Science Reviews, v. 16, p. 1115-1124.
Berger, A. and Loutre, M.F., 2002, An Exceptionally Long Interglacial Ahead?: Science, v. 297, p. 1287-1288.
Bond, G., Broecker, W., Johnsen, S., McManus, J., Labeyrie, L., Jouzel, J. and Bonani, G., 1993, Correlations between climate records from North Atlantic sediments and Greenland ice: Nature, v. 65,p. 143– 147.
Boyle, E.A. and Keigwin, L.D., 1987, North Atlantic thermohaline circulation during the past 20,000 years linked to high-latitude surface temperature: Nature, v. 330, p. 35-40.
Broecker, W.S., 1994, Massive iceberg discharges as triggers for global climate change: Nature, v. 372, p. 421-424
Calvin, W.H., 1998, The great climate flip-flop: The Atlantic Monthly, v. 281(1), p. 47-64, January.
Clarke, G., Leverington, D., Teller, J., and Dyke, A., 2003, Superlakes, Megafloods, and Abrupt Climate Change: Science,v. 301, p. 922-923.
Cottet-Puinel, M., Weaver, A.J., Hillaire-Marcel, C., de Vernal, A., Clark, P.U., and Eby, M., 2004, Variation of Labrador Sea water formation over the last glacial cycle in a climate model of intermediate complexity: Quaternary Science Reviews, v. 23, p. 449-465.
Cubasch, U., Meehl, G.A., Boer, G.J., Dix, M., Noda, A., Senior, C.A., Raper, S. and Yap, K.S., 2001, Projections of Future Climate Change, in Climate Change 2001: The Scientific Basis: Contribution of Working Group I to the Third Assessment Report of the Intergovernmental Panel on Climate Change, J.T. Houghton et al. (eds.): Cambridge University Press (Cambridge, New York), p. 526-582.
Cuffey, K.M. and Marshall, S.J., 2000, Substantial contribution to sea-level rise during the last interglacial from the Greenland ice sheet: Nature, v. 404, p. 591-594.
Dansgaard W., Johnsen, S.J., Clausen, H.B., Dahl-Jensen, D., Gundestrup, N.S., Hammer, C.U., Hvidberg, C.S., Steffensen, J.P., Sveinbjörnsdottir, A.E., Jouzel, J. and Bond, G., 1993, Evidence for general instability of past climate from a 250-kyr ice-core record: Nature, v. 364, p. 218-220.
de Vernal, A., Hillaire-Marcel, C., Peltier, R.W. and Weaver, A., 2002, The structure of the upper water column in the NW North Atlantic: Modern vs. Last Glacial Maximum conditions: Paleoceanography, v. 17, p.1050-2-1-15.
Duplessy, J.-C., Ivanova, E., Murdmaa, I., Paterne, M. and Labeyrie, L., 2001, Holocene paleoceanography of the northern Barents Sea and variations in the northward heat transport of the Atlantic Ocean: Boreas, v. 30, p. 2-16.
Duplessy, J.C., Shackleton, N.J., Fairbanks, R.G., Labeyrie, L., Oppo, D., and Kallel-N.k, N., 1988, Deepwater source variations during the last climatic cycle and their impact on the global deepwater circulation: Paleoceanography, v. 3, p. 343-360.
Fagel, N., Innocent, C., Gariépy, C., and Hillaire-Marcel, C., 2002, Sources of Labrador Sea sediments since the Last Glacial Maximum inteferred from Nd-Pb isotopes: Geochimica Cosmochimica Acta,v. 66, p. 2569-2581.
Fagel, N., Hillaire-Marcel, C., and Robert, C., 1997, Changes in the Western Boundary Undercurrent outflow since the Last Glacial Maximum, from smectite/illite ratios in deep Labrador Sea sediments: Paleoceanography, v. 12, p. 79-96.
Fairbanks, R.G., 1989, A 17,000-year glacioeustatic sea level record: influence of glacial melting rates on the Younger Dryas event and deep-ocean circulation: Nature, v. 342,p. 637-642.
GRIP Project Members, 1993, Climate instability during the last interglacial period recorded in the GRIP ice core: Nature,v. 364, p. 203-207.
Hillaire-Marcel, C., de Vernal, A., Polyak L., and Darby, D., 2004, Size dependent isotopic composition of planktic foraminifers from Chukchi Sea vs. NW Atlantic sediments - Implications for the Holocene paleoceanography of the western Arctic: Quaternary Science Reviews, v. 23,p. 245-260.
Hillaire-Marcel, C., de Vernal, A., Bilodeau, G., and Stoner, J., 2001a, Changes of potential density gradients in the northwestern North Atlantic during the last climatic cycle, based on a multi-proxy approach, in The oceans and rapid climate changes: Past, Present and Future, D. Seidov et al., eds.: Geophysical Monograph Series, v. 126, p. 83-100.
Hillaire-Marcel, C., de Vernal, A., Bilodeau, G., and Weaver, A.J., 2001b, Absence of deep-water formation in the Labrador Sea during the last interglacial period: Nature, v. 410,p. 1073-1077.
Hillaire-Marcel, C., Soucy, J.-M., and Cailleux, A., 1979, Analyse isotopique de concrétions sous-glaciaires de l'inlandisis laurentidien et teneur en oxygène 18 de la glace: Canadian Journal of Earth Sciences, v. 16, p. 1494-1498.
Innocent, C., Fagel, N., Stevenson, R.K., and Hillaire-Marcel, C., 1997, Sm-Nd signature of modern and late Quaternary sediments from the northwest North Atlantic: Implications for deep current changes since the Last Glacial Maximum: Earth and Planetary Science Letters, v. 146, p. 607-625..
IPCC, 2001: Climate Change 2001, The Scientific Basis: Contribution of Working Group I to the Third Scientific Assessment Report of the Intergovernmental Panel on Climate Change: Houghton, J.T., Ding, Y., Griggs, D.J., Noguer, M., van der Linden, P.J., Dai, X., Maskell, K., and Johnson,C.A., eds., Cambridge University Press, Cambridge, UK, 881 p.
Jones, E.P., 2001, Circulation in the Arctic Ocean: Polar Research, v. 20, p. 139-146.
Johnson, R.G. and Andrews, J.T., 1979, Rapid ice-sheet growth and initiation of the last glaciation: Quaternary Research, v. 12,p. 119-134.
Johnson, T.C., Lynch, E.L., Showers, W.J., and Palczuk, N.C., 1988, Pleistocene fluctuations in the Western Boundary Undercurrent on the Blake Outer Ridge: Paleoceanography, v. 3, p. 191-207.
Klitgaard-Kristensen, D., Sejrup, H.P., and Haflidason, H., 2001, The last 18 kyr fluctuations in Norwegian Sea surface conditions and implications for the magnitude of climate change: Evidence from the North Sea: Paleoceanography, v. 16(5),p. 455 (1999PA000495).
Klitgaard-Kristensen, D., Sejrup, H.P., Haflidason, H., Johnsen, S., and Spurk, M., 1998, A regional 8200 cal. yr BP cooling in northwest Europe induced by final stages of the Laurentide ice-sheet disintegration?: Journal of Quaternary Sciences, v. 13,p. 165-169.
Koç, N., Jansen, E., and Haflidason, H., 1993, Paleoceanographic reconstructions of surface ocean conditions in the Greenland, Iceland and Norwegian seas through the last 14 ka based on diatoms: Quaternary Science Reviews, v. 12, p. 115-140.
Kuijpers, A., Troelstra, S.R., Prins, M.A., Linthout, K., Akhmetzhanov, A., Bouryak, S., Bachmann, M.F., Lassen, S., Rasmussen,S., and Jensen, J.B., 2003, Late Quatyernary sedimentary processes and ocean circulation changes at the Southeast Greenland margin: Marine Geology, v. 195, p. 109-129.
Lemley, B., 2002: The new ice age: Discover,v. 23(9), September.
Loutre, M.F., and Berger, A., 2000, Future climatic changes: Are we entering an exceptionally long interglacial?: Climate Change, v. 46, p. 61– 90.
Marchal, O., Cacho, I., Stocker, T.F., Grimalt, J.O., Calvo, E., Martrat, B., Shackleton, N.J., Vautravers, M., Cortijo, E., van Kreveld, S., Andersson, C., Koc, N., Chapman, M., Sba, L., Duplessy, J.-C., Sarnthein, M., Turon, J.-L., Duprat, J., Jansen, E., 2002, Apparent cooling of the sea surface in the northeast Atlantic and Mediterranean during the Holocene: Quaternary Science Reviews, v. 21, p. 455-483.
Petit, J.R., Jouzel, J., Raynaud, D., Barkov, N.I., Barnola, J.-M., Basile, I., Benders, M., Chappellaz, J., Davis, M., Delayque, G., Delmotte, M., Kotlyakov, V.M., Legrand, M., Lipenkov, V.Y., Lorius, C., Pépin, L., Ritz, C., Saltzman, E., and Stievenard, M., 1999, Climate and atmospheric history of the past 420,000 years from the Vostok ice core, Antarctica. Nature, v. 399, p. 429-436.
Rahmstorf, S., 1999, Shifting seas in the greenhouse?: Nature, v. 399, p. 523-524. Rahmstorf, S., 1997, Ice-cold in Paris: New Scientist, v. 153, 08 February.
Renssen, H., Goosse H., and Fichefet, T., 2002, Modeling the effect of freshwater pulses on the early Holocene climate: The influence of high-frequency climate variability: Paleoceanography, v. 17, p. 10.1029.
Rothrock, D.A., Yu, Y., and Maykut, G.A., 1999, Thinning of the arctic sea-ice cover: Geophysical Research Letters, v. 26,p. 3469-3972.
Schwartz, P and Randall, D., 2003, An abrupt climate change scenario and its implications for United States National Security: A report commissioned by the U.S. Defense deaprtment, October 2003, 22 p.
Seager, R., Battisti, D.S., Yin, J., Gordon, N., Naik, N., Clement, A.C., and Cane, M.A., 2002, Is the Gulf Stream responsible for Europe's mild winters?: Quarterly Journal of the Royal Meteorological Society, v. 128 (586), p. 2563– 2586.
Solignac, S., de Vernal, A. and Hillaire-Marcel, C., 2004, Holocene sea-surface conditions in the North Atlantic – contrasted trends and regi,es in the western and eastern sectors (Labrador Sea vs. Iceland Basin): Quaternary Science Reviews, v. 23, p. 319-334.
Streeter, S.S. and Shackleton, N.J., 1979, Paleocirculation of the deep North Atlantic; 150,000-year record of benthic foraminifera and oxygen-18: Science, v. 203, p. 168-171.
Veiga-Pires, C. and Hillaire-Marcel, C., 1998, U and Th isotope constraints on the duration of Heinrich events H0– H4 in the southeastern Labrador Sea: Paleoceanography, v. 14, p. 187-199.
Veiga-Pires, C. and Hillaire-Marcel, C., 1999, U and Th isotope constraints on the duration of Heinrich events H0-H4 in the southeastern Labrador Sea: Paleoceanography, v. 14, p. 187-199.
Von Grafenstein, U., Erlenkeuser, H., Müller, J., Jouzel, J., and Johnsen, S., 1998, The cold event 8200 years ago documented in oxygen isotope records of precipitation in Europe and Greenland: Climate Dynamics,v. 14, p. 73-81.
Weaver, A.J., 2003, The science of climate change: Geoscience Canada, v. 30, p. 169-187.
Weaver, A.J., Eby, M., Fanning, A.F., and Wiebe, E.C., 1998, Simulated influence of carbon dioxide, orbital forcing and ice sheets on the climate of the last glacial maximum: Nature, v. 394, p. 847-853.
Weaver, A.J., Eby, M., Wiebe, E.C., Bitz, C.M. Duffy, P.B., Ewen, T.L., Fanning, A.F., Holland, M.M., MacFadyen, A., Matthews, H.D., Meissner, K.J., Saenko, O., Schmittner, A., Wang, H., and Yoshimori,M., 2001, The UVic Earth System Climate Model: Model description, climatology and application to past, present and future climates: Atmosphere-Ocean, v. 39, p. 361-428.
White, J.W.C., 1993, Don't touch that dial: Nature, v. 364, p. 186.
Wood, R.A., Keen, A.B., Mitchell, J.F.B., and Gregory, J.M., 1999, Changing spatial structure of the thermohaline circulation in response to atmospheric CO2 forcing in a climate model: Nature, v. 399, p. 572– 575.
Wu, P., Wood, R., and Stott, P., 2004, Does the recent freshing trend in the North Atlantic indicate a weakening thermohaline circulation?: Geophysical Research Letters,v. 31(2), L02301, doi:10.129/ 2003GL018584.
Yu, E.F., Francois, R., and Bacon, M.P., 1996, Similar rates of modern and last-glacial ocean thermohaline circulation inferred from radiochemical data: Nature, v. 379,p. 689-694.