Series
Geoscience of Climate and Energy 11.
Ambient Air Quality and Linkage to Ecosystems in the Athabasca Oil Sands, Alberta1
http://dx.doi.org/10.12789/geocanj.2013.40.014
SUMMARY
In 2010, there were 91 active oil sands projects in the Athabasca Oil Sands, Alberta where the Wood Buffalo Environmental Association monitors air quality and related environmental impacts. In 2012, ambient air concentrations of sulphur dioxide, nitrogen dioxide, and ammonia did not exceed the Alberta Ambient Air Quality Objectives. There was one exceedance of these objectives for ground-level ozone, and 62 exceedances for fine particulate matter with aerodynamic diameter ≤ 2.5 microns. There were 170 exceedances of the 1-hour hydrogen sulphide / total reduced sulphur odour threshold. The number of hourly exceedances has decreased since 2009, yet odours remain a serious concern in some communities. Based on the Air Quality Health Index (ozone, nitrogen dioxide, fine particulate matter), the risk from ambient air quality to human health from some pollutants was calculated to be low 96% to 98% of the time depending upon monitoring location, moderate 1% to 3.4%, high ≤ 0.4%, and very high ≤ 0.2% of the year. In a highly regulated setting like the Alberta oil sands, it is critical for stakeholders to quantify the spatial influences of emission source types to explain any consequential environmental effects. Source apportionment studies successfully matched source chemical fingerprints with those measured in terrestrial lichens throughout the region. Forensic receptor modeling showed source types contributing to elemental concentrations in the lichens included combustion processes (~23%), tailing sand (~19%), haul roads and limestone (~15%), oil sand and processed materials (~15%), and a general anthropogenic urban source (~15%). Re-suspended fugitive dust from operations, tailings dikes, quarrying, on-road transportation, and land clearing was found to contribute enrichment to a much greater degree than the hitherto assumed combustion source type.
SOMMAIRE
En 2010, il y avait 91 projets d’extraction en cours dans les sables bitumineux de l’Athabasca en Alberta, soit dans le secteur où la Wood Buffalo Environmental Association mesure la qualité de l'air et les répercussions sur les milieux de vie. En 2012, les concentrations dans l'air ambiant de dioxyde de soufre, le dioxyde d'azote et d'ammoniac n’ont pas dépassé les niveaux fixés par l’Alberta Ambient Air Quality Objectives. Il y a eu 1 dépassement de ces objectifs pour la concentration de l'ozone au niveau du sol, et 62 dépassements pour la concentration des particules fines d'un diamètre aérodynamique ≤ 2,5 micromètres. Il y a eu 170 dépassements pour la concentration du sulfure d’hydrogène pendant 1 heure / du seuil de l’odeur total de soufre réduit. Le nombre des dépassements horaires a diminué depuis 2009, mais les odeurs demeurent un grave problème dans certaines communautés. En fonction de la Cote air santé (ozone, dioxyde d'azote, particules fines), le risque de la qualité de l'air ambiant pour la santé humaine de certains polluants a été qualifiée de faible pour 96 % à 98 % des cas selon lieu de la mesure, de modérée dans 1 % à 3,4 %, plus élevé dans ≤ 0,4% des cas, et de très élevé dans ≤ 0,2% de l’année. Dans un cadre très réglementé comme celui des sables bitumineux de l'Alberta, il est essentiel pour les parties prenantes de quantifier spatialement les répercussions des divers types de sources d'émissions dans le but d’expliquer les conséquences sur les milieux de vie. Les études d’attribution des sources ont très bien recoupé celles des empreintes chimiques des sources mesurées dans les lichens terrestres dans toute la région. La modélisation par récepteurs forensiques a montré que les types de sources qui contribuent aux concentrations élémentaires dans les lichens proviennent des procédés de combustion (~ 23%), des sables résiduels (~ 19%), des routes de transport et du calcaire (~ 15%), des sables bitumineux et des matériaux transformés (~ 15%) et d’une source urbaine anthropique générale (~ 15%). On a établi que les poussières diffuses remises en suspension provenant de l'exploitation, les digues de résidus, les carrières, le transport routier et le défrichement contribuent à l’augmentation de la concentration à un degré beaucoup plus élevé que la combustion, qu’on ne l’avait estimé jusqu’à présent.
INTRODUCTION
The Athabasca Oil Sands
1 The Alberta government created the first oil sands policy in 1962. The next year, the Great Canadian Oil Sands venture was formed. In 1967 the first commercial oil sands production was launched by Great Canadian Oil Sands (Suncor), followed in 1978 by Syn-crude. In 1971, Alberta was the first jurisdiction in Canada to create a governmental environment department (Lowey 2012). Production of oil from the oil sands has grown from 0.1 M bpd (barrels per day) in 1980, to 1.8 M bpd in 2012, and is expected to reach 4.5 M bpd by the year 2025 (Canadian Association of Petroleum Producers 2013).
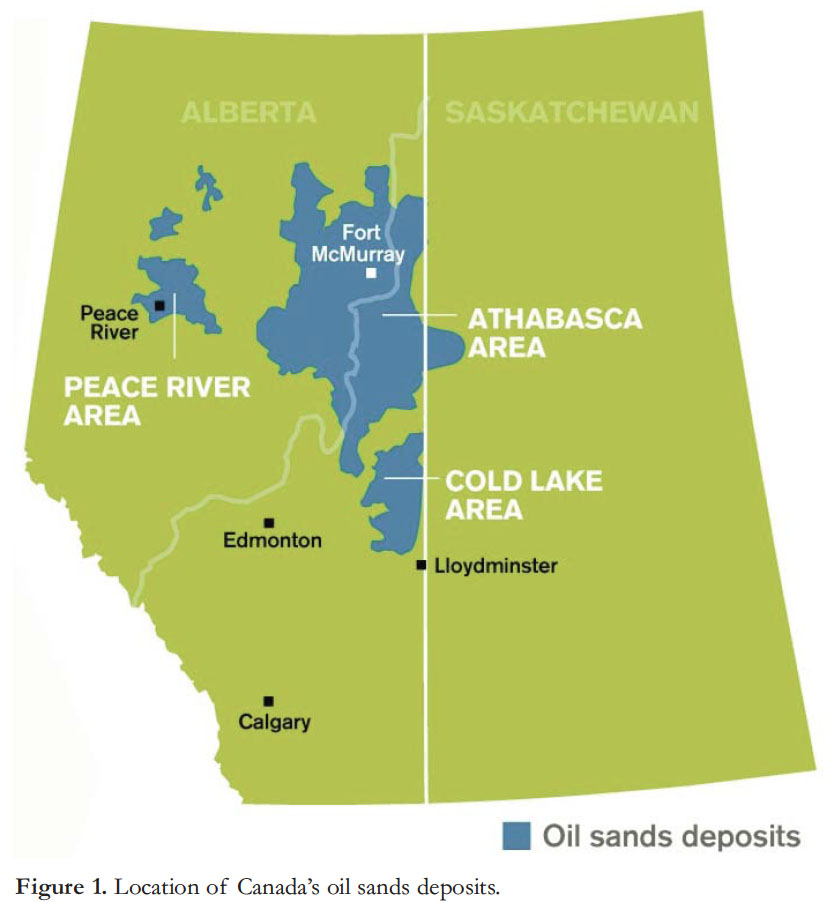
2 Oil sands are a mixture of sand, water, clay minerals and bitumen. Bitumen is oil that is too heavy or thick to flow naturally and must be mined, or drilled and recovered. Canada’s oil sands are the third largest oil reserve in the world. Non-proven reserves are estimated at 1.7 trillion barrels, of which some 169 billion barrels are economically recoverable with today’s technology. The oil sands are found in three deposits: the Athabasca, Peace River, and Cold Lake deposits in Alberta and Saskatchewan (Fig. 1), with the largest proportion in the Athabasca Oil Sands (AOS). In the AOS, bitumen (20% of the deposit) is near the surface north of Fort McMurray, and mined using large electric shovels and diesel trucks. Elsewhere, deposits (80% of the total) are found deeper underground and are recovered in situ by drilling wells and injecting steam into the reservoir to warm the bitumen so it can be pumped to the surface (Canadian Association of Petroleum Producers 2013).
3 As of July 2012, the AOS area comprised 9.3 million ha (93 000 km2), of which 75% was under lease. The surface mineable area was 475 000 ha (4750 km2) or 3% of the total area. The disturbed mineable area in 2012 was 60 200 ha (602 km2), or 12 % of the surface mineable area (Alberta Energy 2013). The Regional Municipality of Wood Buffalo (RMWB) is located in the northeast portion of the province of Alberta, Canada, extending northwards from 55°N to 60°N. The RMWB is 68 454 km2 in area, and includes the AOS. Communities in the RMWB northern region include the urban centre of Fort McMurray (Canada Census 2012, 76,009), Fort McKay, and Fort Chipewyan. In the south, are the communities of Anzac, Janvier and Conklin.
4 The RMWB climate features long, cold winters with short, warm summers. Fort McMurray airport (369 m above sea level) climate norms (1970–2000) are average daily minimum winter temperature –21.4°C (December), and daily maximum temperature 23.2°C (July). Precipitation falls mainly through convective activity in the summer. Annual total is 455.5 mm, with 342.2 mm falling as rain (Environment Canada 2013). The dispersion modeling review by Davies (2012) indicates that mixing heights reach a maximum median afternoon value during the summer at about 1500 m. The predicted maximum median value during the winter is about 225 m. Convective activity is small in scale, and the meteorological data collected at the McMurray airport are affected by proximity to the Clearwater River Valley, so extrapolation of airport measurements are likely not representative of the AOS.
5 Topography, terrain, and surface features are well known to affect the mixing, transport, and the dispersion of source emissions to air. Surface features (e.g. vegetation canopies) influence surface energy balances, atmospheric turbulence, and dry deposition processes. The valleys have a strong effect on surface wind flow patterns in the RMWB. As shown in Figure 2, the Athabasca River flows from the southwestern portion towards Fort McMurray, and then turns abruptly north and flows some 280 km north into Lake Athabasca. The Clearwater River flows from the east in Saskatchewan, and joins the Athabasca River at Fort McMurray. Existing industry mining and associated upgrading operations are in or near the Athabasca Valley north of Fort McMurray, and at elevations between 350–380 m above sea level (asl). Along with the valleys, the RMWB terrain generally features higher elevations to the south and mid-west, with lowest elevations in the northeast (Fig. 2). Birch Mountain, west of the Athabasca River, rises to an elevation of over 800 m asl. Muskeg Mountain, near the centre-east, has elevations of over 650 m asl. The land cover types based on the Earth Observation for Sustainable Development of Forests (EOSD) initiative by the Canadian Forest Service and the Canadian Space Agency are shown in Figure 3. The AOS region includes mostly Boreal Plains Ecozone, with some Canadian Shield intruding into the extreme northeast. Approximately 44% of the surface is comprised of coniferous forest, 15% broadleaf forest, and 1% mixed forest. Wetlands comprise 19% of the domain, including large fens, along with herbs (7%) and shrubs (5%). Approximately 7% of the surface is open water.
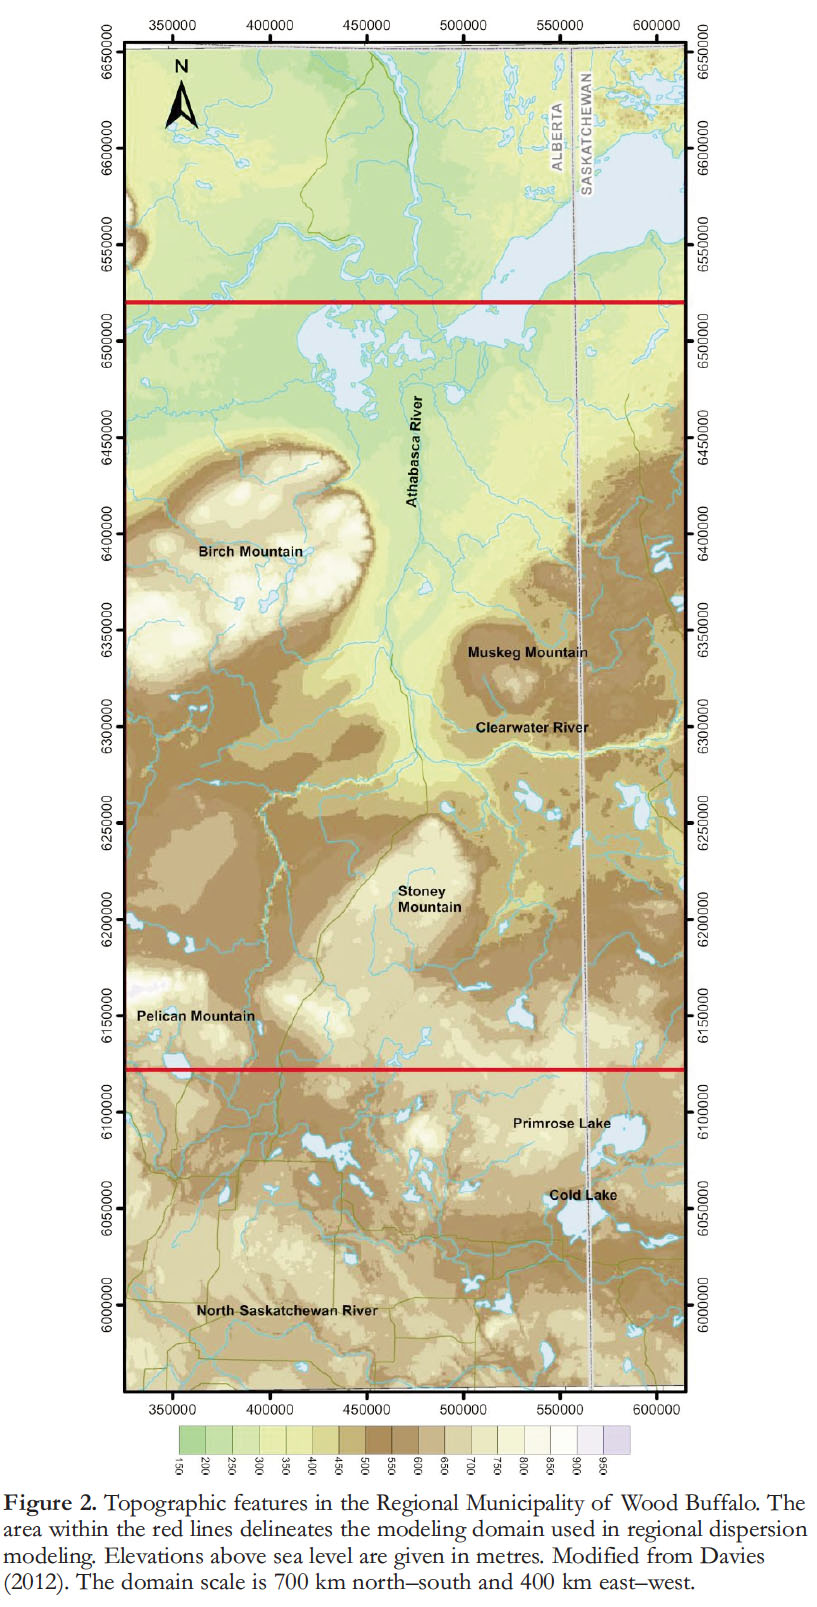 Display large image of Figure 2
Sources of Emissions to Air
6 When considering air quality, it is important to understand the scale and type of combustion and non-combustion emission sources within the AOS. According to Davies (2012), combustion sources that produce sulphur (S) and nitrogen (N) emissions to air, apart from forest fires, include: 1) stacks (gas-fired heaters and boilers, gas-fired combustion turbine co-generation, coke-fired power plants, and reciprocating engines); 2) mines (combustion exhaust from diesel-powered fleets); and 3) non-industrial sources (community and on-road sources). Non-combustion sources include fugitive emissions from: 1) processing operations (small leaks associated with valves, pipe fittings, seals and vents); 2) mine areas (exposed mine faces yielding hydrocarbons and dust); and 3) tailings ponds (substantial source of hydrocarbons, potentially reduced sulphurs, and re-suspended dust). Biogenic volatile organic compound (VOC) emissions from the surrounding boreal forest can be substantial in certain periods of the growing season, and participate in secondary photochemical reactions in the atmosphere.
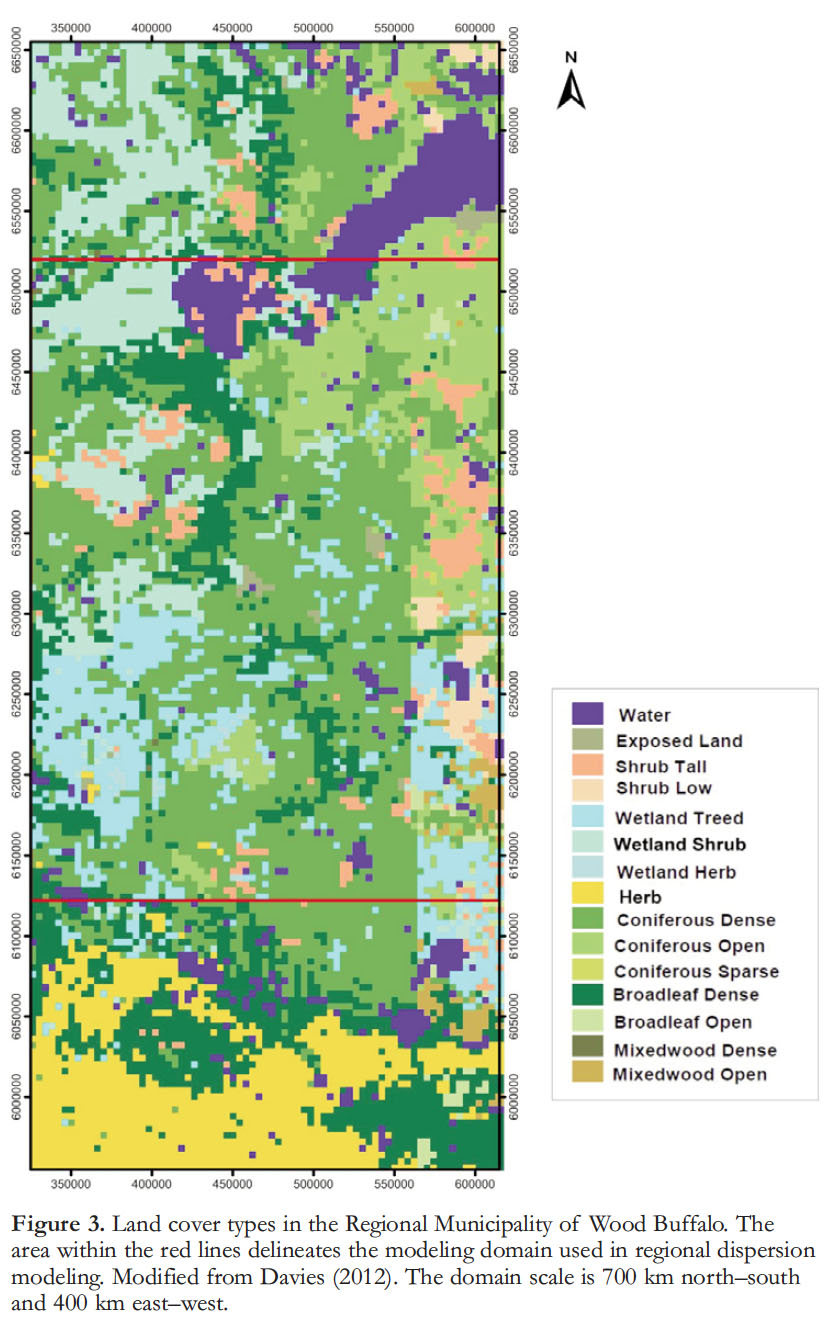 Display large image of Figure 3
7 Over the period 2003 to 2008, sulphur dioxide (SO2) emissions ranged between 274 tonnes/day (t/d) and 314 t/d. Nitrogen oxide (NOx) emissions increased from 148 t/d to 200 t/d over the same period. Air emissions in the AOS in 2010 were listed by Frontier Oil Sands Mine Project (Canadian Environmental Assessment Agency 2011). NOx emissions totalled 310 t/d apportioned among stacks (68.2%), mine fleets (24.2%), and non-industrial (7.6%) source types (Table 1). Sulphur dioxide (SO2) emission rates totalled 364 t/d, apportioned almost completely (99.3%) to stacks. Carbon monoxide (CO) emissions were 290 t/d; from stacks (55.9%), off-road mine (1.0%) and on-road/non-industrial (27.3%) sources. Fine particulate matter (PM2.5) emissions were 18 t/d; 73.9% from stacks, 15.8% from mine fleets, and the rest from non-industrial sources. VOC emissions were 249 t/d; tailings areas (49.5%), mine faces (24.1%) and operations fugitives (18.1%) were the largest contributors. Emissions of total reduced sulphur (TRS) which may contribute to odours, were 5.7 t/d; mainly from tailings areas (49.6%) and other fugitive emissions (34.9%) (Table 1).
8 Frontier Oil Sands Mine Project (Canadian Environmental Assessment Agency 2011) listed emissions from developments currently operating (existing) (Table 1). For a comprehensive source of emissions information by oil sands facility, the reader is referred to the National Pollutant Release Inventory (NPRI; http://www.ec.gc.ca/inrp-npri/). The NPRI is a federally legislated, Environment Canada-administered, and publicly accessible inventory of pollutant releases that comprises two key components: 1) data reported by facilities on releases, disposals and recycling of over 300 pollutants; and 2) more comprehensive information on all sources of emissions of certain key air pollutants.
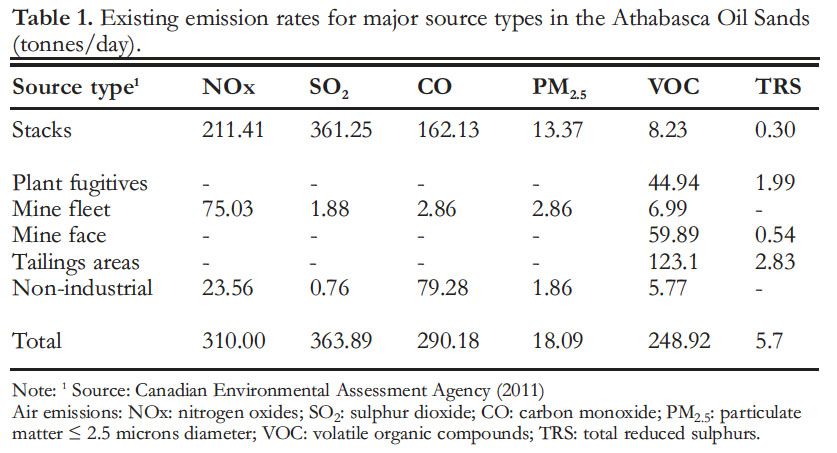 Display large image of Table 1
9 It is well known that the estimations of emissions from individual project documentation provided through the Environmental Impact Assessment (EIA) process contain conservative assumptions. Usually, the highest degree of confidence is placed in stack emission data as they are supported by continuous emission measurements. Fugitive and mobile source emissions data usually have a much lesser degree of confidence in the prediction. While emission characterization is routinely conducted by industry operators to comply with government approvals, most certification and compliance methods have not been adapted to changes in emissions processes and controls, nor have they incorporated advances in measurement technology (Watson et al. 2012). ‘Real-world’ emissions characterization generates data in part by cooling the emissions to ambient temperatures, such as the hot ducted exhaust from stacks and mobile sources such as mine heavy haulers, prior to measurement to better approximate emissions as they appear in the atmosphere. Recently, work by Watson et al. (2012) and Wang et al. (2012) has established ‘real-world’ emission rates, and emission factors for stationary and mobile sources with an extensive list of inorganic and organic pollutants, including major gaseous and particulate (mass fractionation/chemical speciation) compounds, as well as VOC, polycyclic aromatic hydrocarbons (PAHs), and trace elements. With industry cooperation, these authors have completed several years of measurement in the AOS, including the first-ever portable on-board emissions measurement of the world’s largest, 400 ton mine heavy haulers while operating in the mines.
10 The AOS has been the subject of intensified public and scientific debate over the last five years. Scientific papers by Kelly et al. (2009, 2010) led to the convening of federal and provincial panels focused on the adequacy of water monitoring. These panel reports (Environment Canada 2010; Alberta Environmental Monitoring Panel 2011) later led to the February 1, 2012, announcement of the Joint Canada–Alberta Implementation Plan for Oil Sands Monitoring (JOSM). Since then, Wiklund et al. (2012) have reported on a decline in the far-field delivery of four trace elements including mercury (Hg) and arsenic (As) to the Peace-Athabasca Delta since the onset of development. Kurek et al. (2013) reported on an increase in PAHs in lake sediments since AOS development. The purpose of this paper is to review air quality in the AOS within the context of air emissions from natural and anthropogenic sources, and the industrial development occurring within the Regional Municipality of Wood Buffalo.
AIR QUALITY MEASUREMENT IN THE ATHABASCA OIL SANDS
History
11 The United States Environmental Protection Agency defines ambient air as ‘that portion of the atmosphere, external to buildings, to which the general public has access.’ Prior to 1998, ambient air quality monitoring in the AOS was conducted by the oil sands operators at the time, Suncor and Syncrude, in accordance with each company’s approval to operate as granted by the regulator, Alberta Environment. The first three continuous air-monitoring stations (AMS) in the region were established by Suncor in 1975 (Phillips 2010). Air-monitoring stations AMS 3, 5, and 11 (Fig. 4) were installed close to its operation. Industry stations are located in areas where maximum ambient concentrations from specific projects are predicted from atmospheric dispersion modeling. Their purpose is to determine if Alberta Ambient Air Quality Objectives (AAAQO) are being met. In 1977, Syncrude established AMS 4 and AMS 2 close to its operation. Also in 1977, Alberta Environment established AMS 7 as a community health station in Fort McMurray in order to measure human exposure to ambient air.
12 From 1975 to 1980, the Alberta Oil Sands Environmental Research Program (AOSERP) carried out surveys and research aimed at identifying the long-term impacts of oil sands development on land, water, air, and human systems. For air monitoring, AOSERP focused on development of an air quality model. Three years of air data from three stations (one is operating now as AMS 7, Fig. 4) established for the program were used to gather data over a large area, supplemented by the five existing industry stations closer to the Suncor and Syncrude operations. An air quality report by Strosher (1978) is available. In 1983, Alberta Environment established AMS 1 to address concerns in the First Nation and Métis community 63 km north of Fort McMurray.
13 In late 1997, the Wood Buffalo Environmental Association (WBEA) was created. The origins of WBEA can be traced back to the early 1990s when concerns were raised by Fort McKay First Nation about the environment related to the operation of oil sands plants. According to the Clean Air Strategic Alliance (www.casahome.org), WBEA was at that time the second air-shed set up within Alberta. In 1998, WBEA assumed responsibility for ambient air quality monitoring in the oil sands region (RMWB). WBEA is an independent, community-based, multi-stakeholder, not-for-profit association based in Fort McMurray. WBEA (www.wbea.org) “...monitors air quality, and air quality related environmental impacts to generate accurate and transparent information which enables stakeholders to make informed decisions.“ It does this through an extensive network of continuous, time-integrated, and passive air quality monitoring techniques as well as through its terrestrial environmental effects monitoring program. Among its nine core values are the utilization of best practices, open and transparent communication, and consensus-based decision making.
14 In 1998, due to concerns in the Fort Chipewyan community some 220 km N of Fort McMurray, Syn-crude established AMS 8 as a background station (Fig. 4). Background stations are located in areas largely unaffected by industrial emissions. Also in 1998, a second station AMS 6 was added in Fort McMurray following a WBEA strategic review. Since 1998, six stations have been added as new oil sands projects appeared: three industry stations, AMS 10 by Albian Sands, AMS 12 by Suncor (close to truck and shovel operations), and AMS 15 by Canadian Natural Resources (CNRL) close to its operation; AMS 10 was relocated due to planned mining activity in 2009 and was re-designated AMS 16. Two attribution stations are included in the WBEA network: AMS 9 was established by Albian Sands in 2000, and AMS 13 by Syncrude in 2002. These were both installed due to Fort McKay community concerns. Their purpose is to determine the specific oil sands operation responsible for an air quality event. Another station (AMS 14) was added by Nexen as a regulatory requirement, and to address Anzac community concerns.
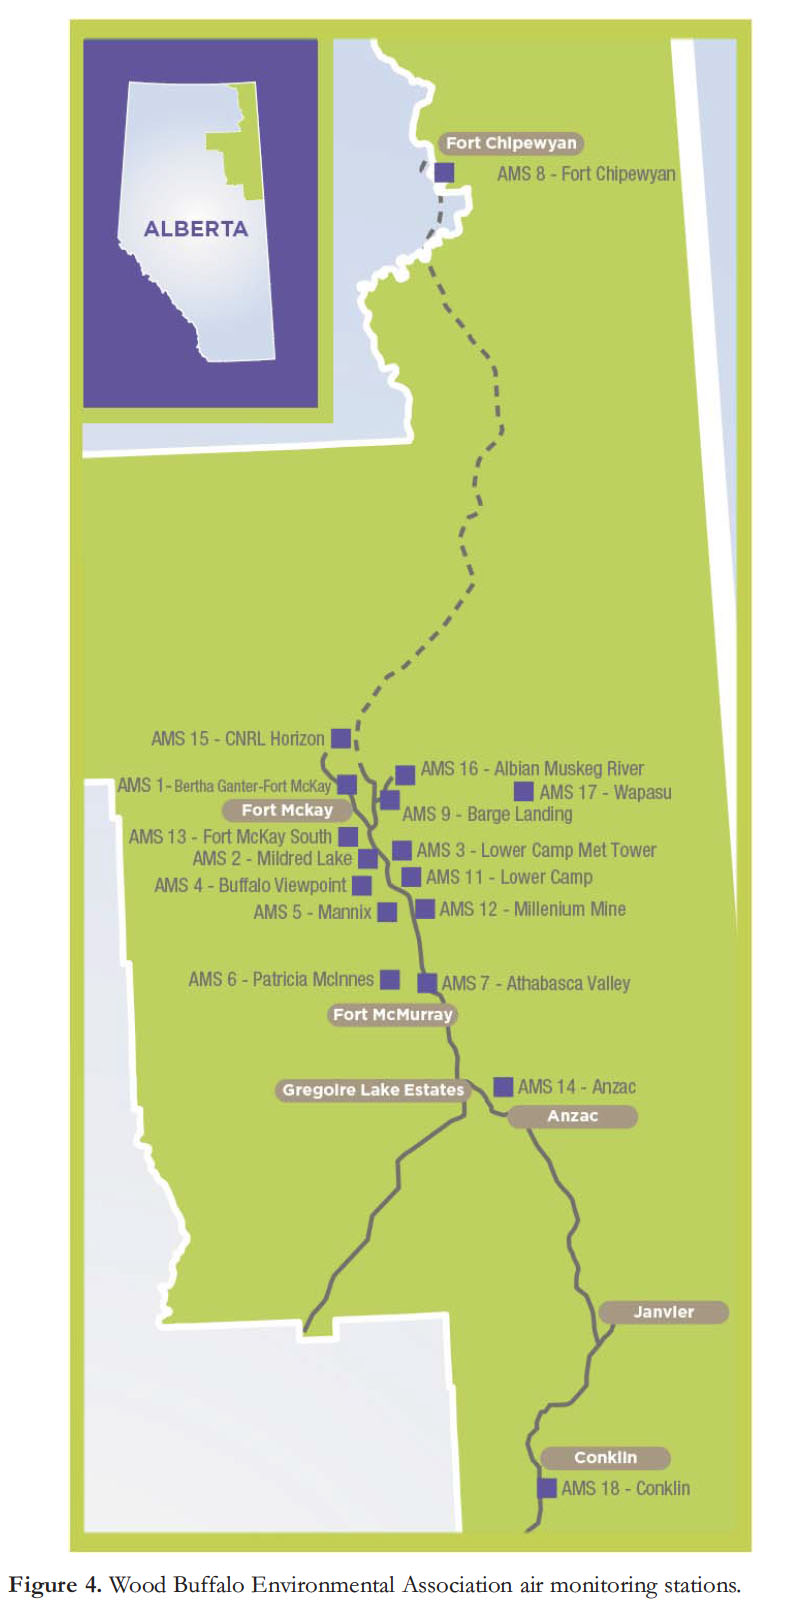 Display large image of Figure 4
15 As can be seen, ambient air quality monitoring has been ongoing in the AOS since shortly after the first oil sands operations. Quality assured/controlled data (back to 1982) are available for public download through the Clean Air Strategic Alliance data warehouse (http://www.casadata.org/). The extent and intensity of monitoring has evolved considerably with the scale of industrial development. Until recently, monitoring has been driven in the main by regulatory requirements set by the Government of Alberta. In 2011, WBEA commissioned two external experts (former managers of Environment Canada and United States Environmental Protection Agency national air quality networks) to conduct a thorough peer review (Dann and Edgerton 2012) of the existing network within the context of WBEA member requirements, and a range of external drivers such as the Canadian Council of Ministers of the Environment (CCME) Air Quality Management System, Joint Canada–Alberta Plan for Implementation of Oil Sands Monitoring (JOSM), and Government of Alberta regional land use plans. This assessment recognized the need for more regional monitoring, and chemical speciation of particulate matter for source attribution, amongst other key requirements, and members moved to sanction this work prior to implementation of the JOSM. WBEA expects to continue to adapt to meet members’ needs, as well as new challenges, including development, government policies, and regulatory expectations.
Continuous Monitoring
16 By the end of 2013, WBEA plans to have two additional air-monitoring stations in operation. These will be located in the mid-eastern AOS area near the Sunrise project (AMS 17), and at the far southern part of the airshed, in Conklin (Fig. 4). Both stations will also be equipped to operate as enhanced deposition stations under JOSM. Further, these new stations will be fully digital. Also by 2014, WBEA will have four fully equipped portable monitoring stations, for shorter term, locations-specific monitoring purposes. WBEA will continue to operate a well-equipped mobile monitoring station that is dispatched on short notice to measure air pollution episodes, or at WBEA member request. This extensive network is supported by Fort McMurray-based staff of 15 senior air quality specialists and technicians. The newly built WBEA Field Operations Centre has large drive-in bays, instrument shops, calibration gas NIST certification facility, and other required support services.
17 Air pollutants continuously measured now by WBEA in the air network include SO2 , H2S, TRS, nitrogen oxides (NO, NOX , and NO2), ammonia (NH3), total hydrocarbons (THC), methane/non-methane hydro-carbons (CH4/NMHC), PM2.5, O3, and carbon monoxide (CO). Meteorological parameters, including barometric pressure, relative humidity, temperature, wind speed/direction, surface wetness, and solar radiation are also measured (Table 2). SO2 is measured continuously using pulsed fluorescence gas analyzers, operated on 0 to 1000 ppb range. The minimum detection limits (MDLs) observed under field conditions vary from 0.5 to 1 ppb. Chemiluminescence gas analyzers are utilized for measurements of NO, NOx, and NO2 . These analyzers are operated on 0–500 ppb and 0–1000 ppb ranges. The MDLs observed under field conditions range from 0.5 ppb to 1 ppb. Ground-level O3 is measured using a UV photometric analyzer operated on a range of 0–500 ppb with a MDL of 1 ppb. Ammonia is measured using chemiluminescence technology analyzers with three active channels NO, NOx, and total nitrogen (Nt). The range settings are from 0–500 ppb for NO and NOx, and 0–5000 ppb for Nt channels. The MDL is 1.0 ppb. Total hydrocarbons are measured using flame ionization detector (FID) operated on a 0–25 ppm range, with a MDL of 0.1 ppm. Methane and NMHC are co-measured using a back-flush chromatography system that provides a direct measurement of non-methane hydrocarbons. The MDLs are 0.050 ppm for CH4, and 0.050 for NMHC as propane. Hydrogen sulphide and TRS are measured with pulsed fluorescence gas technology that detects SO 2 formed by the catalytic conversion of hydrogen sulphide or sulphur compounds. Analyzer ranges are set at 0–100 ppb. MDLs are 0.2 ppb for the trace level analyzers, and 0.5 ppb for non-trace.
18 Until 2012, WBEA utilized the common filter/microbalance-based technology to measure PM2.5 mass. In 2012, WBEA replaced these analyzers with beta attenuation synchronized hybrid ambient real-time particulate (SHARP) technology. The SHARP range is set at 0–1000 µg m–3, a much greater upper limit range than the filter/microbalance method. The MDL on these analyzers is 1 µg m–3. With a requirement for WBEA instruments to report continuously during air pollution events, including forest fires, the network is now better equipped to measure during extreme concentrations of fine particulate, including in forest fire smoke, as was experienced in 2011 due to the 700 000 ha Richardson fire.
19 The predominant form of Hg in the atmosphere is gaseous elemental mercury (GEM) comprising some 95–97% of the airborne Hg. The remainder exists in the atmosphere as inorganic reactive gaseous mercury (RGM), and particulate-bound mercury (PHg) (Lin and Pehkonen 1999). As no continuous ambient air Hg data were available in the AOS, WBEA proactively approached Environment Canada for assistance with Hg monitoring. Since October 2010, Environment Canada–Meteorological Service of Canada (MSC–Edmonton) has measured total gaseous mercury (TGM) on a continuous basis from WBEA’s Patricia McInnes air-monitoring station (AMS 6). In late 2012, a second TGM instrument was installed in the Athabasca Valley at AMS 11 (Fig. 4). The gaseous mercury analyzer captures atmospheric mercury on gold traps, followed by thermal desorption and cold vapour atomic fluorescence spectroscopy detection. The analyzer has a MDL of 0.1 ng m–3 . MSC in August 2013 installed a speciated Hg instrument at WBEA AMS 4. MSC also operates a continuous BTEX instrument at WBEA AMS 1 Bertha Ganter-Fort McKay.
20 Environment Canada Science and Technology Branch has operated wet and dry-deposited polycyclic aromatic compound (PAC) collectors at WBEA AMS 5, AMS 11, and AMS 13 (Fig. 4) since November 2010. They also collect PAH passively at nine WBEA passive towers in the boreal forest (Fig. 5), and co-located at WBEA continuous monitoring stations (Harner et al. 2013). Under a Memorandum of Understanding signed in 2010, WBEA provides daily, on the ground, technical support for instrument and analyzer operations.
21 All WBEA stations collect continuous meteorological measurements at 10 m above ground. In addition, WBEA operates two tall towers (AMS 3 and 5) with data collected (including vertical wind profiles) at tower levels up to 167 m above ground level. Their purpose is to construct a profile of meteorological conditions for use in regional dispersion modeling. In 2013, WBEA initiated continuous fog and visibility measurements above the Athabasca Valley (AMS 4) and, within near line of sight, in the valley (AMS 11).
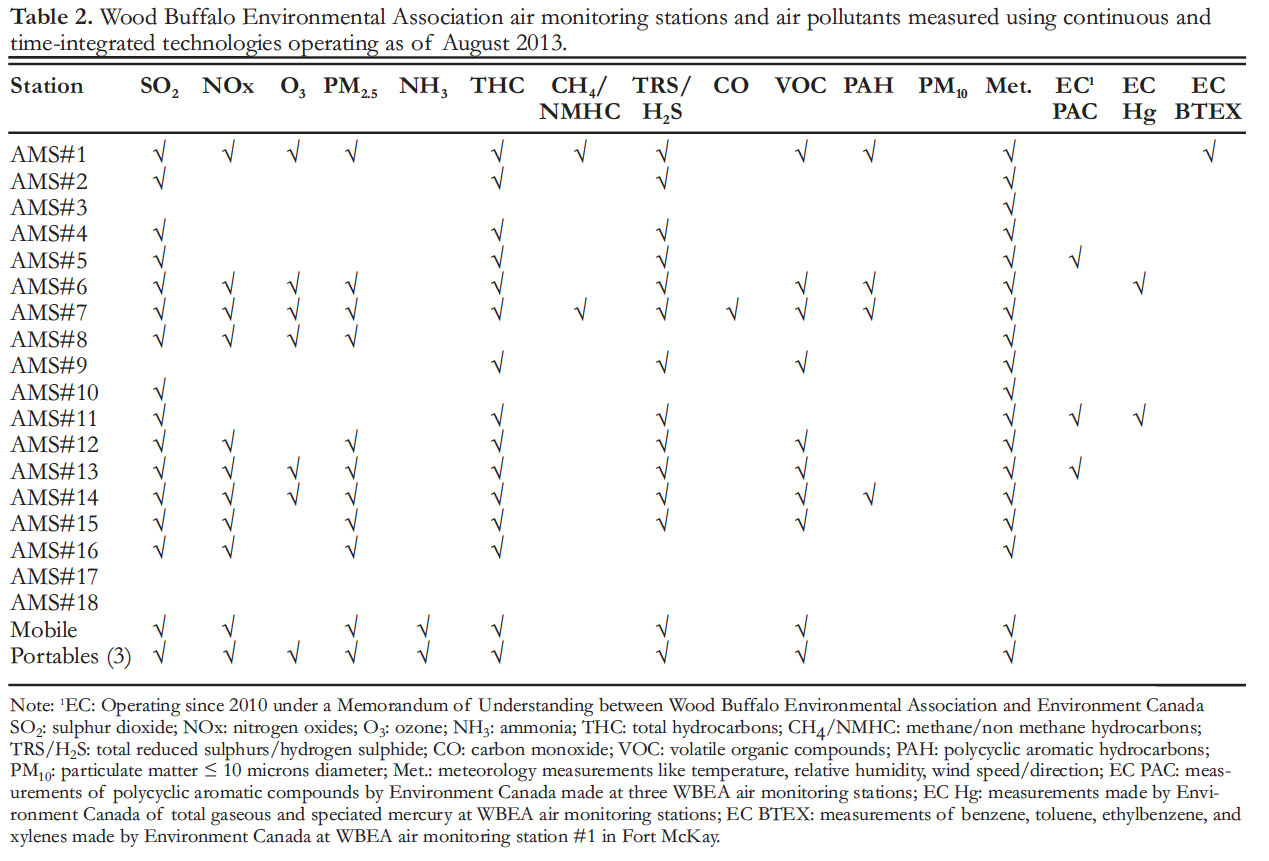 Display large image of Table 2
Time-integrated Measurements
22 In addition to continuous monitoring, WBEA also carries out a very large time-integrated sampling program. The integrated sampling program includes measurements of particulate matter mass with aerodynamic diameters equal to or less than 10 µm (PM10) and equal to or less than 2.5 µm (PM2.5), heavy metals in PM, VOC, reduced sulphur compounds (RSC), and PAH (Table 2). Measurements for PM10 in the WBEA network are taken every sixth day for a 24-hour period. The sampling schedule and procedures are consistent with Environment Canada’s National Air Pollution Surveillance Program (NAPS, http://www.ec.gc.ca/rnspa-naps/). The filters are analyzed for gravimetric mass, metals speciation for 21 elements and base anions and cations. VOCs and RSC are automatically sampled using 6.0-litre evacuated canisters. Sixty target VOCs, and 20 RSC compounds are analyzed using gas chromatography–mass spectrometry (GC–MS) techniques (Alberta Innovates and Technology Futures, Vegreville, AB). Beginning in 2012, WBEA adopted Environment Canada’s NAPS sampling protocols. Ambient air samples are collected over 24 hours, every sixth day. MDLs are 0.03 to 2 ppb depending upon the compound, and 1 ppb for the RSC.
23 PAHs are sampled using a combination of polyurethane foam cartridges and XADTM resin adsorbents. The United States Environmental Protection Agency SW-846 METHOD 3630C (United States Environmental Protection Agency 1999, 2000) is used to clean samples prior to GC–MS analysis at Airzone, Mississauga, Ontario. Recoveries ranged from 87% for naphthalene to 92% for benzo(ghi)perylene. Precision of analysis, based on deuterated compounds introduced at the extraction stage ranged up to 18% relative standard deviation (RSD). MDLs ranged from 0.03 to 0.06 ng/m3 for naphthalene to benzo(ghi)perylene. Twenty-three PAH species in ambient air are reported by WBEA. The sampling schedule follows Environment Canada’s National Air Pollution Surveillance protocols, with samples collected for 24 hours every sixth day at the four stations.
24 Along with integrated sampling, WBEA also operates an extensive passive monitoring network located away from roads and power sources. This network of towers situated at WBEA forest health monitoring (FHM) plots and wetland sites comprises 22 locations stratified across the pollutant deposition gradient, and extending outwards 150 km from the main source area (Fig. 5). The passive samplers operate by the diffusion principle and monthly (bi-monthly in winter) average concentrations of SO2, NO2, O3, NH3, and HNO3 are reported. The purpose of this helicopter-only accessible network is to derive estimates of ecosystem exposure, when other continuous measurement technologies cannot logistically be deployed into remote areas.
25 A dichotomous sampler has been operational at AMS 1 since 2010. This instrument allows for the high quality, filter-based simultaneous sampling of PM2.5 and PM10. It is useful for air pollutant source identification as these particle size fractions have different origins. As each 24 hour filter sample has a serial number, is pre- and post-weighed (± 1 µg), filters can be stored appropriately and analyzed later for chemical speciation purposes, so as to attribute individual events to a specific source, or sources. A number of other specialized measurements are made at selected sites including continuous dual detector, pneumatically-focused gas chromatography for semi-continuous co-measurement of VOC and RSC for individual compounds (at AMS 1, O’Brien et al. 2012). A purpose-built, mobile field laboratory houses the WBEA ambient ion monitor (AIM). The WBEA AIM is only the second operating in Canada, and is used to provide semi-continuous measurements of NH3 and SO2 in addition to the precursor gases (HCl, HNO2, and HNO3), anion PM2.5 (NO3–, SO42–, NO2–, PO43–, Cl–) and cation PM2.5 (NH4+, Na+, Ca++, K+, Mg++). This ‘ion chromatography in the field’ technology has a MDL of 0.05 µg m–3 every hour. An automated sequential precipitation sampler (ASPS) with sample refrigeration in summer has cation/anion as well as Hg-sampling trains, and operates at AMS 6. An annular denuder system (ADS) is moved between stations to determine fine particle acid aerosol reactive acidic and basic gas concentrations.
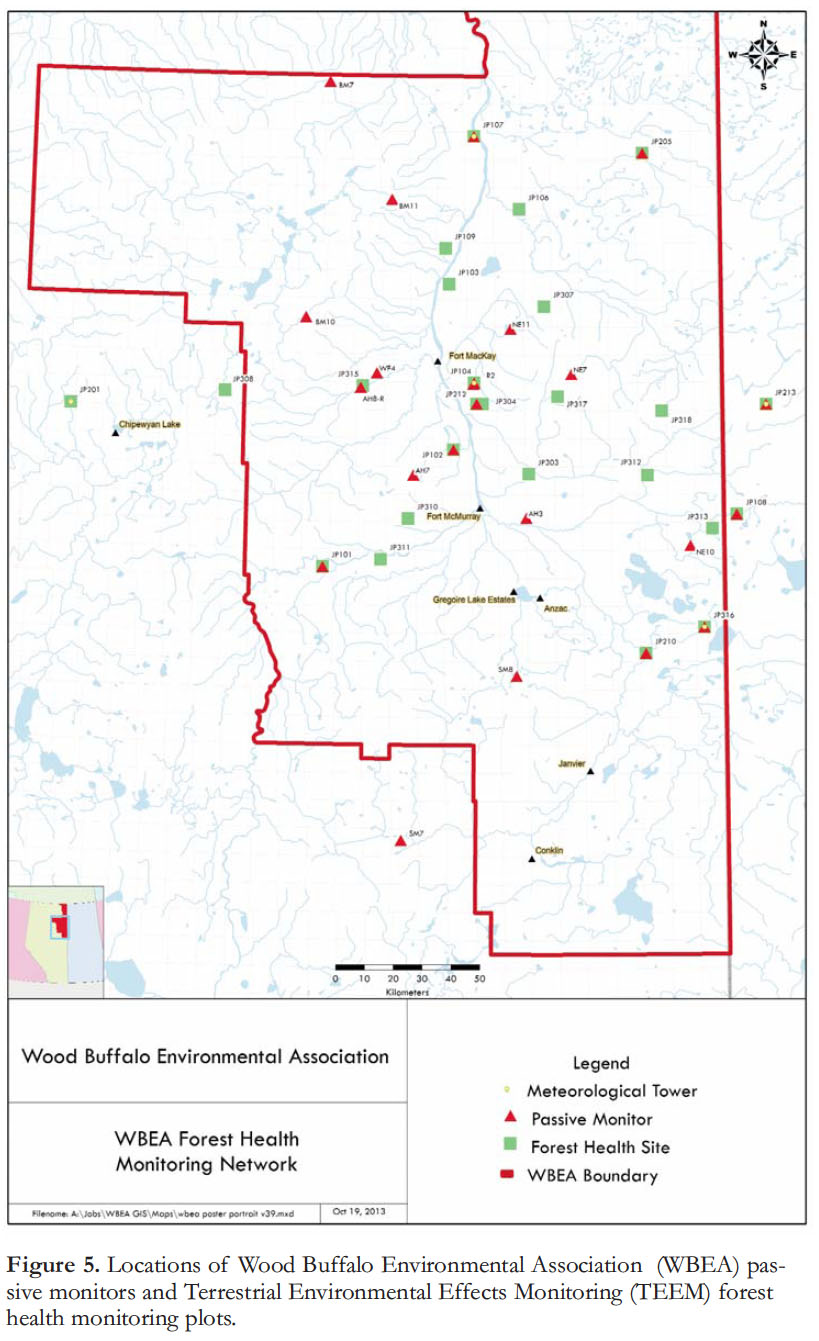 Display large image of Figure 5
AMBIENT AIR QUALITY IN THE ATHABASCA OIL SANDS
Special Studies
26 There has been a general pattern across North America of decreasing levels of S, NOx, Hg deposition, and O3 since the 1980s, although important exceptions exist. There is evidence for increasing NOx deposition across western North America, and stable or increasing NH3, while intercontinental transport of Hg from Asia to North America is rising (Hidy et al. 2011). Two recently published studies used aircraft and satellite platforms to report on atmospheric concentrations of pollutants in the AOS. Simpson et al. (2010) collected seventeen 45-second 2-litre canister samples (approximately one sample per minute) while flying on July 10, 2008, in a NASA DC-8 research aircraft in the boundary layer air above the AOS. The mixing ratios of 84 trace gases were measured with 15 compounds (including CFCs and O3 ) and compared to ‘background air’ measured on the same flight to the northwest of the AOS. Maximum enhancements detected over the AOS were for SO2 382x, NO 319x, the VOCs n-heptane 397x, n-octane 242x, and the aromatic m+p-Xylene 181x, with CH4 enhanced (1.08x) to a lesser degree.
27 Of course, one cannot absolutely compare measurements made at ground level in other locations to the boundary layer air above the AOS. However, the relative average concentrations reported by Simpson et al. (2010) above the AOS, and those reported for whole air samples at ground level by authors from the same laboratory in 28 US cities (Baker et al. 2008) were (AOS/cities): n-heptane (70 ppt/24–250 ppt), n-octane (45 ppt/8–260 ppt), and m+p-Xylene (29 ppt/28–820 ppt). In contrast to a suite of n-alkanes, the enhancement of aromatics such as benzene (7x), and in fact most VOCs in the AOS were generally relatively low, especially compared to values measured downstream at petrochemical refineries. Despite the AOS industry being a major user of natural gas, a strong natural gas signal was not identified suggesting low levels of fugitive release to the atmosphere and high efficiency of combustion in the upgrading processes (Simpson et al. 2010).
28 McLinden et al. (2012) reported on remotely sensed air column concentrations of SO 2 and NO 2 over the AOS. High resolution maps were created for an area of 30 km x 50 km over the most concentrated surface mining activities. An increase in SO2 was not found, despite bitumen production increases from about 1.0 M bpd (2005) to about 1.5 M bpd (2010). The 2005–2010 increase in vertical column density (VCD) of NO2 was assessed at 10.4 ± 3.5% per year, resulting from increases in localized values as well as spatial extent of enhancement. It is difficult to compare on the ground, continuous NO2 measurements reported by WBEA (AMS 1 and 2 specifically). However, McLinden et al. (2012) did compare relative changes between the AMS data supplied by WBEA. Satellite measurements showed an average three-year increase of 38 ± 17%, whereas ground-level data showed a 27 ± 11% increase. Relating the remotely sensed NO2 increase measured over the AOS, to other regions in Canada, the authors stated that while the enhancement was as large as that from any other individual emissions source in Canada, it is comparable to that measured over large, individual sources such as coal-burning power plants, and smaller than what was observed over large metropolitan areas. Edmonton, for instance, has NO2 VCDs that are 2–3x larger than the AOS, and cover a much larger area (McLinden et al. 2012).
29 Unfortunately, there are many years of data but few interpretive studies on trends in AOS air pollutant levels. In 2008, WBEA commissioned one analysis using hourly concentration data from eleven WBEA AMS that had been operating over a 10-year period, 1998–2007. Kindzierski et al. (2009) and Kindzierski (2010) reported no statistically significant change in hourly ambient SO2 and O3 concentrations. Statistically significant increases in hourly concentrations for NOx were observed at two stations, AMS 1 Bertha Ganter-Fort McKay, and AMS 6 Patricia McInnes in Fort McMurray (Fig. 5). These occurred typically at the higher percentile concentrations, experienced, on average, much less frequently, or not at all on any given day. According to Kindzierski et al. (2009), the data showed a diurnal pattern with concentration maxima occurring between 8 AM and noon, minima occurring between 2 and 6 PM due to atmospheric boundary layer mixing intensities and O3 scavenging. Fine particulate matter (PM2.5) concentrations either were unchanged or decreased depending upon the station. Small amounts of change in H2S/TRS and THC concentrations were reported. The authors further stated that [up to 2007] AMS 8 Fort Chipewyan air quality was unique, as it was only slightly affected by AOS sources.
Pre-1998 Continuous Measurements
30 It is instructive at this point to look back some 36 years at some short term air quality measurements, in light of the following presentation of very recent data. The AOSERP used 8 continuous monitoring stations to measure SO2, NOx, O3, THC, H2S, and total suspended particulates (TSP) in 1977. Monthly 30 minute average SO2 concentrations were 0.0–3.0 ppb (Birch Mountain), 1–8 ppb (Bitumount) 1–3 ppb Fort McMurray, 0–6 ppb (GCOS Mannix), 0–13 ppb (GCOS Mildred Lake), and 1–24 ppb (Great Canadian Oil Sands Fina Airstrip) (Strosher 1978). Monthly average NOx concentrations were 10–70 ppb (Fort McMurray) and 20–30 ppb (Bitumount). Monthly average NO2 concentrations were 10–30 ppb (Fort McMurray) and 10–20 ppb (Bitumount). Ozone monthly averages were in the 10.8 ppb to 47.6 ppb range. Monthly average THC at Fort McMurray and Bitu-mount stations ranged from 1.7 ppm to 2.68 ppm (Strosher 1978). These data are monthly averages, and no hourly data are available for comparison with the 2012 WBEA data.
Wood Buffalo Environmental Association 2012 Continuous Measurements
31 WBEA continuous air analyzers are subjected daily to remotely controlled zero/span calibrations using on-site zero air sources to adjust baseline, and EPA-certified calibration gases that span a range of pre-set concentrations. Each month, the analyzers undergo a multi-point, on-site calibration. WBEA continuous data then undergo a rigorous quality control procedure and are fully available to both WBEA members and the general public, four weeks after month’s end.
32 In 2012, SO2 was measured continuously at thirteen WBEA AMS (Table 2). Highest maximum 1-hour concentrations were 106.4 ppb at community stations (AMS 14), and 149.5 ppb (AMS 13) at industry stations (Fig. 6). The Alberta Ambient Air Quality Objectives (AAAQO) 1-hour SO2 concentration (172 ppb) was not exceeded. The 99th percentile (99% of all hourly concentrations are less than the 99th) values ranged from 4.2 ppb (AMS 8) to 31.7 ppb (AMS 2).
33 NO2 was measured at nine AMS. Highest maximum 1-hour concentrations were 52.1 ppb at community stations (AMS 7), and 141 ppb (AMS 12) at industry stations (Fig. 7). The AAAQO 1-hour NO2 concentration (159 ppb) was not exceeded. The 99th percentile values ranged from 11.4 ppb (AMS 8) to 42 ppb (AMS 12).
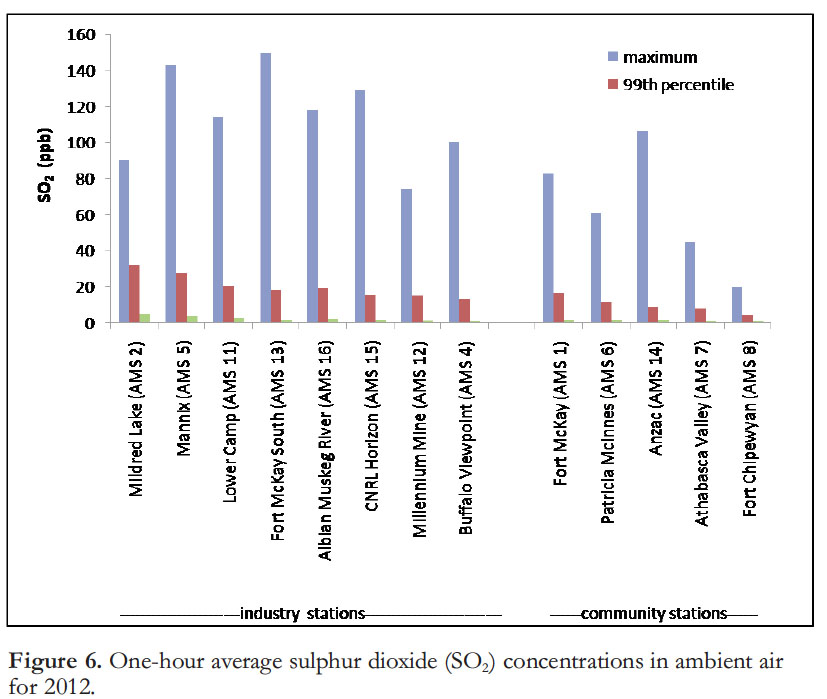 Display large image of Figure 6
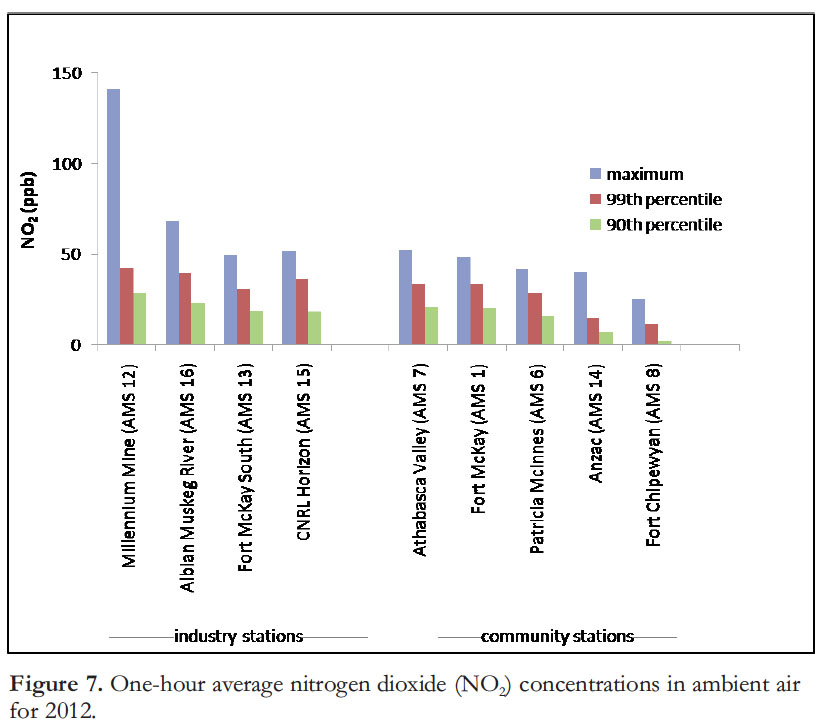 Display large image of Figure 7
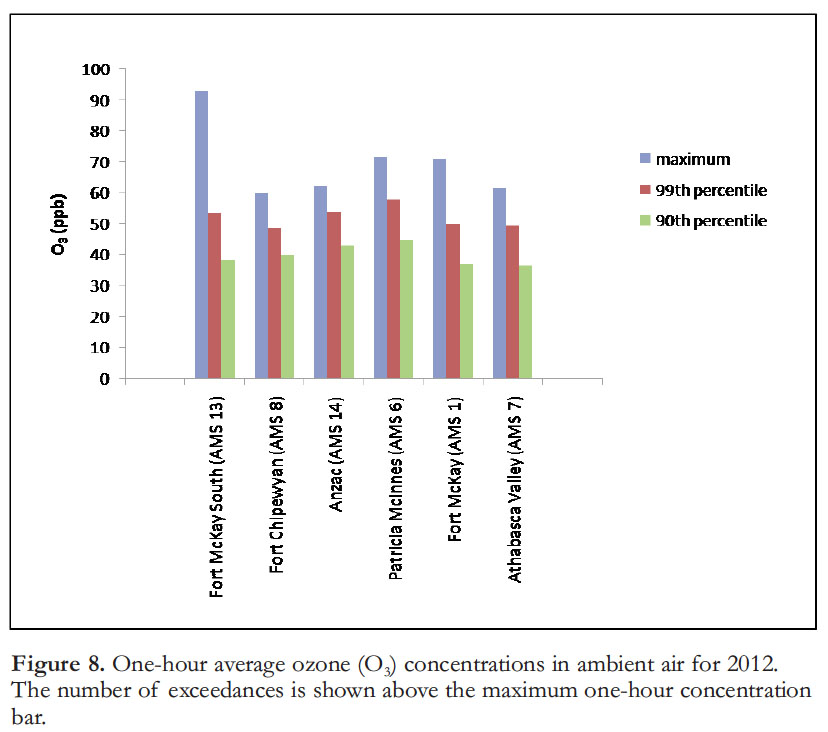
34 Ozone was measured continuously at six AMS. Highest maximum 1-hour concentrations were 71.7 ppb at community stations (AMS 7), and 93ppb (AMS 13) at industry stations (Fig. 8). The 1-hour AAAQO for O3 of 82 ppb was exceeded once in 2012 (AMS 13).
35 In 2012, WBEA continuously measured H2S at four stations, and TRS at eight stations. Maximum 1-hour average concentrations were 86.9 ppb (AMS 1) at community stations and 69.8 ppb TRS (AMS 13) at industry/attribution stations (Fig. 9). The one-hour AAAQO (set as an odour threshold) of 10 ppb H2S or TRS was exceeded 170 times in 2012. There were 4 at community stations (2 each at AMS 1 and 14), and 166 at industry/attribution stations (82 at AMS 5; 58 at AMS 2). The 99th percentile values ranged from 1.4 ppb (AMS 14) to 10.2 ppb (AMS 5).
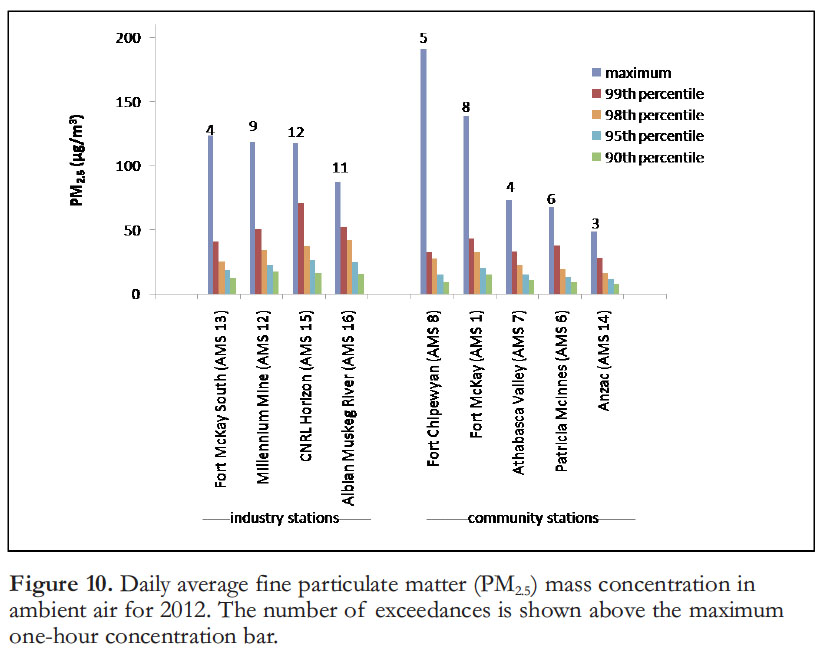
36 Fine particulate matter was measured at nine stations. Maximum 24-hour averaged PM2.5 concentrations were 1224.5 µg m–3 (AMS 8) at community stations, and 460 µg m–3 (AMS 16) at industry/compliance stations (Fig. 10). The AAAQO 24-hour for PM 2.5 was exceeded at least once at all stations. The 98th percentile values ranged from 16.2 µg m–3 (AMS 14) to 42.2 µg m–3 (AMS 16). Highest daily maximum and 98th percentile concentrations were associated with controlled biomass burning, forest fires, or on-road transportation.
37 NH3 was measured continuously at two stations, AMS 1 and AMS 6. Maximum one-hour NH3 concentrations in 2012 were 64 ppb (AMS 1) and 34 ppb (AMS 6). Both these values were above the 99th percentile value.
Wood Buffalo Environmental Association Time-Integrated Measurements
38 In 2012, the ten VOCs having the greatest concentrations averaged across the four community stations (AMS 1, 6, 7, and 14) were (mean ± 1SD): methanol (10.8 ± 16.4 ppb), acetalde-hyde (5.0 ±6.7 ppb), beta pinene (2.0 ± 1.8 ppb), acetone (2.5 ± 2.3 ppb), methyl ethyl ketone (3.2 ± 0.9 ppb), cyclohexane (3.2 ± 0.9 ppb), butane (1.4 ± 1.5 ppb), isoprene (1.1 ± 1.0 ppb), naphthalene (0.9 ± 1.1 ppb), and 1-butene (1.0 ±2.1 ppb). Mean concentrations of the other 50 target VOCs were ≤ 0.56 ppb. The ten most frequently measured VOCs at the community stations were: benzene (227x), isopentane (214x), toluene (205x), butane (198x), acetone (194x), isobutane (185x), methanol (147x), 2-methylpentane (142x), hexane (130x), and 3-methylpentane (128x).
 Display large image of Figure 8
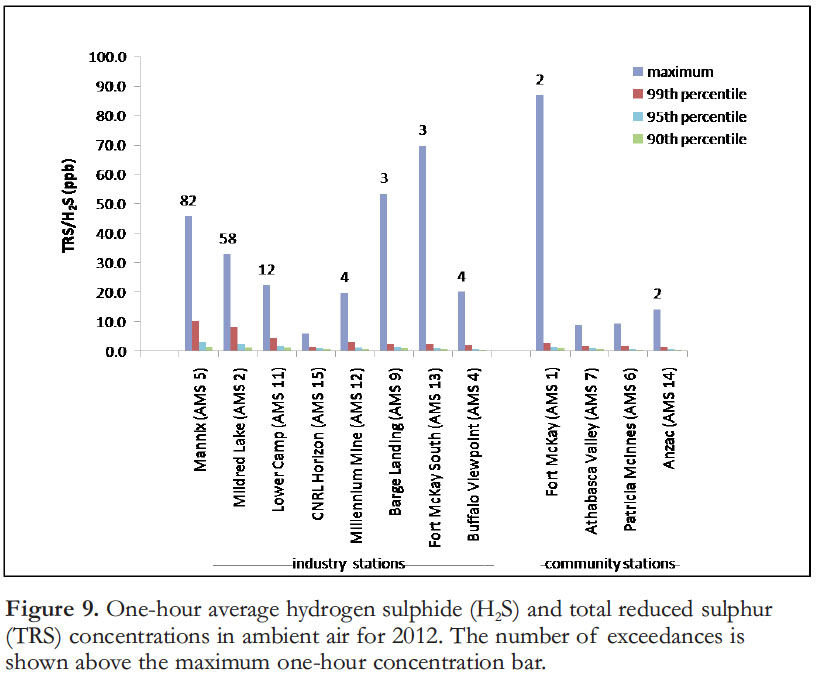 Display large image of Figure 9
39 Mean concentrations for 2012 averaged across four industry stations (AMS 9, 12, 13, and 15) exhibited similarities in compound and range: methanol (9.5 ± 8.8 ppb), acetaldehyde (5.6 ± 5.8 ppb), beta pinene (3.0 ± 2.5 ppb), acetone (2.4 ± 1.9 ppb), methyl ethyl ketone (1.5 ± 2.1 ppb), isoprene (1.0 ± 1.0 ppb), butane (1.0 ± 0.9 ppb), isobutane (1.7 ± 10.0 ppb), isopentane (0.7 ± 0.7 ppb), and pentane (0.6 ± 1.0 ppb). The ten most frequently measured VOCs at the industry stations were: benzene (218x), isopentane (201x), toluene (182x), acetone (177x), butane (173x), isobutane (169x), 3-methylpentane (144x), methylcyclohexane (135x), 2-methylpentane (134x), and hexane (127x).
40 In 2012, the most frequently measured RSC at the four community and four industry stations were: carbonyl sulphide (406x), carbon disulphide (80x), H2S (52x), dimethyl disulphide (4x), methyl mercaptan (2x), and 2,5-dimethyl thiophene (1x). The other 15 target RSCs were not detected. Maximum 24-hour average RSC concentrations (mean ± 1SD) at community stations were: carbon disulphide (1.0 ± 1.3 ppb), carbonyl sulphide (0.8 ± 0.5 ppb), H2S (0.4 ± 0.4 ppb), and methyl mercaptan (0.5 ± 0.1 ppb). Maximum 24-hour concentrations were highest at AMS 1 Bertha Ganter-Fort McKay for carbon disulphide at (6.0 ppb), carbonyl sulphide (3.0 ppb), and H2S (2.0 ppb), and dimethyl disulphide (0.2 ppb). They were highest at AMS 13 Fort McKay South for dimethyl disulphide (0.4 ppb). Maximum concentrations were highest at AMS 6 Patricia McInnes for methyl mercaptan (0.6 ppb), and 2,5 dimethyl thiophene at (0.1 ppb).
41 WBEA VOC/RSC protocols for 2012 specified 24 hour samples collected on a six day cycle (i.e. Environment Canada’s National Air Pollution Surveillance Program protocols). Like the Environment Canada program (urban focus), the WBEA purpose is not to target individual air pollution events, such as short term odour episodes, but rather to characterize ambient air quality for compliance and other purposes. The Fort McKay community operates an event-based canister-sampling campaign set to measure when odours are present. Canister samples collected on May 11, and on June 1, 2010, during odour incidents indicated there were differences in compounds detected between the two events. Dimethyl disulphide (DMDS), thiophenes and allyl sulphide were detected in one event, but not in the other. Acetaldehyde was stated as a potential candidate odour compound (Spink and Dennis 2010).
 Display large image of Figure 10
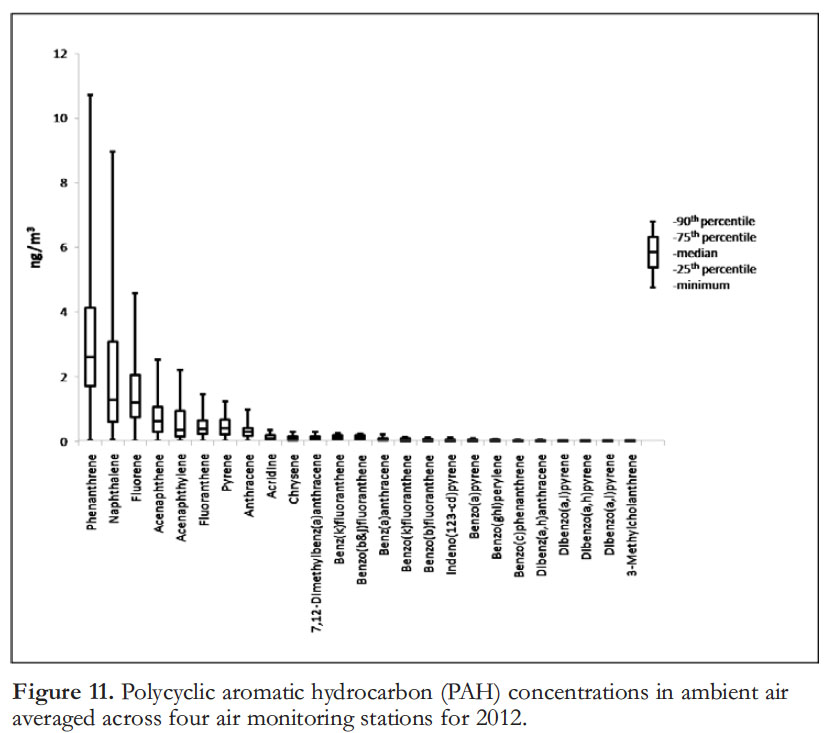 Display large image of Figure 11
42 In 2012, phenanthrene was the targeted PAH species measured in the highest concentrations and was detected at all four community stations (Fig. 11). Concentrations (mean ± 1 SD) of the PAH species averaged across the four WBEA community stations decreased in the order: phenathrene (6.15 ± 0.81 ng m–3) > naphthalene (3.34 ± 0.36 ng m–3) > fluorene (3.02 ± 0.45 ng m–3) > acenapthene (2.1 ± 0.44 ng m–3) > acenapthylene (0.91 ± 0.11 ng m–3) > fluoranthene (0.66 ± 0.06 ng m–3) > pyrene(0.56 ± 0.03 ng m –3 ) > anthracene (0.49 ± 0.05 ng m–3) > acridine (0.21 ± 0.05 ng m–3). The other 16 PAHs had mean ambient concentrations ≤ 0.12 ng m–3. Mean 2012 benzo(a)pyrene concentration was 0.042 ng m–3.
43 In 2009, WBEA introduced a conditional time-averaged gradient (COTAG) approach for the in situ measurement of trace gas flux to the land surface. Cape and Famulari (2013) have been operating the COTAG instrument above open-fetch fen systems at one WBEA FHM site near upgraders/mines (JP104, Fig. 6) and one remote site (JP316). Air concentrations of trace gases SO2, HNO3, HCl, NH3 were measured from May to October 2012 at 0.25 m and 1.3 m above the fen vegetation. Fluxes were measured between 33–44% of the time.
44 At JP316, average concentrations were 0.27 µg SO2 m–3, 0.11 µg HNO3 m–3, 0.17 µg NH3 m–3, and HCl concentrations were too low to be measured. Particle concentrations averaged across the period were: 0.03 µg Na+ m–3; 0.2 µg NH4+ m–3; 0.06 µg Ca2+ m–3; 0.09 µg Cl– m–3; 0.24 µg NO3– m–3. Over the 4 months, dry deposition of HNO3 contributed 0.02 (±0.01) kg N ha–1, and SO2 contributed 0.2 (±0.08) kg S ha–1, mostly during daylight hours. Ammonia deposition was zero within measurement uncertainties of 0.06±0.08 kg N ha–1 (Cape and Famulari 2013). As expected, gas concentrations were 1–2 orders of magnitude lower at the more remote JP316 than at JP104 (as measured in 2011), nearer to sources.
ATHABASCA OIL SANDS AIR QUALITY IN RISK AND CUMULATIVE EFFECTS MANAGEMENT CONTEXTS
Air Quality Health Index
45 The Air Quality Health Index (AQHI) is a public information tool developed by Health Canada and Environment Canada, in collaboration with the provinces and key health and environment stakeholders (www.ec.gc.ca/casaqhi). The AQHI value is calculated by using a metric that combines the readings of PM2.5, NO2 and O3. In Alberta, other pollutants monitored in the province are also included when calculating the AQHI. The AQHI number presented in Alberta is based on hourly comparisons of individual pollutant concentrations to AAAQOs. If hourly air pollutant concentrations are higher than Alberta’s air quality objectives, then the AQHI value calculated is replaced with the appropriate ‘High’ or ‘Very High’ risk value. This adjustment is relevant for PM2.5, O3, NO2, SO2 and CO. In addition, the AQHI risk class will be modified if H2S and TRS concentrations exceed a specified threshold (listed in www.environment.alberta.ca/03603.html).
46 In 2012, the AQHI was measured in more than 20 communities across Alberta. These included the WBEA-monitored community stations of Fort Chipewyan (AMS 8), Bertha Ganter–Fort McKay (AMS 1), Fort McMurray Athabasca Valley (AMS 7), as well as the attribution station at Fort McKay South (AMS 13). WBEA raw air quality data are transmitted hourly to AESRD, where the calculation is made and the AQHI value then uploaded to Alberta Environment and Sustainable Resource Development (AESRD) and WBEA websites and/ mobile apps. It is noted here that the community of Fort McKay also reports its own Air Quality Index.
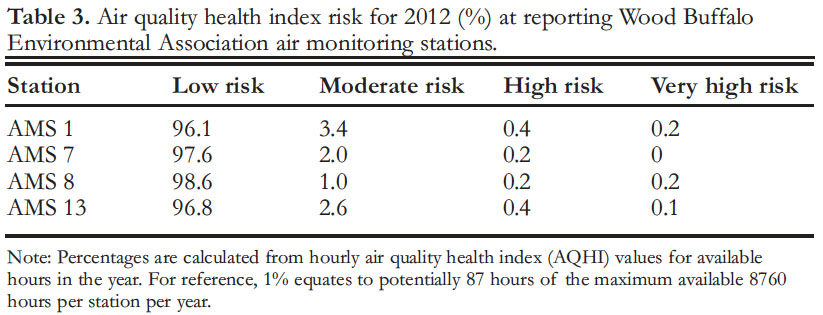
47 Air quality at the WBEA stations in 2012 presented a low health risk between 96.1% (AMS 1) and 98.6% (AMS 8) of the time in 2012 (Table 3). AQHI values presenting a moderate risk to health at WBEA stations occurred between 1% (AMS 8) and 3.4 % (AMS 1) of the time. AQHI values presenting a high health risk occurred between 0.2% (AMS 7 and 8) and 0.4% (AMS 1, and 13) of available hours. For context, 1% of available hours in any given year (8760 maximum hours) equates to 87 hours. Values presenting a very high risk to health occurred between 0.1% and 0.2% of the time at AMS 13,1, and 8. It is important to note that the pollutants used to calculate the AQHI do not include RSC and VOC that are known from WBEA’s work to contribute to odour events. Therefore, the AQHI values should not be used to evaluate a potential health risk associated with odours, nor to estimate the potential risk from the complex mix of industrial emissions in the Athabasca Oil Sands, or any other industrial area.
 Display large image of Table 3
Reporting for Cumulative Effects Management
48 On September 1, 2012, the Government of Alberta promulgated the Lower Athabasca Regional Plan, the first of seven regional plans being advanced under the Alberta Land Stewardship Act, and the Land-use Framework (Government of Alberta 2012a, b). Under the air quality management component of the Lower Athabasca Regional Plan, the government of Alberta adopted triggers for NO2 and SO2, to which WBEA air data are to be compared.
49 For the nine WBEA stations reporting NO2 in 2012 the Level 2 annual average trigger of 8 ppb would have been exceeded at three WBEA stations (AMS 7, 12, and 16). The Level 2, hourly 99th percentile trigger of 30 ppb would have been exceeded at six WBEA stations (AMS 1, 7, 12, 13, 15, and 16). Levels 3 and 4 NO 2 triggers within the RMWB were not exceeded in 2012. Potential management action by government for exceedance of a Level 2 trigger specifies ‘Surveillance’, including the determination of the need for additional monitoring (Government of Alberta 2012b).
50 In 2012, for the 13 stations reporting SO2, no stations would have exceeded the Level 2 annual average trigger of 3 ppb SO2. For the hourly 99th percentile, seven stations would have exceeded the Level 2 trigger of 12 ppb. Two WBEA stations (AMS 2 and 5) would have exceeded the percentile Level 3 SO2 trigger of 24 ppb. Potential management action by government for exceedance of a Level 3 trigger specifies “Identify pressures and measures required to prevent reaching air quality limits“ (Government of Alberta 2012b).
LINKING AIR EMISSIONS WITH ECOSYSTEM RECEPTORS
51 Changes in ambient air quality have relevance only if they may potentially affect humans, ecosystems, visibility, or structures. Ambient air is a major pathway for delivery of inorganic and organic pollutants to the AOS terrestrial and aquatic systems (~10% of AOS surface area). Clair et al. (2011) and Chow and Watson (2011) provided recent reviews of multi-pollutant air quality management including ecosystems. Until 2008, the core mandate of WBEA was air quality monitoring for compliance, attribution and community health purposes. The Terrestrial Environmental Effects Monitoring (TEEM) program had completed two cycles (1998 and 2004) of acid deposition monitoring in forest systems, along with stakeholder-supported projects such as mapping of S and N using lichens. In March 2006, WBEA invited senior external scientists to review its programs. The science advisors recommended a significant enhancement in the science base underpinning WBEA’s existing monitoring and measurements. In 2007, a greatly expanded, science-based, multidisciplinary program was proposed, and approved by WBEA members along with a three-fold, stepped increase in funding ($2.7 M, 2007; $8.4 M, 2008; $13.7M in 2013). One of the products from this science enhancement is represented in Percy (2012).
52 In January 2008, WBEA implemented a significant monitoring paradigm shift to an air pollutant pathway-driven, emission source to ecosystem receptor sink program of projects carried out by a team of 35 respected international scientists. By adopting the forest health approach (Percy et al. 2012b), WBEA revisited sampling designs, indicators and endpoint. Relating indicator/endpoint change to causal agent(s) became the focus, to the extent of deploying in 2013 a new 25–site early warning network to give indication of change long before effect or impact, thus allowing WBEA stake-holders to consider pollutant mitigation. An integrated approach measuring specific, dose-response–supported, responsive and robust indicators at key points along the air pollutant pathway was chosen, supported by a suite of projects (Percy and Krupa 2012) from ‘real-world’ source emissions characterization to source apportionment, all combining to link the air and land systems for the first time in the AOS.
53 According to Davies (2012), the ability of atmospheric process and dispersion models to simulate the fate of air emissions to the surface at such a large spatial scale such as that of the AOS is highly dependent on 1) quality of emission inventory data, 2) completeness of the chemical kinetics module, 3) accuracy and resolution of the underlying gridded meteorological fields, 4) topography, and 5) proper parameterization of gas/particle interaction and wet and dry deposition phenomena. However, in a highly regulated setting like the AOS, it is critical for stakeholders, regulators and decision makers to understand and be able to quantify the spatial influences of specific emission source types (anthropogenic versus natural, stationary versus mobile). This is, of course, also necessary for explaining any consequential environmental effects. Addressing the aforementioned issues requires source apportionment or identification of the contributions of the individual source types to the total spatially variable atmospheric deposition (Krupa 2012).
54 Source apportionment can be achieved by the application of receptor models (Watson and Chow 2007, 2013; Watson et al. 2008). Receptor models provide an approach to understanding the impacts of air pollution sources because the model results are based on actual measurement data at receptor locations in the receiving ecosystems. They do so by identifying and quantifying the impact of air emission sources retrospectively using advanced mathematical methods on a matrix of elements or compounds in atmospheric samples, or bio-indicators, as tracers for the presence of materials from specific sources (Hopke 2009). They are focused, therefore, on the behaviour of the ambient environment at the point of impact as opposed to dispersion/air quality models that focus on the emissions, transport, dilution and physico-chemical transformation that occur starting at the source and following their transport and also the products of the transformation to the sampling site (Krupa 2012).
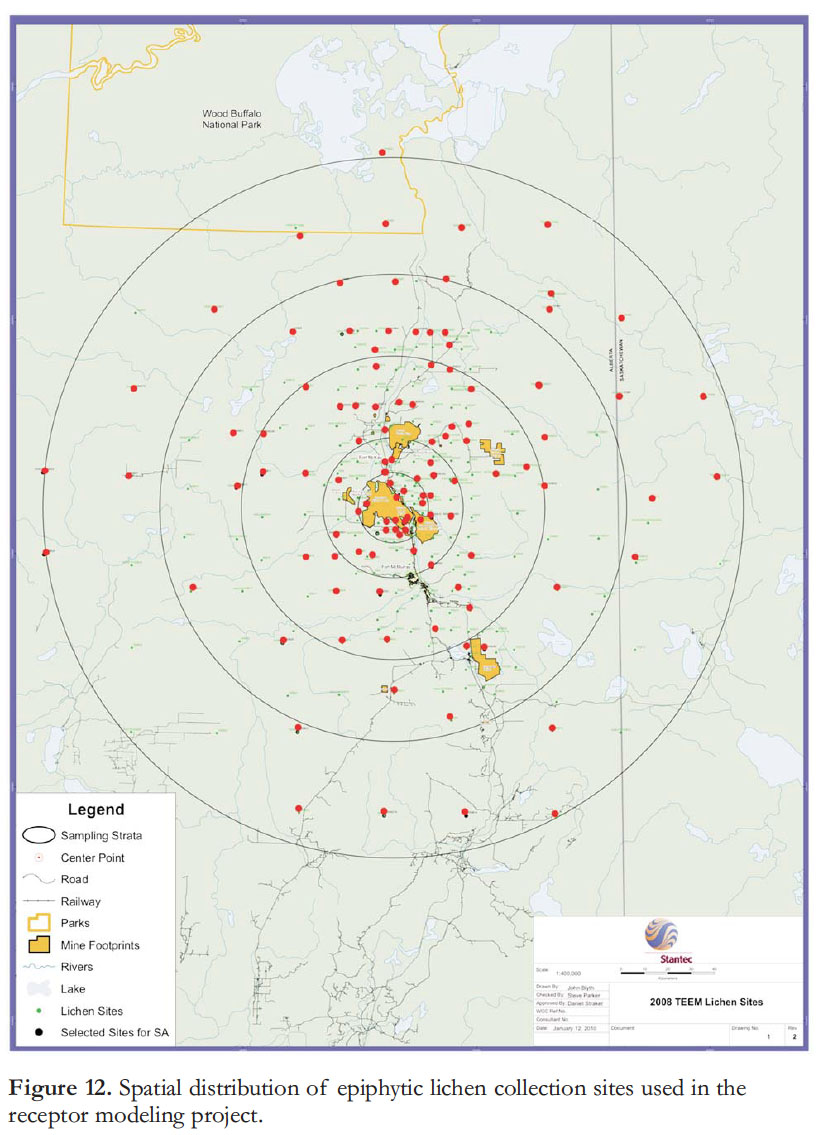
55 In 2008, WBEA initiated the first phase of its multi-component source apportionment project. Over a six week period, 359 sites were visited by helicopter and samples of two prevalent, epiphytic lichen species collected for chemical analysis (Fig. 12). The results mapping the concentrations of S and N in the lichens are available (Berryman et al. 2010). Replicate samples were kept for subsequent trace element, stable isotope, and PAH analysis, and for archiving. A team of scientists from Research Triangle Park in North Carolina, the University of Michigan, and Binghamton University, led by Dr. Sagar Krupa (University of Minnesota), was assembled to provide a scientifically sound explanation for the spatial patterns in pollutant distribution, and to relate source to sink for informed environmental management.
56 First, published preparation and extraction methodologies were improved upon, including adaptation of the zirconium ball grinding used by NASA for moon rocks, so that contamination was minimized and the lowest detection levels could be achieved. Inorganic elemental concentrations of lichen tissues were quantified (43 trace elements) using two different analytical instruments: Dynamic Reaction Cell –Inductively Coupled Plasma – Mass Spectroscopy (ICP–MS) and High Resolution– ICP–MS; discrepancies in the results of the two analyses were identified and correction measures taken at the outset (Edgerton et al. 2012). Tissue analysis for stable isotopes of 206Pb, 207Pb, 208Pb, and their ratios was used to identify the influences of distal transport versus proximal source emissions at the lichen sites and the results were integrated with the data output from the receptor modeling (Graney et al. 2012). Here as well, an attempt was made to identify the contributions of local emission sources by using stable isotopes of Hg (199Hg, 202Hg, and 204Hg) in the lichen tissue (Blum et al. 2012). In addition, analyses were conducted on a subset of samples (30 sites) to measure the concentrations of PAHs in Hypogymnia tissue (Studabaker et al. 2012).
57 The WBEA receptor modelling methods were presented by Landis et al. (2012). The site selection (121 sites, or 34% of the 359 sampled) was based on the a priori content of S and N in lichen tissues. Hypogymnia physodes was selected as the bio-indicator species of choice because it is an epiphyte that extracts all its nutrients from the air, has a high tolerance for SO2, is prevalent in all areas of the AOS, and is commonly used in air quality monitoring. Source materials from anthropogenic (with industry member cooperation), and natural emitters of air pollution in the AOS were obtained and chemically characterized. Source apportionment of the lichen tissue analytical results was conducted using Principal Component Analysis (PCA), Chemical Mass Balance (CMB), Positive Matrix Factorization (PMF), and Unmix Models. The United States Environmental Protection Agency Office of Research and Development had developed the chemical mass balance (CMB), Unmix, and positive matrix factorization (PMF) receptor modeling software tools.
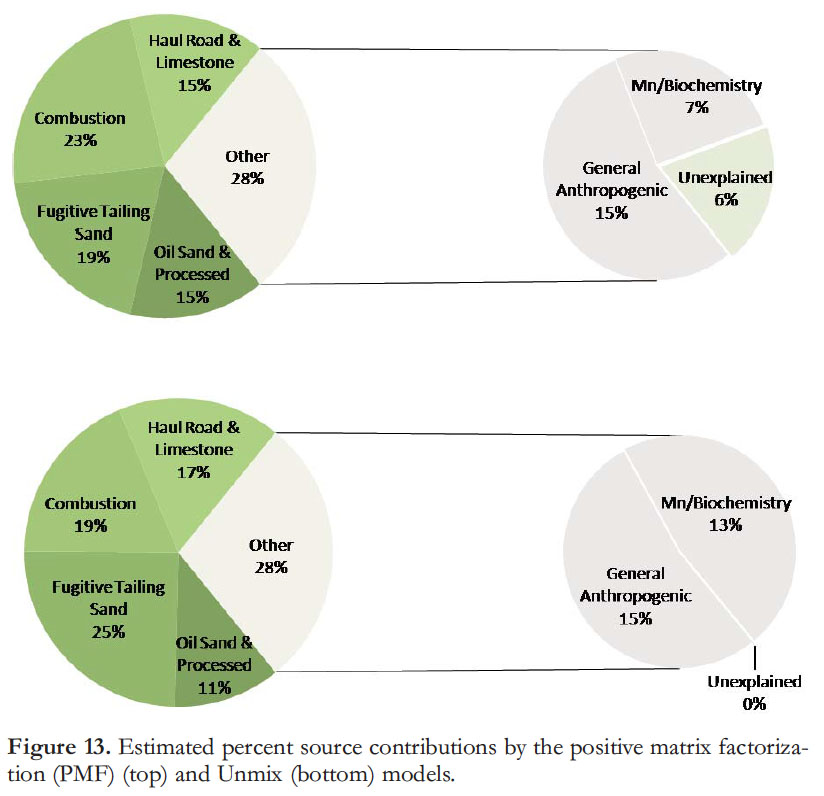
58 Initial Varimax-rotated PCA screening analysis indicated that there were five principal components that could explain 87% of the variance contained in the 121 site lichen data, with the majority of the variance lumped into a fugitive dust factor. This fugitive dust source could be separated into tailings sand, haul road, and overburden components using CMB on lichen samples collected near the mining and oil processing facilities. However, the CMB model performance was limited by the similarity of sources and the lack of total nitrogen measurements in the emission source profiles. The PMF and Unmix models were found to perform best with this unique AOS lichen data set, providing very similar results at near source as well as remote lichen collection sites (Fig. 12). The PMF results (Fig. 13) showed that emission sources significantly contributing to concentrations of sulphur, soil nitrogen and other trace metal oxides measured in the lichen tissue included:
- oil sands and processed material source (15%; high loadings of V, Ni, Mo, La, and Ce)
- fugitive dust from tailings sand source (19%; elements such as Al, Si, Ti, Ca, Ba, La, and Sm)
- combustion source (23%; including S, N, P, K, and Cu)
- haul road and limestone source (~15%; elevated levels of Ca, Mg, Sr, and Ba)
- general anthropogenic urban source (~15%; significant loadings of Zn and Pb)
Manganese (Mn) concentrations (biochemical factor) measured in lichens contributed 7% to the variability. This factor was thought to represent a biochemical response in the lichens to their metabolic needs as influenced by topography, microclimate, and elevation of the site as well as possibly a response to industrial activity at the closest sites. Only six percent of the variability in the lichen data set could not be explained by PMF (Fig. 13).
 Display large image of Figure 12
CONCLUSION
59 Much earlier, Smith (1981) authored a summary report on the 1975–1980 AOSERP, the first coordinated oil sands monitoring project. Retrospectively, it is interesting to look back and to quote directly from Smith, “the present level of spending on environmental research by industry and government should be maintained as an investment in the maintenance of acceptable environmental quality for the region.“ Between 1980 and 1997, environmental monitoring has been in evidence, but mainly driven by approval requirements set by Alberta Environment.
60 In 1998, monitoring of air and terrestrial systems took a big step towards effective regional stakeholder engagement, continuity in monitoring, and transparency in reporting with the formation of the Wood Buffalo Environmental Association (WBEA). In 2006/2007, the WBEA TEEM program underwent a review, leading to a significant scientific enhancement in concepts, program design, and execution, including the contracting of a distinguished team of international scientists enabled by a 3- step increase in funding beginning in 2008. WBEA members are to be given due credit for accepting the scientific advice given, and embarking upon a credible, and ‘practical’ science-build. Members and their representatives on WBEA committees are also credited with substantial input to monitoring design enhancement, including essential knowledge and considerable support in kind.
61 Almost two years later, two papers published by Kelly et al. (2009, 2010) called into question the adequacy of the existing AOS water-monitoring program. These papers led directly to the convening of federal (2010) and provincial (2011) expert panels on the state of monitoring in the AOS. On February 1, 2012, federal and provincial environment ministers Kent and McQueen announced the Joint Canada–Alberta Implementation Plan on Oil Sands Monitoring (JOSM). On October 17, 2012, Minister McQueen announced the formation of an arms-length Alberta Provincial Monitoring Agency.
 Display large image of Figure 13
62 The WBEA ‘practical’ science enhancement has recently been stated to be “...a model of what monitoring should do – thorough and sensitive enough that the information can be used to improve environmental management“ (quote from D.W. Schindler, in Edmonton Journal 2013). WBEA is actively engaged with both governments under the JOSM, and is already executing key elements of the JOSM in collaboration with the governments. WBEA could play an important role within the arms-length provincial agency once it is created.
63 AOS environmental monitoring requires a high level of science and continuity so that stakeholders, regulators and the public continue to build a better understanding of the fate of emissions within air, land and water systems. To further this goal, the air, land and water systems must be integrated ‘source to sink’, so that decision makers are better informed, and the AOS environment managed in a sustainable manner. Resource commitments made for monitoring must be maintained so that the18–year gap between multi-agency and stakeholder-coordinated monitoring is not repeated. In 2013, WBEA is being funded under JOSM, co-managed by Canada and Alberta. The Government of Alberta is working to create legislation to enable it to collect funds from the oil sands operators, and then disburse them under JOSM to monitoring activities.
64 The purpose of the Joint Canada–Alberta Implementation Plan for Oil Sands Monitoring (JOSM) is “…to describe how the governments of Alberta and Canada will put in place a world class monitoring program for the oil sands to provide assurance of environmentally responsible development of the resource” (Canada–Alberta 2012). Considerable investment in resources has already been made by industry in AOS monitoring over time (circa $21M in 2011 alone). Increased investment and scope of research/monitoring is now being implemented under JOSM ($50M by industry in each of the current and 2014/15 fiscal years).
65 In the Athabasca Oil Sands region, active participation by regional stakeholders from Aboriginal, nongovernmental, governmental, and industrial sectors has been well demonstrated over 15 years to have been important for identification of issues of concern, and efficient on-the-ground implementation of the WBEA 2008 science-enhanced monitoring programs. The consensus-driven process embodied within WBEA has achieved a level of balance between stakeholder and science needs, leading to monitoring systems that work for everyone, and that have already made a measureable difference in improving environmental management. The “…enhanced science-based monitoring for characterization of the state of the environment…” called for in JOSM must not be disconnected from the multistake-holder, regional process if it is to be truly world class, fully accepted, and successful. This is particularly the case if future results are to be “…thorough and sensitive enough that the information can be used to improve environmental management” (Edmonton Journal 2013).
The author wishes to express sincere gratitude to WBEA members, WBEA technical committees which determine direction and work plans, and funders, who in 2007 saw the need for a significant scientific enhancement in the WBEA monitoring programs, thus enabling a distinguished multidiscipli-nary team of scientists, the project outcomes of which are excerpted from here. I am most grateful to the dedicated team of WBEA air quality specialists who operate the air network, and the data management systems team who secured the data and provided the descriptive analysis used in this paper. The WBEA team of international scientists has greatly expanded the scope and credibility of monitoring and measurement within the AOS, and has contributed new knowledge that has already made a positive difference in environmental management. I also express my appreciation to the two external reviewers who provided many constructive and important comments on the manuscript.