New Series
CANADA GEESE
1 Welcome to CANADA GEESE, a new section of Geoscience Canada devoted to Geospatial Earth and Environmental Science Explorations. Residents of the USA (or even Mexico) know only too well that geese migrate far from their Canadian home, and similarly, the geographic scope of this section will range well beyond the borders of Canada! This first column concentrates on geological applications of Google Earth, however we plan to discuss a wide variety of visualizations and digital resources in future issues.
2 In April 2005, New York Times columnist Tom Friedman authored a book that stunned the world by denying its curvature: “The World is Flat: A Brief History of the 21st Century.” Flatness here refers not to topology, but rather to the purported economic levelling effects of globalization. Just a few months later, however, in August 2005, Google Inc. launched software called Google Earth (http://earth.google.com) that dramatically demonstrated just how round the world really is. Ever since, computer and digital device users around the world have enthusiastically celebrated its rotundity. In particular, geoscientists, having spent two centuries mapping the four-dimensional world of historical geology (paleo-latitude, paleo-longitude, depth-of-burial, and geologic time) onto two-dimensional map sheets, are now flocking (like geese?) to the new virtual globe formats with their four dimensions of pan, tilt, zoom, and play. We are living through an exciting paradigm shift in geospatial studies.
3 In addition to the Google Earth desktop application, which runs on the Macintosh, Windows, and Linux operating systems, this virtual globe can be viewed using modern web browsers with a JavaScript-driven plug-in and it is available on digital devices such as smart phones and tablets (iPads, etc.) running the iOS or Android operating systems. In 2011, total Google Earth downloads exceeded one billion. Some users may not have gotten past visiting their own home and neighbourhood, but if even 0.1% of downloads lead to serious inspection of the Earth’s physical environments, that’s an audience of one million.
4 There are numerous alternative virtual globes and related digital geology applications available, notably NASA World Wind, ArcGIS Explorer, GEON, OpenTopography, Crusta, GeoMapApp, Gplates, Layerscape, Move, Layered Earth, Geovisionary, etc., and we will discuss some of these in future issues. However, none can compete with Google Earth’s combination of ease of use, free availability across platforms, open access via the XML-based Keyhole Markup Language (KML), integration with 3D modeling via SketchUp, size of viewer audience, and – did I mention ease of use? This presents a dilemma for the geospatial content creator because ease of use applies to viewing content on Google Earth, not to creating custom content by writing KML or coding the Google Earth Application Program Interface (API). It is a simple matter to create a set of placemarks and add text, field photographs, hyperlinks, etc., with the aid of the desktop application’s built-in tools, however many features (e.g., screen overlays and map tiles) require the writing of KML or API code.
5 Among the key components for advanced geoscience content are COLLADA models (http://www.collada.org). COLLADA and its Digital Asset Exchange (.dae) file type are the only formats that Google Earth uses to present 3-D solid models. COLLADA models are most easily created using Trimble SketchUp (http://www.sketchup.com; the free version is sufficient). SketchUp is designed principally for constructing 3-D buildings and architectural structures such as monuments or bridges (http://sketchup.google.com/3dware-house). The models consist of a polygonal wireframe mesh onto which images are pasted as so-called ‘textures.’ When I first saw COLLADA models of city buildings on Google Earth (by turning on the 3-D building layer in the sidebar of the desktop application), it struck me that some skyscrapers are as tall as a road-cut is wide, so turning a face of a skyscraper on its side (which is simple in KML using the ‘Orientation’ element) and applying a cross section image as a model texture, I could create an engaging visual representation of geological structures in road-cuts. I next experimented with really large model-making and found that the limiting size was approximately twice the diameter of the Earth! Thus models can be made to represent geological and geophysical structures on the scale of mountain belts, plates, or even the Earth’s magnetic field (Fig. 1).
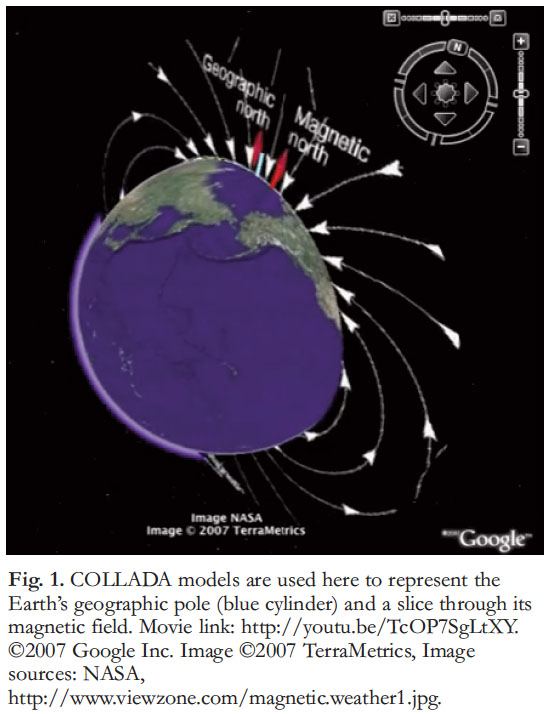 Display large image of Figure 1
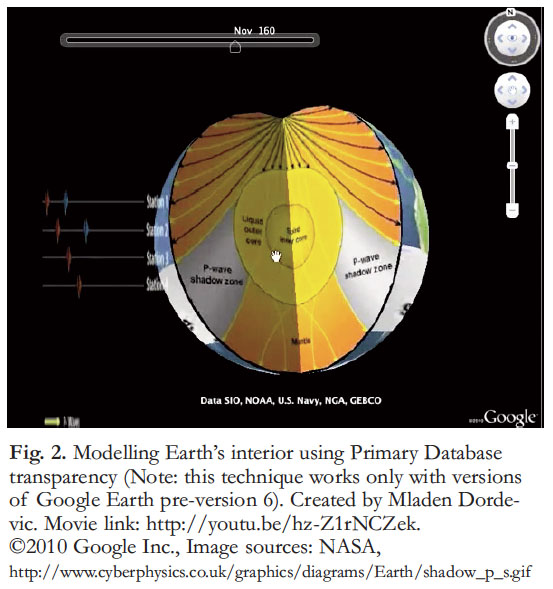 Display large image of Figure 2
6 Creating custom Google Earth content is particularly challenging for solid-earth scientists interested in the crust and mantle. Keyhole and later Google engineers did not anticipate a need to view the subsurface so they made the terrain imagery opaque by default and limited fly-through camera locations to altitudes above ground. In response to appeals from the oceanography community, submarine exploration was added, however peering underground still requires the use of undocumented features. Prior to version 6.0, you could select the ‘Primary Database’ in the ‘Layers’ sidebar and make it disappear using the transparency slider located just above it in the sidebar. In the latest version (6.2), however, you must select the ‘Radar’ item in the ‘Weather’ layer and make it transparent! When the surface imagery is rendered transparent, COLLADA models located below the surface become visible (Fig. 2), however rendering is not always pretty (so-called ‘hidden line algorithms’ are not fully implemented) and the camera still cannot fly through the invisible surface of the Earth.
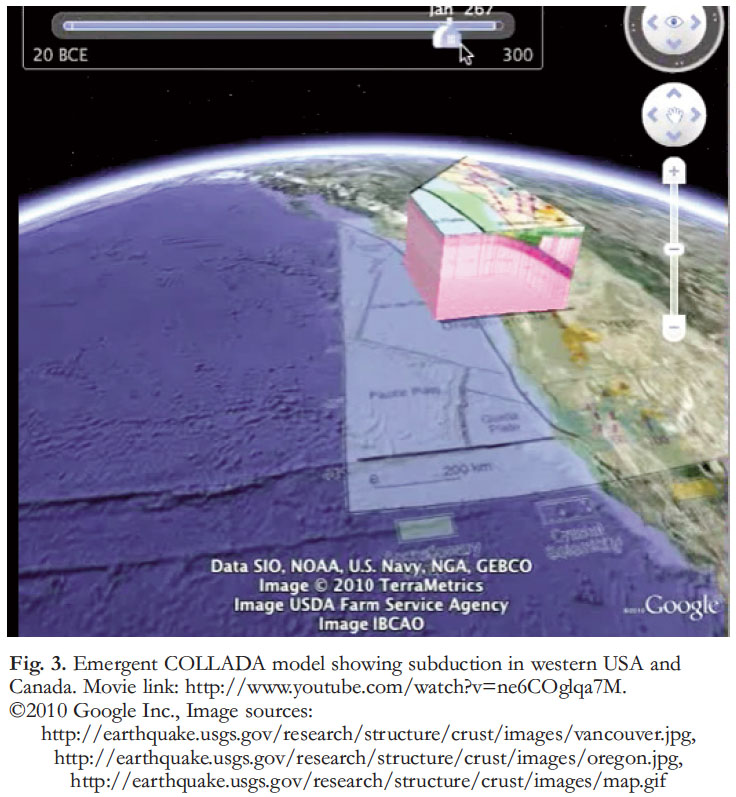
7 In 2006, my students and I presented an alternative solution by repurposing the Google Earth time slider to cause geological COLLADA models (cross sections, block diagrams, geophysical beach balls, etc.) to emerge from the subsurface (De Paor and Pinan-Llamas 2006, De Paor and Williams 2006). Since then, we and many other authors have developed and refined structural modeling both in the desktop application and browser plugin (Fig. 3: see De Paor et al. 2010 for technical details and KML sample code). Colleague Steve Whitmeyer uses the tour slider to create a simpler interface and De Paor et al. (2011) covered the Google Mars surface with a plain red image to represent Earth’s core and build mantle models above it (Fig. 4: see also De Paor et al. 2012).
8 Challenges abound also for geoscientists interested in surface processes. With the 3-D terrain turned on, Google Earth easily deceives the viewer into believing it is a true representation of the Earth’s surface, not merely a rather coarse approximation created by draping imagery over a polygonal wireframe mesh. There is a mountain called Croagh Patrick in the west of Ireland (lat 53.7595°, lon -9.6583°). A pilgrim’s chapel called St Patrick’s Oratory sits at the summit (see images at http://en.wikipedia.org/wiki/Croagh_ Patrick). However, on Google Earth, the chapel appears precariously perched on the talus slope (Fig. 5). The Google Earth DEM is quite coarse and can play havoc with geological mapping. The structural geologist’s ‘Rule of Vee’s’ does not work on a triangular mesh. Particular attention must be paid whenever the slope changes suddenly - for example at sea cliffs.
9 With the above caveats in mind, Google Earth is nevertheless a powerful tool for map making and geospatial visualization with a wide range of potential applications in all branches of the earth and planetary sciences. I have here emphasized my personal interests; to appreciate the range of applications that geoscientists are finding for Google Earth, SketchUp, etc., see Whitmeyer et al. (2012).
10 For this new section of Geo-science Canada, our first invited and peer-reviewed paper by Katherine Boggs of Mount Royal University, Mladen Dordevic of Old Dominion University, and Scott Shipley of WxAnalyst Ltd., reaches new heights by moving and restoring geological cross sections from student mapping in the Canadian Rockies using two custom slider controls and making them “query-able” with WxAzygy™ software. This paper also reveals how challenging it can be to include seemingly simple features such as contours in geological maps draped over the Google Earth terrain. The take-home thought, however, is that the effort is worthwhile when the result is an engaging visualization that overcomes students’ (and some professionals’) barriers to understanding 3-D geology.
11 There is much yet to be done. Our ultimate goal should be a virtual globe with the same pan, tilt, zoom, and play dimensions for geospatial content that currently exist for surface historical imagery. In other words, we need a globe that seamlessly zooms from the viewpoint of the International Space Station to that of a traffic helicopter, bringing in maps and geo-scientific data at appropriate levels of detail, and playing forward and reverse on a 4.56 billion year geological timescale.
 Display large image of Figure 3
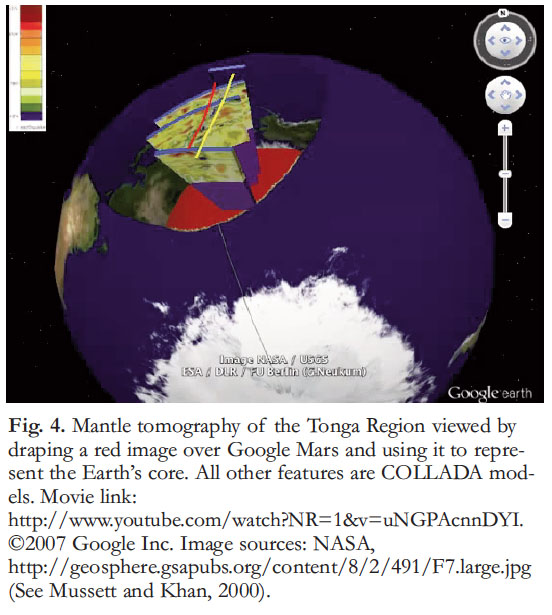 Display large image of Figure 4
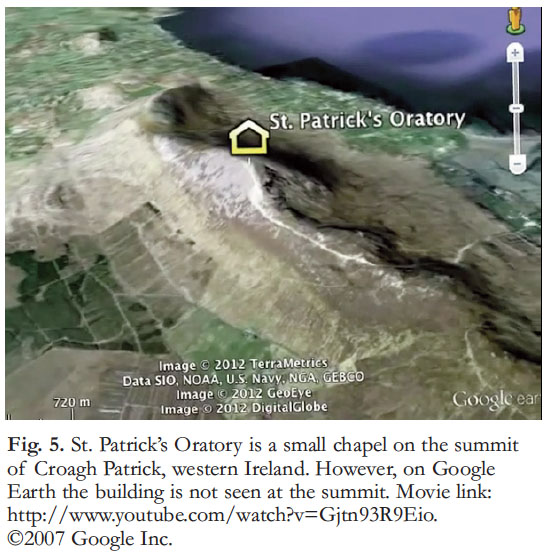 Display large image of Figure 5
12 The editors welcome suggestions and submissions for future issues. We aim to showcase innovative approaches to using Google Earth and other geospatial technologies both in geoscience education and research. We expect contributions to be stimulating and rigorous in content. Papers may range from relatively short, focussed discussions of innovative methods or code snippets to more lengthy overviews of relevant topics. Both peer-reviewed research and non-peer reviewed news and views are welcome. The section is intended to stimulate continued development of the field and to inspire applications by Geoscience Canada readers.
13 Manuscripts, whether invited or contributed, will be assessed for suitability by the editors. And because Geoscience Canada is now on-line only, we can accommodate additional graphics, movies, and supplemental files such as KMLs and KMZs without extra cost. If you are interested in contributing or in nominating a potential invited author, please contact me directly at: ddepaor@odu.edu.
Declan G. De Paor
Associate Editor