Education Matters
The Grand Old Duke of York;1
Present-Day and Future Canadian Geoscience Education and Labour Market Trends
SUMMARY
The job market for Canadian earth scientists is significantly driven by the country’s strong resource industry. Enrolment in earth science degree programs is growing, but the demand from the job market is expected to outpace the projected supply from domestic programs. If the job market will indeed need as many workers as predicted, it will be necessary to change tactics for recruitment into Canadian university geosciences programs, to provide the market with the necessary workers.
SOMMAIRE
Le marché du travail canadien en sciences de la Terre est particulièrement à l’importante industrie primaire du pays. Le nombre des inscriptions à des programmes de diplômation en sciences de Terre est en croissance, mais on s’attend à ce que la demande du marché du travail dépasse l'offre projetée des programmes nationaux de formation. Si les besoins de l’emploi s’avèrent, il faudra qu’on change de tactique de recrutement dans les universités canadiennes pour les programmes géosciences, pour répondre à la demande.
INTRODUCTION
1 This paper is the result of two related efforts. The Council of Chairs of Canadian Earth Science Departments (CCCESD, http://cccesd.acadiau.ca/) has collected and published figures on Canadian geosciences program enrolment and graduation for 40 years. The Canadian Federation of Earth Sciences (www.geoscience.ca, of which CCCESD is a member organization) published a Canadian earth science job market survey in 2008 and has continued to follow up on the discussion about this topic both with CCCESD and with other organizations such as the Mining Industry Human Resources Council MIHR (http://www.mihr.ca), Petroleum Human Resources Council PHRC (http://www.petrohrsc.ca/), Geoscientists Canada (www.ccpg.ca) and the American Geosciences Institute AGI (www.agiweb.org). Although our data are incomplete, there are probably few other professional disciplines in Canada for which such good education and labour market information exists. As an example, Engineers Canada provides excellent information about university enrolment (Engineers Canada 2011), but comparable information on labour statistics in engineering is not conclusive (Engineers Canada and Canadian Council of Technicians and Technologists 2009). Even so, some of the comments expressed below are anecdotal, or should be recognized as the opinions of the authors. Our information does imply that it will be virtually impossible to increase numbers of domestically trained earth science graduates to levels sufficient to meet the needs of the (near) future job market, as the potential recruits don’t seem to exist in traditional talent pools. Only aggressive foreign recruitment can prevent a certain amount of shutting down of those parts of the Canadian economy.
EDUCATING CANADIAN EARTH SCIENTISTS
2 Earth Science, in one form or another, is taught across Canada at 37 universities, ranging from full programs at undergraduate to postgraduate level to one-year introductory programs at the undergraduate level. Of these 37 universities, 32 offer full BSc programs, 31 offer MSc programs, and 25 offer PhD programs. All 37 university departments belong to the CCCESD, which has tracked statistics about student and graduate populations and faculty numbers since 1974. Earlier snapshots of student numbers have been published by Stearn (1968) and Blais et al. (1971). The statistics are published annually on the CCCESD website, and there the data are subdivided by region (West, Ontario, Québec, Atlantic).
3 The CCCESD statistical summary is obtained by means of a questionnaire delivered to all department heads with a request to collect data for the calendar year, most recently 2011. The data, therefore, indicate the state of affairs up to December 2011. The response rate for the survey is typically more than 90%, and where data are unavailable for one year, the previous year’s data are substituted. In 2011, three universities did not report; one of these was new to the collection and does not yet have a full program extant. One university (University of Guelph) reported that it no longer offers a Geology program, and withdrew from the survey.
4 Student enrollment trends (Figs. 1 and 2) are shown for numbers of majors and number of students in service courses. The number of majors refers to the number of students registered in geoscience programs and may include first-year students in some universities, but not in others, depending on when students declare their major. Service courses are defined as one-term courses in pre-year-2 levels in all provinces except Québec; these are courses offered primarily for non-majors in Geology. The same criteria have been applied to the data collection since its inception, so the trends are real, even if the data may be inconsistent from university to university.
 Display large image of Figure 1
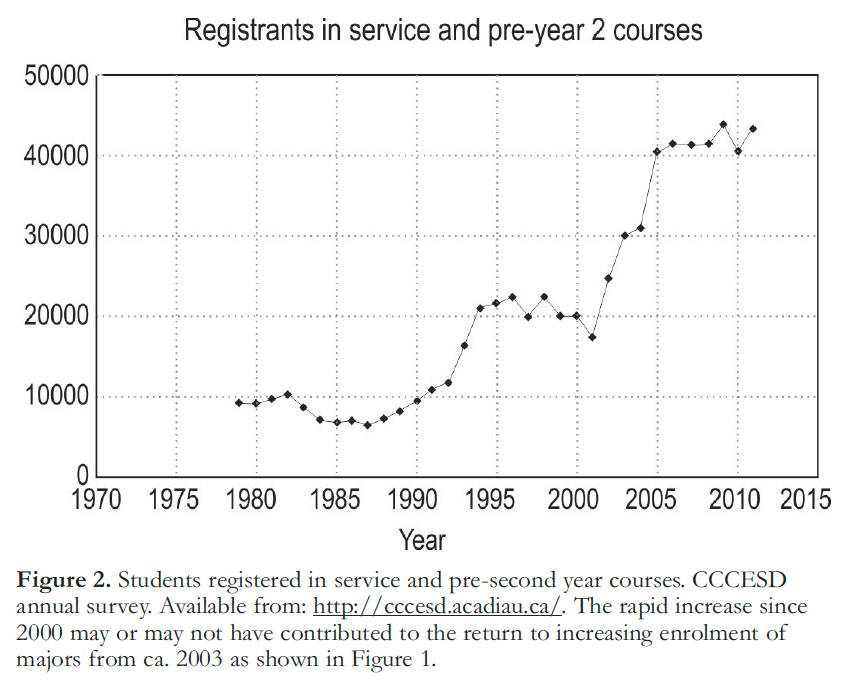 Display large image of Figure 2
5 Departments are asked to subdivide the numbers of students in program by sub-discipline (Geology, Geophysics, Geological Engineering, Environmental Science, Physical Geography, Oceanography, Atmospheric Science, and ‘other’ (mostly Paleobiology). While the survey captures all Canadian enrolments in strictly Geology programs, it likely does not capture geologically related degree students in non-Earth Science departments, e.g.,Geophysics majors in Physics departments, or students of Environmental Science, Oceanography, etc., outside of Earth Science departments. The data, however, have been collected consistently since the start of the survey. In 2002, with the recognition of increasing numbers of students studying Environmental Science in Earth Science departments, the dataset was split to separate the numbers of Geology, Geophysics and Geological Engineering students (shown with open squares in Fig. 1) from the total number of students in the departments.
6 A total of about 5000 students are currently enrolled in these programs, at least 75% in BSc programs. Graduation figures and graduation-to-enrolment proportions suggest that retention is about 90%, although this figure must be somewhat flattered by students entering these programs laterally after their second year.
7 The most obvious trend in Figure 1 is the cyclic nature of enrolments in undergraduate degrees, with peaks greater than twice the lows in the late 1980s and late 1990s, and a rising trend since about 2003, for students enrolled in programs. Typically, the increase in enrolments is gradual, and the decrease precipitous, leading some to consider that the reasons are as much perceptual as market-driven. The 1980s saw the formation and demise of the National Energy Policy in Canada and a subsequent downturn in industry in the mid-decade years, which would suggest an explanation for the decline in enrolment. But the same precipitous dip took place in the USA in those years (Gonzales 2011, slide 15). The late 1990s saw a substantial decline in mining exploration, following tax law changes and the Bre-X scandal, suggesting an explanation for the decline in that period (the USA did not experience a decline in enrolment during that same period). Since 2002, enrolment in Geology–Geophysics– Engineering Geology programs has increased by over 60% throughout the country.
8 Enrolment in graduate programs has been largely immune from the cyclic trends seen in the undergraduate numbers, although the early 1990s minimum can be seen in the numbers of MSc students enrolled. In the past ten years, enrolment in Geology–Geophysics–Engineering Geology programs at the Masters level has dipped from around 750 to the low 600 range, and then climbed to over 800. Doctoral enrolments have climbed substantially from the 350 range to over 550 in 2011. We believe that MSc enrolment remains relatively low because the Canadian industry prefers to hire BSc-level graduates, whereas PhD enrolment reflects an interest in science and in a career outside industry.
9 One of the most astonishing trends in geoscience enrolment is the number of students in service courses. Although this includes students in introductory courses in most universities, it is dominated by students taking ‘general interest’ courses in geoscience – in some cases introductory Geology, but in many cases in niche areas, e.g., Natural Disasters, Dinosaurs, Gems, Oceans, etc. At least four universities have over 3000 enrolments in such courses annually. It is probably not a coincidence that the introduction and marketing of these courses, as seen by the rapid increase in enrolments, coincided with the large decreases in geo-sciences majors enrolment in the early 1990s and early 2000s. Departments clearly sought ways to entice students into the earth sciences, and likely to justify their professorial numbers to administration. However, once started, such courses appear to be very addictive, for in spite of the rapidly increasing numbers of majors enrolments in the last four years, there is no evidence of any decline in the number of students also enrolled in service courses. How many more students can or will be recruited through this tactic into geosciences degree programs remains an unknown for now. In the USA, a large number of students declare that they chose a geoscience program accidentally (AGI 2011).
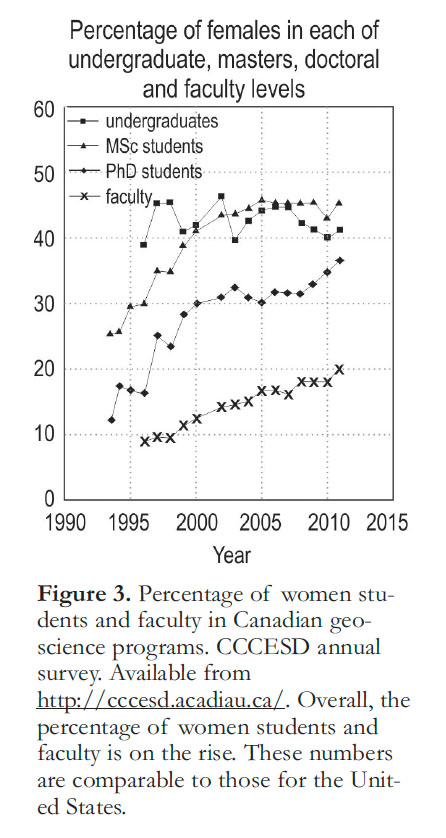
10 The fraction of women in earth science programs, both as students and as professors and instructors, has been tracked since the mid-1990s (Fig. 3). The fraction in the undergraduate programs (not including service courses) appears to have stayed fairly constant in the 40–45% range, and the fraction in graduate programs has steadily increased from 25 to 45% in Masters programs, reaching a plateau about year 2005. The proportion of women in PhD programs grew from ca. 15 to 35% and is still rising. The percentage of women employed in teaching has risen from less than 10% in 1996 to 20% in 2011, tracking the increase in women in PhD programs. The fractions of women students and faculty are more or less identical to those in the United States over the same time period; there, the percentages of women in physical sciences, earth sciences and mathematics are more or less comparable to each other. They are generally twice as high as the percentages of women in computer science and engineering and about half the fraction of women in life sciences (Gonzales 2011) The total number of geoscience faculty, male and female, appears to vary erratically, rising from 450 in the 1970s to 570 in 1993, before dropping back to 480 in 2000, but rising again to about 570 currently.
 Display large image of Figure 3
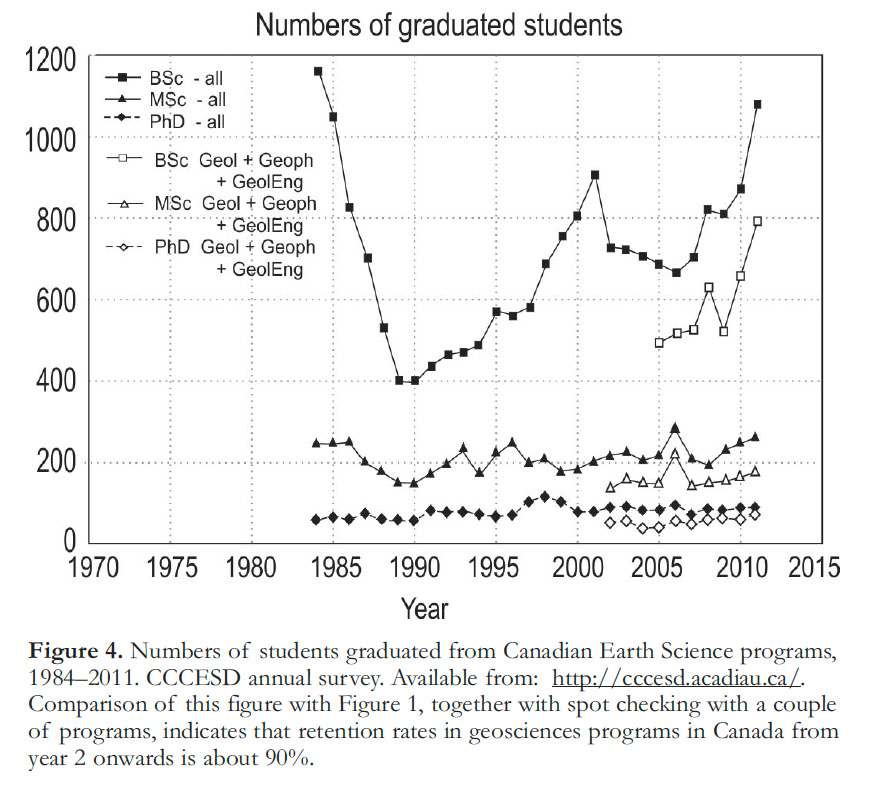
11 As far as the job market is concerned, the critical data are the number of students graduating (Fig. 4). These data have been collected since 1984 and, as expected, the BSc graduation rates appear to have tracked the enrolment rates with a lag of 2–4 years. Since 2009, graduation numbers have increased significantly, a trend that should continue based on the number of students in the system. A crude estimate of the average duration of a degree can be obtained by dividing the enrolment rate by the graduation rate. In the area of Geology–Geophysics–Engineering Geology this number is currently about 4.3 years, and given that most universities consider a student enrolled in a program only for 3 years-worth of courses, indicates the average student is taking a year more than the minimum to complete a degree. This is, in part, caused by students taking time out of university to work (sometimes in co-op programs). Although we do not measure retention per se, the proportion of graduating students versus registered students in any year suggests retention figures of over 90%, although these figures may be somewhat flattered by lateral influx of students from other majors around year 2.
 Display large image of Figure 4
12 Contrary to the United States (Gonzales 2011), many areas of Canadian industry continue to accept the BSc degree as the basic entrance requirement for employment, and the student numbers appear to bear this out. Graduation from graduate programs has shown only a modest growth over the period surveyed, with the inter-annual noise greater than the overall increase. Using the method described above, on average, a Masters student takes 4.4 years to complete a degree, and a PhD student 8 years to complete a degree – these values are much greater than the purported 2-year and 4-year norms in many universities, and probably reflect a large number of students who are employed in the latter parts of their programs, or do not finish the degree begun.
 Display large image of Figure 5
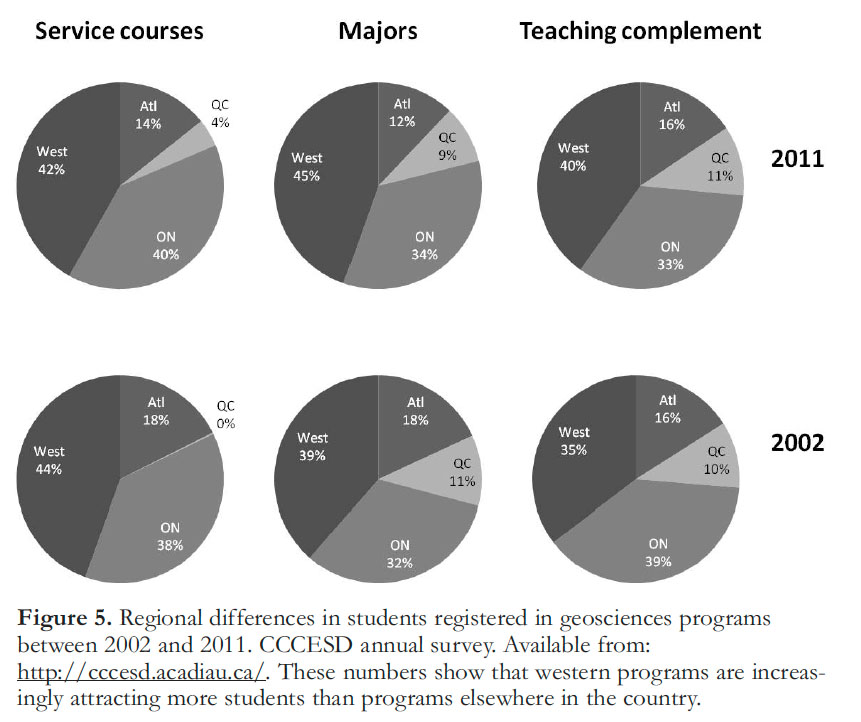
13 The CCCESD data are also shown regionally for four regions: Atlantic, Québec, Ontario, West (Fig. 5). Two snapshots are provided, 2002 and 2011. In both years, it is evident that Ontario and Western Canada dominate in the number of students enrolled and in the number of people employed in teaching them. Although numbers overall have risen in all regions, one trend from 2002 to 2011 is the increasing significance of the western universities, which have increased their share of the fraction of majors by almost 6% since 2002 and fraction of faculty by 4.7%.
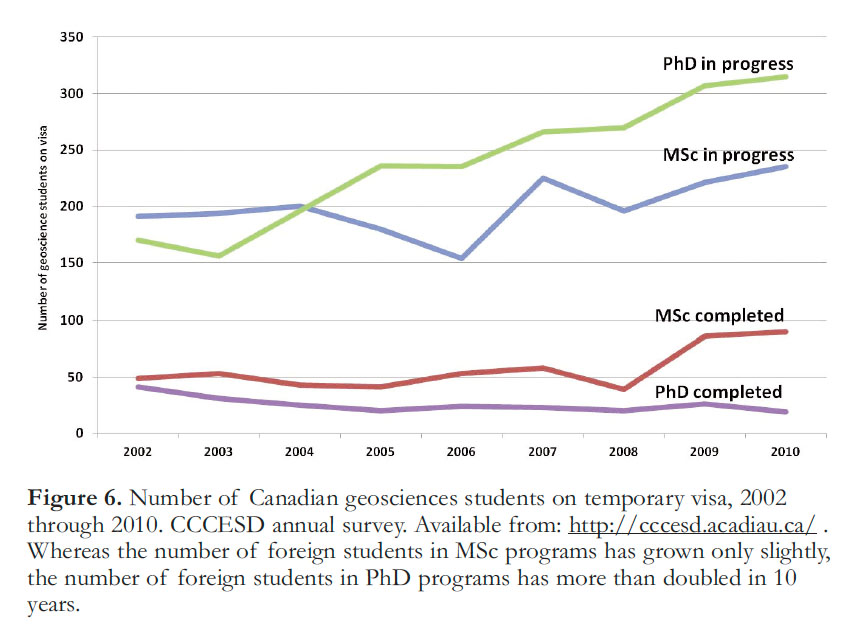
14 The ethnic diversity of Canadian geosciences students is essentially unknown. The CCCESD does not ask explicitly about ethnic diversity on its annual survey, but it does ask about the number of graduate students on a temporary visa (Fig. 6). Since 2002, the number of registered international MSc students has grown from just under 200 to just over 200/yr (ca. 20% of all MSc students). The number of international PhD students has risen from ca. 150 to ca. 300/yr (about 33% of all PhD students). Here too, the western universities are responsible for the bulk of this growth in numbers.
 Display large image of Figure 6
15 A student on temporary visa is not necessarily non-Caucasian or from a non-western country. Canadian earth science programs probably do not yet attract significant numbers of students from non-Caucasian ethnic groups either from within the country or from abroad. In this respect, Canada may again compare rather well with the United States which manages to attract no more than 3.5–5.5% of non-Caucasians into earth science programs, the lowest percentage in any of the sciences in the USA (Gonzales 2011); the USA has 72% Caucasians vs 80% for Canada. O’Connell and Holmes (2011) reported that, in 2008, more than 85 000 STEM (Science, Technology, Engineering and Medicine) degrees were awarded in the USA to non-Cau- casian US nationals, and only about 400 of those degrees (or 0.4%) were in earth sciences. We can only speculate about their minimal interest in our science at this point.
16 How can we increase enrolment in these programs in Canada? Have we tapped into all potential talents, male or female, Caucasian or non-Caucasian? The proportion of women has risen significantly over the years and is similar to the USA. Has it levelled out? Can we expect to recruit more from other talent pools? If we need additional students, it could be worthwhile to increase – nationally coordinated – efforts in that direction by means of targeted outreach campaigns, including those non-Caucasians who are currently working geoscientists. A good example in this respect, are the ‘career videos’ produced for the Careers Website, one of the International Year of Planet Earth projects (http://www.earthsciencescanada.com/careers/video.php)
17 Although there are notable exceptions, in general an admitted weakness with the administration of many Canadian earth science programs is systematic alumni follow-up. In some universities such relations are managed by an office of alumni affairs and such an office does not separate alumni by degree program; in other schools the task is left to individual departments, and this task is often too arduous to carry out in addition to all other responsibilities. There are, therefore, no reliable statistics about the ultimate career paths of Canadian earth science graduates. As a result, despite being able to show enrolment growth and high retention figures, we do not really know where earth science graduates go. Are they all working in earth sciences? If not, where are they? Do they think that their earth science degree serves them well in their career, whether as an earth scientist or in a different field? CCCESD, CFES and CCPG attempted to obtain information about early career paths through an online survey in 2010, but advertising the survey turned out to be difficult and only a few people returned it.
18 Figures from the USA suggest that about 50% of BSc level graduates work outside the Geosciences (Keane 2007). Initial recruitment for earth scientists in the USA is more skewed towards MSc level, whereas recruitment in Canada is more skewed towards BSc level. Would this mean that we retain more BSc level graduates in Canada because the job opportunities are currently better for that level? Is it expected that recruitment in Canada will continue to prefer BSc level graduates?
THE CANADIAN GEOSCIENCES LABOUR MARKET
19 A stream of literature over the last years has drawn attention to the anticipated labour shortage in the Canadian geosciences labour market and to the continuing growth of our resource industry, the largest employment sector. Various authors (Swinden 2001; Morgan et al. 2002; Doggett and Theman 2006; Canadian Federation of Earth Sciences 2008; Lebel 2010; PHRC 2012; MIHR 2011) have and continue to point out that the majority of working Canadian earth scientists, in all sectors is within 10 years of retirement (NB – the first of these articles appeared more than 10 years ago!). Heath (2002) drew attention to changing demands from the work floor, which requires more business-savvy graduates with a proper dose of IT and social skills. Doggett and Mercer (2002), on the other hand, concluded that broadening of university programs did not serve the HR need of the minerals industry. Swinden (2001) warned of a disintegration of corporate memory in provincial and territorial geological surveys within 10 years (i.e. now). He also pointed out that, in addition to the retirement wave, the skills needed would shift as provincial and territorial geological surveys move into new expertise fields such as hydro-geology, geomorphology and land-use planning as a result of developments in science and society. Broadening and shifting within earth sciences were also observed on the basis of the 2009 NSERC Geosciences grant applications (Lebel 2010), another parallel to the United States (Gonzales 2011, slide 27).
20 New skills generally require new hires because it is difficult to retrain, e.g., an igneous petrologist into a hydrogeologist in mid-career. Government organizations and academia are limited in making (quick) adjustments in their personnel composition because of job protection policies and ever decreasing personnel budgets. Thus, those organizations that are supposed to be the most innovative, because they are dominated by research, also have the biggest challenge in living up to their innovative potential.
21 The survey of Morgan et al. (2002), which was carried out on behalf of CFES’s predecessor, the Canadian Geoscience Council, was based on the response of ca. 3000 Canadian geosciences professionals, a number that would seem to be statistically significant. In that year, 42% of respondents were older than 50 and nearly 60% of them had a graduate degree; 85% of respondents were men, yet the percentages of women geo-sciences students have been much higher than 15% for many years prior to 2002 (Fig.3). Unfortunately, we do not know what the percentage of women in the Canadian geosciences work force is at the moment, but it is likely higher than in 2002, although probably not as high as the percentage of women students (enrolled or graduated). The survey’s authors also inventoried how many of the respondents were provincially registered geoscientists. Just over half of all respondents were registered as a P.Geo in 2002 and this number has probably stayed more or less the same these 10 years. The 2012 Annual General Meeting of Geo-scientists Canada reports that there were 9568 registered P.Geo’s in June of this year. Although there is no complete agreement on the total number of working Canadian earth scientists, CFES estimates – based on the membership of its constituency – that there are ca. 20 000 earth scientists in Canada. Some of those who are not P.Geo’s may be registered as P.Eng (engineering geologists and geological engineers), the rest are not licensed at all.
22 In 2002, it was largely expected that people would retire at 65 (at the latest), but mandatory retirement ages have since then been abandoned by government and academia. In addition, the financial crisis has also made it necessary for some to continue working beyond age 65. Thus, relatively more professionals are available for the work force than would have been forecast 10 years ago, but we do not really know how many more.
 Display large image of Figure 7
23 The CFES Survey (CFES 2008) was based on the response from 117 employer organizations, representing ca. 3800 professionals. The survey was closed just before the start of the financial crisis, but since the resource sector repaired itself fairly quickly, we estimate that most of its results are still quite valid. In this paper, we focus only on some of the findings of this earlier study. Figure 7, for example, shows the widely varying labour conditions among the different sectors. It is understandable that academia and government organizations have the lowest proportion of temporary staff, but the nearly 41% temporary staff of the minerals sector certainly stands out. And while the environmental/geotechnical sector expected more change than the minerals sector (much environmental work is associated with the minerals industry), it has a lower percentage of temporary staff than the mining sector. A 2007 ECO Canada study estimated that workers with environmental skill sets have a broader range of career options and are increasingly in demand by sectors with growing environmental issues who have just begun to address their need for staff with these skills (ECO 2007).
24 A decent proportion of temporary staff gives an organization more flexibility and – theoretically – allows it to be more innovative, but a very high proportion of temporary staff reduces corporate memory, which is a barrier to innovation.
25 The CFES 2008 survey did not capture a large expected change in the petroleum sector, which was probably erroneous, because both the Petroleum Human Resources and Mining Industry Human Resources Councils (PHRC and MIHR) project the need for thousands of university-educated geoscience professionals in their industry within the next few years (PHRC 2012; MIHR 2011).
 Display large image of Figure 8
26 In the petroleum sector, E&P (Exploration and Production), employed 66 744 people in 2009, and it expects – depending on economic realities – to recruit a minimum of 9500 individuals in the next few years (PHRC 2012). In line with Heath’s (2002) conclusions, PHRC also reports mismatches between the skills and experience of the available labour supply and those required to replace retiring workers, creating additional skill shortages.
27 Communication and collaboration between sectors and between companies within sectors are not the norm at the moment; rather, companies poach each other’s employees and compete heavily among university graduates, something that many students find disturbing (our personal impression). But collaboration among petroleum companies and between that sector and other societal institutions could actually benefit the entire labour market: industry could increase collaboration with educational institutions which could improve their perceived status in society. Collaboration could help with increasing employee mobility and diversity of the workforce.
28 The top recruitment challenges reported by PHRC (Q3/Q4 2011 survey respondents) were:
- Attraction and retention of workers in hard-to-recruit locations (63%)Labour and skills shortages (57%)Managing employee turnover/retention (52%)Benefits and compensation expectations (50%)Productivity and employee engagement (31%)
29 Unfortunately, there are no numbers on labour productivity in the ‘Mining, Quarrying and Oil and Gas Extraction Industry’. These figures are officially unavailable in Canada (Industry Canada, http://www.ic.gc.ca/cissic/cis-sic.nsf/IDE/cis-sic21proe.html)
30 Maybe surprisingly, the aging workforce was not seen as a major challenge by respondents to this survey. Attracting workers in hard-to-recruit locations is a challenge that will not go away any time soon, in a society where more often than not two partners take responsibility for raising children and thus do not want to work in remote locations where there is possibly only a job for one of the two parents. This is a guess on our part, something that we think is worthy of a social sciences study. PHRC reports that the number of international recruits seems to be on the decline, an observation that is in line with what Schlumberger Business Consultants observed (SBC 2012). Companies currently focus more on recruiting from their competitors, even though there is an excess of geoscientists in Asia and a shortage in North America (SBC 2012), partly as a result of the difference in global demographics (Fig. 8).
31 MIHR continues to work hard on broadening the recruitment pool for the mining sector by focusing on women, Aboriginal groups and immigrants (MIHR 2011). Currently, the mining industry lags the labour force in employing women (14% in mining vs 47% for the entire economy in 2006) and new Canadians. While new Canadians accounted for nearly 21% of the Canadian labour force, they accounted for only 8.7% of the mining workforce in 2006 (Statistics Canada 2007). The Mining industry only outperforms the rest of the economy in employing Aboriginal people: 7% of the mining workforce self-identifies as aboriginal, nearly double the rate for the overall labour force. MIHR expects a recruitment need of close to 3000 professionally trained geologists, geological engineers, etc. by 2021, most of them in the central part of the country.
Discussion
32 The number of geosciences students has increased markedly during the last 10 years, the same period that saw a flood of surveys, reports and warnings addressing the impending labour shortage. While the growing enrolment is encouraging, it is still insufficient to compensate for the labour shortage that is now upon us: starting in 2011, the year that the oldest baby boomers turned 65, more people were leaving the Canadian workforce than entering it (Statistics Canada 2007).
33 What sort of strategies should we look for? On the basis of the figures presented here, we believe that the largest potential talent pool is among non-Caucasians, both in Canada and abroad. Tapping into that talent pool, however, would require a well coordinated effort in outreach and recruitment. There is a lot of excellent geo-science outreach in Canada, but it is not nationally coordinated. Examples of geosciences outreach are EdGeo summer courses for teachers, outreach activities of individual CFES member societies and other (similar) organizations and all activities of natural history museums. The activities of the Canadian National Committee for the International Year of Planet Earth (CNC-IYPE, www.earthsciencescanada.com) were an attempt at national coordination and while these activities and their products are all excellent and successful in their own right, there was never enough money for a true large-scale national program. As far as we know, no nationally coordinated effort exists to attract foreign students to Canadian programs.
34 Data from Statistics Canada support our conclusion. Statscan projects that the portion of Canada’s population growth by ‘natural’ ways (reproduction) will decline and become negative by about 2030 after which our population will only grow through immigration (Fig. 9).
 Display large image of Figure 9
35 The only other important strategy is to increase efforts in retaining workers, especially women. Retention strategies have become widely recognized and practised among large global companies (Schlumberger Business Consulting 2012; McKinsey and Company 2007) and include a host of activities, of which mentoring, flexible work hours and dual careers are only the most obvious.
36 It is also our impression that the job insecurity in the mining sector (expressed by its high percentage of temporary staff) probably does not contribute to staff retention. After two or three lay-offs, a professional may prefer to seek more a stable opportunity outside the sector. The mining sector is understandably concerned about its labour shortage; maybe it should reconsider its hiring conditions.
GENERATION X, Y AND Z
37 Generation X was born between 1961 and 1979, the latter half of this generation during the social upheaval of the women’s rights movement (on the heels of the development of the birth control pill). Generation Y was born between 1980 and 1995. Generation Z is born after 1995 and is followed by Generation alpha, born from ca. 2010 onwards.
38 Most literature on the subject of the shortage of Canadian earth scientists does not take the changing perceptions and attitudes of the next generation into consideration. Gonzales (2011) showed that the geosciences are among the least popular of the physical sciences in the USA; the same may be the case in Canada. Why is that the case? Is there more to it than just a vague perception about earth-unfriendliness of our profession? Many earth scientists believe that the secondary school curriculum is to blame: there is no earth science in middle or high school; this is why the outreach activities of the Canadian Geoscience Education Network (www.geoscience.ca/cgen) are specifically targeted at secondary education. While CGEN undoubtedly fills a gap here, especially through its successful EdGeo program (www.edgeo.org), we think that the situation is probably a little more complicated. Psychology or engineering are also not secondary school subjects and the university programs are doing very well.
39 McCrindle (2009) notes that today’s young professionals are increasingly urban, a challenge for the geo-sciences where many jobs require significant periods of work in the field or in remote locations. In addition, the social interaction of this generation is generally more informal than of their parents (the baby boomers), both in their social lives and at work. The younger generation feels less comfortable in ‘old fashioned’ hierarchical and top down work environments. These trends are part and parcel of globalization, which brings changes in the world economy that deeply alters the labour market.
40 Most members of Generation Y onwards were raised by two working parents, requiring creative solutions to day-to-day challenges and increasing their time away from the family home in day care facilities, with babysitters and in after-school care programs, a situation in marked contrast to that of most baby boomers, who were predominantly raised in families in which one parent, most often the father, was the breadwinner and the other parent, most often the mother, the stay-at-home parent. In addition, more Gen Y members were raised in single-parent families or with step-parents than the generations before them. These massive shifts in western society by necessity have an effect on the attitudes and perceptions of these generations (McCrindle 2009).
41 In addition, the world is globalizing at an extremely rapid pace and,by necessity, the experiences of formerly distant cultures become more shared so that younger generations share more values across the globe than older generations (Ericsson 2009).
42 Where baby boomers generally felt comfortable in hierarchical relations, with clear lines of instruction and supervision, Gen Y functions better under consensus, equality, creativity, ownership (of processes and products) and innovation (McCrindle 2009). Is this why the urban, high tech industry, with its innovative, informal companies, personified by jeans and hoodie-clad multimillionaire CEOs might appear more attractive to this generation?
43 Does the high tech sector attract more innovative talent? If it does, does this mean that, for example, earth sciences become less attractive to such talents? Schlumberger Business Consultants researched many of these value issues as part of their effort to be able to be ahead of ‘the great crew change’ (the retiring baby boomers) (SBC 2012). If our sector needs techsavvy recruits, it also must nurture innovative environments. SBC found that new geosciences recruits reach ‘autonomy’ (capability of making independent decisions that have major business and technological consequences) after about 4 years in innovative companies, but only after about 10 years in conservative companies. Innovation in this case also means that the organization is willing to take risks with people, which is expressed in such parameters as training opportunities, letting people learn on risky assignments (‘blended learning’) and emphasizing the importance of sharing knowledge. Sharing knowledge is an acquired skill. Whereas the earth science sector is part of the knowledge economy, knowledge sharing must be learned and actively encouraged. Does our sector pay enough attention to this attribute? Do we know whether Gen Y and Z are sufficiently attracted to the today’s geosciences corporate culture? Do we attract sufficient numbers of innovative talents to our field?
CONCLUSIONS
44 Canadian earth science departments will not be capable of producing a sufficient number of graduates to satisfy the needs of the Canadian labour market. The departments need to come together with employers to forge a nationally coordinated outreach program. Such a program must pay special attention to non-traditional talent pools.
45 The Canadian earth science community should embark on a nationally coordinated effort to work with specific countries that have a surplus of geoscientists to be able to increase this component of forecasted new Canadians.
46 These conclusions are in line with a recent report outlining the benefits of international students to the Canadian economy and a report urging Canadian universities to double their international student enrolment within 10 years (Advisory Panel on Canada’s International Education Strategy 2012; Roslyn Kunin and Associates 2012).
Special acknowledgement is due to department heads and chairs, and their administrative staff who annually provide the raw data from often uncooperative university student record systems, for the CCCESD head count, and to Alan Beck, who maintained the count for nearly 30 years. We also thank one anonymous reviewer for constructive comments.