Series
Remote Predictive Mapping 4.
Utilizing High Resolution Satellite Imagery, Western Minto Inlier, Victoria Island, NWT
SUMMARY
The very high spatial resolution and stereo capability of GeoEye-1 images were utilized to map the geology of a part of the western Neoproterozoic Minto Inlier on Victoria Island. To optimize the results of predictive mapping, a LANDSAT-7 image together with a SPOT-5 image were also used in concert with the GeoEye-1 images. The predictive bedrock geology map, interpreted based on 3D stereo visualization, presents much more detailed geological information compared to the existing 1:500,000 scale geological map of the area. The high spatial and moderate spectral resolution of GeoEye images allowed us to distinguish a black shale unit (black shale member), and resolve subtle spectral and textural differences between massive stromatolitic dolostone and dolostone containing fine-grained interlayers in an upper carbonate member. As well, an important distinction could be made between Proterozoic sedimentary strata and unconformably overlying interlayered sandstone and carbonate rocks of Cambro-Ordovician age. The SWIR bands in the LANDSAT and SPOT images proved to be very useful in identifying gabbro sills. A geological map, based on field work, was used to evaluate the remote predictive map. Comparison of the predictive map with the field map shows that the two maps look similar in terms of the regional distribution of the lithological units; however, there are discrepancies between the two maps, especially in areas in which the bedrock is covered by glacial sediments and/or other overburden materials. The spectral similarity between different stratigraphic units comprising similar rock types, also contributed to differences between the predictive map and the field map.
SOMMAIRE
Nous avons utilisé la très haute résolution spatiale et les capacités stéréoscopiques des images GeoEye-1 pour cartographier la géologie d’une partie de la partie ouest de l’enclave de Minto, datant du Néoprotérozoïque, de l’île Victoria. Pour optimiser les résultats de la cartographie prédictive, nous avons aussi utilisé une image LANDSAT-7 et une image SPOT-5 avec les images GeoEye-1. Les cartes géologiques prédictives du substratum rocheux, interprétées à partir d’une visualisation stéréoscopique 3D, présentent des renseignements géologiques beaucoup plus détaillés que la carte géologique actuelle de cette zone à l’échelle de 1/500 000. La haute résolution spatiale et la résolution spectrale modérée des images GeoEye nous ont permis de distinguer une unité d’ampélite (membre d’ampélite) et de résoudre des différences spectrales et texturales subtiles entre la dolomie stromatolithique massive et la dolomie contenant des interstrates à grain fin dans un membre carbonaté supérieur. De plus, nous avons pu faire une distinction importante entre les strates sédimentaires du Protérozoïque et les couches interstratifiées de roches carbonatées et de grès du Cambro-Ordovicien qui les surmontent en discordance. Les bandes IRCL des images des satellites LANDSAT et SPOT ont été très utiles pour identifier les filons-couches de gabbro. Une carte géologique basée sur des travaux réalisés sur le terrain a servi à évaluer la carte de télécartographie prédictive. Une comparaison de la carte prédictive et de la carte dressée sur le terrain montre que les deux cartes semblent similaires en ce qui a trait à la répartition régionale des unités lithologiques; mais il y a des différences, surtout aux endroits où le substratum rocheux est couvert de sédiments glaciaires et/ou d’autres matériaux de recouvrement. La similitude spectrale entre les différentes unités stratigraphiques ayant des lithologies similaires a aussi contribué à causer des différences entre la carte prédictive et la carte dressée sur le terrain.
INTRODUCTION
1 Over the last three decades, multispectral remote sensing data have played an important role in many geological studies particularly in arid areas with limited infrastructural access (Sabins 2007; Drury 2001; Vincent 1997; Harris 2008) However, the Canadian environment offers a challenge to the application of remote sensing for geological mapping because of extensive vegetation and surficial cover. Even in the cold desert environment of Canada’s North, ubiquitous lichen cover presents an obstacle for optical remote sensing which relies on the identification of rock forming minerals through spectral reflectance responses (spectral signatures). The Remote Predictive Mapping (RPM) project, a component of the Geological Survey of Canada’s Geo-mapping for Energy and Minerals (GEM) program, is evaluating various types of remotely sensed imagery for geological mapping in Canada’s North. As part of GEM, the Minto Inlier of Victoria Island is being mapped with a focus on its mineral potential. The Minto Inlier offers an ideal environment for the assessment of remote sensing technology because the rocks are well exposed and offer high spectral contrast.
2 In this study, we evaluate 3 optical sensors for geological mapping; LANDSAT7 ETM + , SPOT-5 and high resolution GeoEye. LANDSAT-7 has been a global workhorse for many remote sensing applications, including geology. Its moderate spatial and spectral resolution has led to successful geological applications in many parts of Canada’s North (see Harris 2008, and papers within). High spatial and moderate spectral resolution together with the stereo imaging capability of SPOT-5 has also been utilized for geological applications (Gupta 2003; Lillesand and Kieffer 2000). GeoEye-1 (GeoEye 2009) is a relatively new optical sensor that offers very high spatial resolution, moderate spectral resolution (poorer than LANDSAT and SPOT) and the ability to image in stereo. The high spatial resolution and stereo capabilities provides the geologist with a data source that now rivals, and in some cases, surpasses aerial photographs, which have seen traditional use by mapping geologists over the past 100 years. In this paper, we have relied on simple image enhancement followed by visual interpretation (extraction) of geological information from all image types. The interpretation scheme we utilize follows closely the RPM protocols set forth by Harris (2008). We used a ‘heads-up‘ digitization (interpretation) process whereby image interpretations are made directly on a touch-sensitive computer screen utilizing stereo visualization of the GeoEye imagery. We compare and contrast the LANDSAT and SPOT with the GeoEye data for geological mapping and develop image interpretation protocols, in addition to those defined by Harris (2008) for other geologists to utilize and adapt in their own mapping endeavours.
 Display large image of Figure 1
STUDY AREA
Geology
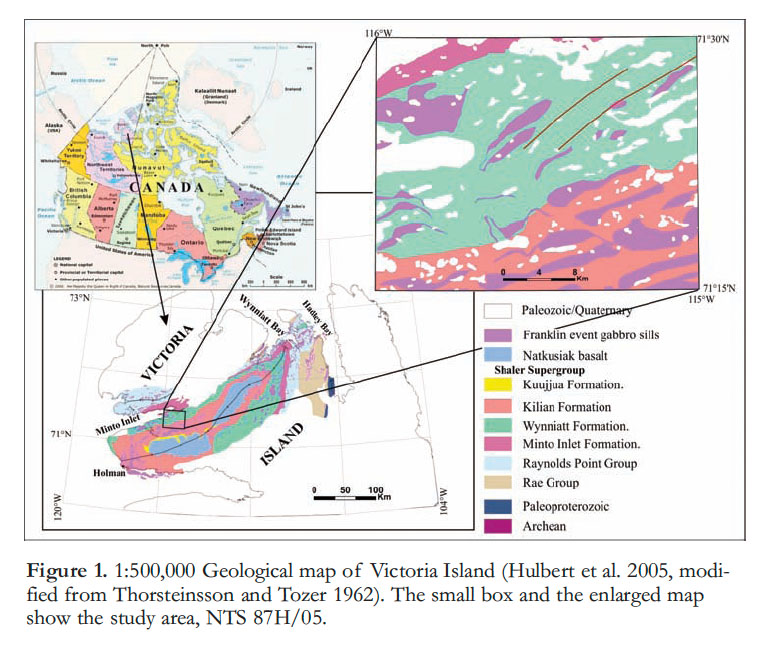
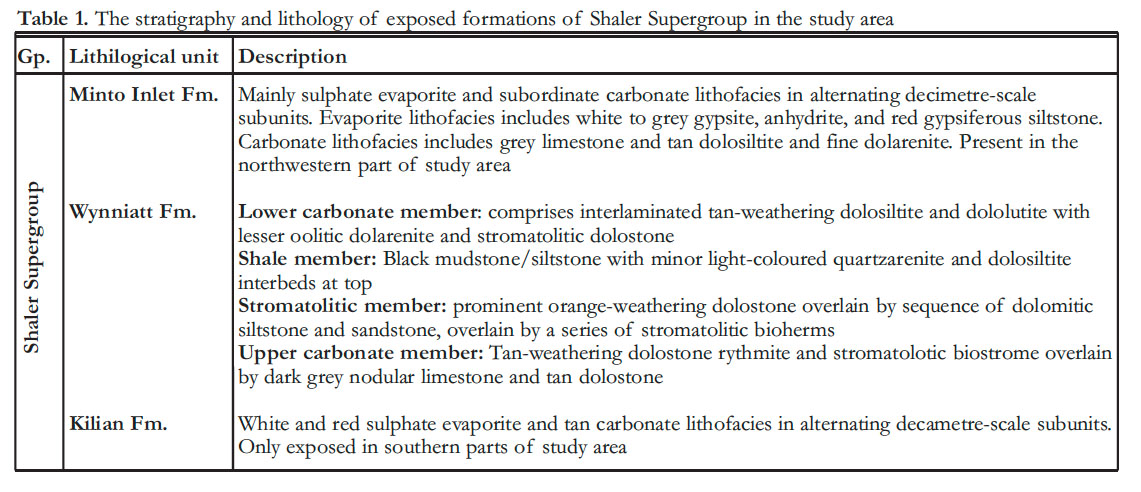
3 The study area covers mapsheet NTS 87H/05 and is within the western Minto Inlier on Victoria Island (Figure 1). The Minto Inlier, first recognized and mapped by Thorsteinsson and Tozer (1962), is a northeast-trending belt of early Neoproterozoic sedimentary rocks of the Shaler Supergroup, which are intruded by gabbro sills and dykes capped by coeval flood basalt. The succession was gently folded forming an open syncline and a smaller anticline before deposition of an unconformably overlying shallow marine succession of Cambro-Ordovician age. The Shaler Supergroup is a ca. 4-km-thick succession of shallow marine carbonate rocks, shallow marine and fluvial clastic rocks and peritidal evaporites that were deposited in a very broad and shallow intracontinental sea, the Amundsen Basin (Young 1981). Other remnants of this basin are preserved in other inliers along the northern mainland coast and Banks Island and these can be traced to similar exposures in the northern Cordillera (Rainbird et al. 1996; Long et al. 2008). The maximum age of the Shaler Supergroup is ~1000 Ma based on detrital zircon geochronology (Rainbird et al. 1992; 1997) and its minimum age is 720 Ma, the age of the gabbro sills that intrude it (Heaman et al. 1992). The Shaler Supergroup includes, in ascending stratigraphic order, the Rae Group, Reynolds Point Group, Minto Inlet Formation, Wynniatt Formation, Kilian Formation and Kuujjua Formation (Figure 1; Rainbird et al. 1994). The Minto Inlet, Wynniatt and Kilian formations are exposed in the study area and are described, in detail, in Table 1.
4 The Minto Inlier and overlying Cambro-Ordovician rocks are cut by a prominent NE-striking fault zone, present in the northern half of the study area.
 Display large image of Table 1
Mineralization
5 At about 720 Ma, mantle-derived mafic magmas of the Franklin event were injected into a broad area of the Canadian Shield from northern Baffin Island to the western Arctic islands (Jefferson et al. 1994) manifested as an extensive NW-trending dyke swarm (Heaman et al. 1992). In the Minto Inlier, the Franklin magmas were intruded mainly as 5–50m-thick sills between sedimentary rocks of the Shaler Supergroup. This geologic setting is reported to be favourable for Ni, Cu and PGE (Fahrig et al. 1971; Heaman et al. 1992). Jefferson et al. (1994) compared the Neoproterozoic Franklin event of Arctic Canada with the Permo-Triassic Noril’sk-Talnakh Ni–Cu–PGE deposits of Russia. They rated a high potential for Ni–Cu–PGE mineralization based on similarities in the scale and duration of the magmatic events, host rock types, volcanic stratigraphy and petrology, tectonic setting, associated major faults, sources of S, Se, and As, magmatic differentiation, geophysical anomalies and other features. In particular, the northeast-striking fault zone, described above could be an analogue to the Noril’sk-Kharaelakh Fault which is thought to be critical to localization of the massive sulphide deposits at Noril’sk (Jefferson et al. 1994).
6 The Minto Inlier has also been reported to have high potential for other types of Cu mineralization, such as Kuperschiefer and volcanic Red Bed (Rainbird et al. 1992). The potential for carbonate-hosted zinc-lead (MVT) mineralization, similar to that in the Mackenzie Mountains (Dewing et al. 2006) exists in dolomitized carbonates of the Wynniatt Formation.
DATA
GeoEye-1
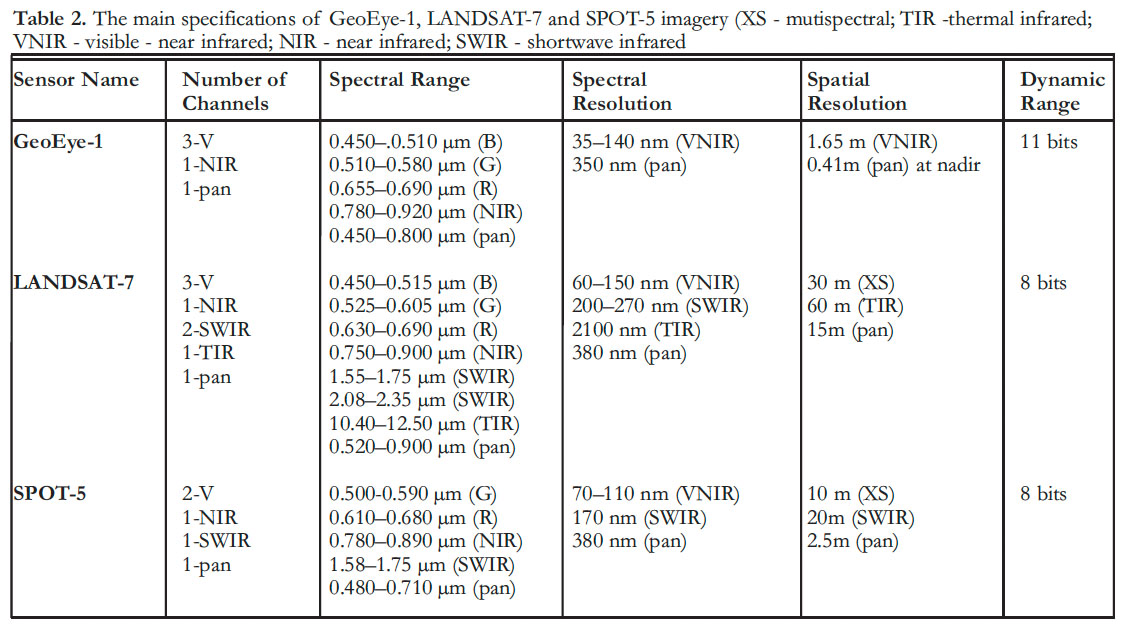
7 The very high spatial resolution and stereo capability of GeoEye-1 imagery were utilized to create a predictive geology map of the study area. The GeoEye-1 pushbroom satellite, formerly known as OrbView-5, was launched on September 2008 from Vandenburg Air Force Base in California. The satellite orbits the Earth 15 times per day in a near-polar, sun-synchronous orbit at an altitude of 681 km with a nominal equator crossing at 10:30 AM local. GeoEye-1 simultaneously collects panchromatic imagery at 0.41 m pixel resolution and multispectral (VNIR) imagery at 1.65 m resolution (GeoEye 2009). The nominal swath width of the satellite is 15.2 km at nadir and the revisit time is less than three days. Table 2 presents the main specifications of the GeoEye-1 imagery (GeoEye 2009).
8 Remotely sensed images can be used for stereoscopic viewing provided the two images forming a stereo pair are geometrically compatible (Gupta 2003). A remote sensing satellite with stereo-imaging capability is able to capture images in stereo mode using either across-track or along-track configurations. Along-track stereo pairs (e.g. ASTER imagery) are images of the same location taken from two different perspectives during a single pass of the satellite. Across-track images (e.g. SPOT imagery) are typically taken from a location by the same sensor on multiple orbits. GeoEye-1, being capable of rotating or swivelling forward, backward or side-to-side can capture images in any direction (up to 60° off nadir, along- and across-track). The GeoEye stereo pairs are collected on the same orbital pass (along-track). This results in superior image quality because of a short time span between the two images resulting in the same atmospheric lighting conditions and scene content, as well as better metric accuracy. Each stereo pair contains an image collected at a low elevation angle (above 60°) as well as an image collected at a higher elevation angle (above 72°) with 30°−45° convergence (0.54−0.83 base-to-height ratio (Eurimage 2010). A Rational Polynomial Coefficient (RPC) camera model maps the respective ground coordinates (latitude, longitude, height) to image coordinates (line, sample).
9 The GeoEye dataset comprises four stereo pairs acquired from June 27 to July 27, 2009, with each stereo pair collected at the same time. An orthorectified mosaic covering the NTS87H/05 was also used for 2D interpretations. A DEM with a resolution of 15 m, derived from the stereo GeoEye imagery, was also produced. The DEM was used to orthorectify the GeoEye imagery but was not used in the interpretation process. The GeoEye multispectral bands were resampled to 1 m resolution using a bi-linear interpolation algorithm in both image types.
 Display large image of Table 2
LANDSAT-7 ETM+ and SPOT-5
10 A LANDSAT-7 ETM + image, acquired on July 14, 2002, together with a SPOT-5 image acquired on August 22, 2009, were used in concert with the GeoEye-1 images to provide higher spectral resolution compared to GeoEye-1 imagery (Table 2). The SPOT image had a small gap for the northwest part of the study area. The satellites are both well known and well-used in various geoscience applications. More details on these sensors can be found in Lillesand and Keiffer (2000), Drury (2001) and Harris (2008).
METHOD
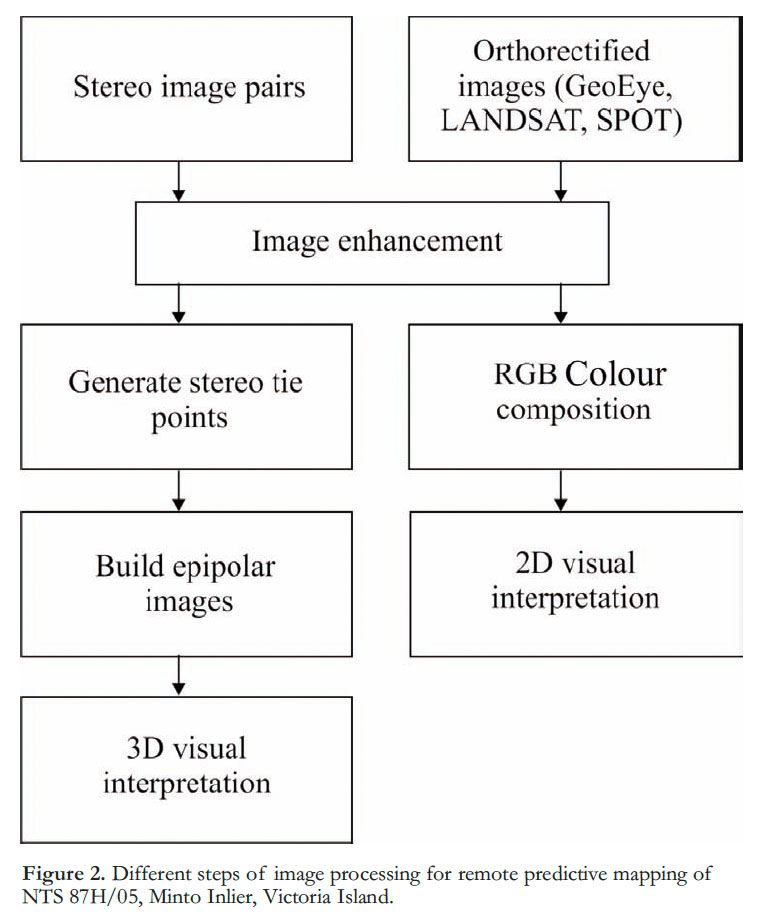
11 The steps involved in the image processing and analysis for producing the predictive geological map are shown in Figure 2. The ENVI™ image processing software, equipped with the DEM extraction module and ENVI™ Zoom, was used for image visualization and analysis. The images were first corrected for atmospheric effects using the dark pixel subtraction method and were enhanced by contrast stretching. An empirical procedure to correct the data for path radiance is to locate areas of deep and clear waters, or shadow where the reflectance is expected to be null. The DN values for these pixels in each band can be attributed to path radiance and consequently subtracted from all other pixel values in the respective bands (Gupta 2003). To obtain better discrimination between various lithological and structural features, areas covered with water, ice, and vegetation were first masked out from the images and then the radiometric ranges obtained this way for each band were used to apply a linear contrast stretching on the original image which included the ice, water, and vegetation. By applying threshold values on GeoEye bands 1 and 4 respectively, ice and water were classified and then removed from the images. The well-known Normalized Difference Vegetation Index (NDVI) was applied to characterize the vegetation distribution on the images. The NDVI has a dynamic range from -1 to +1 (Chuvieco and Huete 2010) and is defined as:
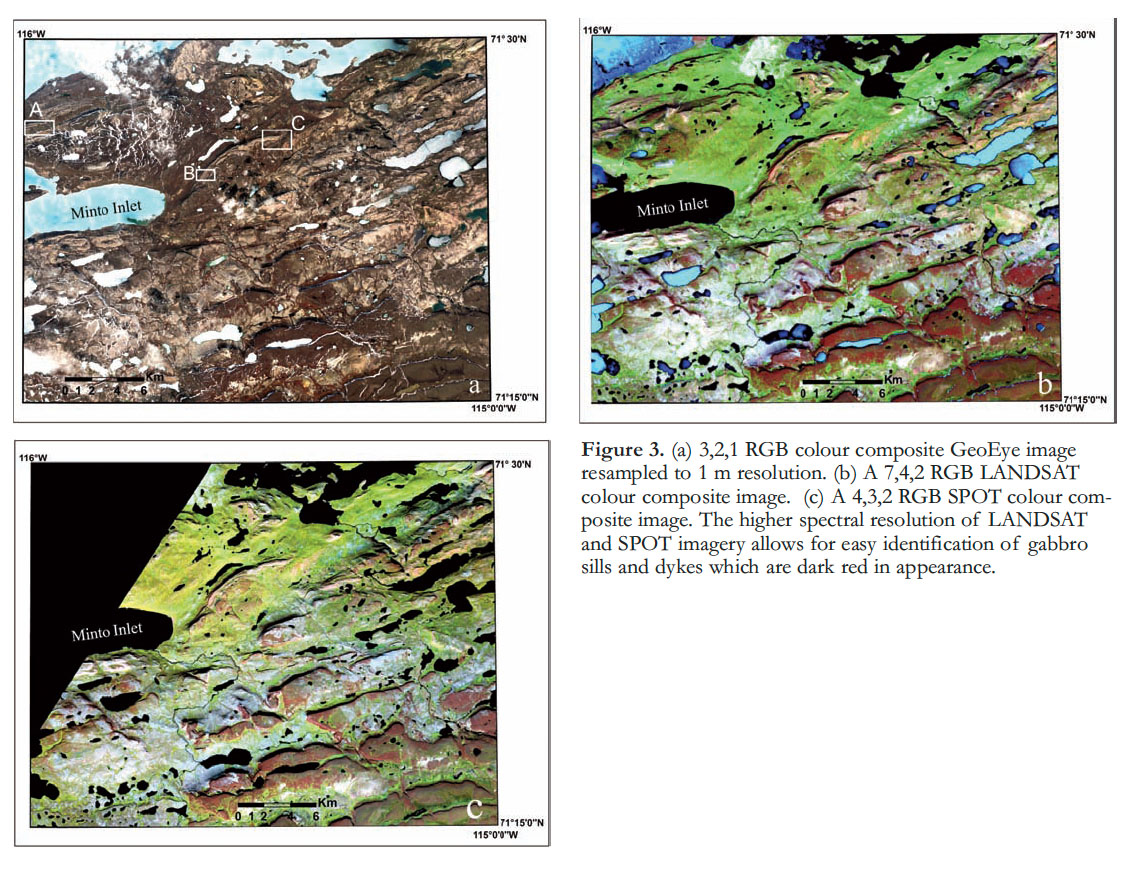
Threshold values (~ 2 standard deviations above the mean) were used to classify the NDVI image into vegetation and non-vegetation. The vegetation image was then used as a mask to remove the vegetation pixels from the imagery. Similarly, LANDSAT bands 1 and 4, and NDVI images were used to remove ice, water, and vegetation pixels from the LANDSAT image. To enhance the SPOT image, the threshold values on SPOT bands 2 and 3 and NDVI image were applied in the same way to classify and remove the ice, water and vegetation from the image respectively. A linear contrast stretch was applied on the original images (including ice, water, and vegetation) using the radiometric ranges obtained from water, ice, and vegetation free images. Figure 3 presents GeoEye bands 3,2,1, LANDSAT bands 7,4,2 and SPOT bands 4,3,2 as RGB colour composites images. The gabbro sills are clearly distinguished in dark red and the vegetation in green on the LANDSAT and SPOT images.
 Display large image of Figure 2
12 The 3D structure from one image alone cannot be inferred because the depth information is lost when acquiring the image (McGlone et al. 2004). The aim of stereoscopic viewing is to provide 3D or depth perception. To extract the 3D stereo view for the study area, the RPC camera models were used to build epipolar geometry for each pair of GeoEye images, using the ENVI™ DEM extraction module.
13 Epipolar geometry describes the geometrical constraint between two frame images of the stereo pair and is essential for 3D stereo viewing and DEM extraction. It represents the fact that a ground point and the two optical centres lie on the same plane. This means that for a given point in one image, its conjugate point in the other image must lie on a known line in the second image (ENVI 2009; McGlone et al. 2004). One essential step in generating epipolar images is creating tie points which are used to define the epipolar geometry. The RPCs are used to generate tie points and to calculate the stereo image pair relationship. The RPC camera model is simply the ratio of two cubic functions of latitude, longitude, and height that provide the conjugate image coordinate (Dial and Grodecki 2005). The stereo tie points were collected interactively for each image pair with the maximum Y parallax less than 0.63 pixel size (1m) and were used to build the epipolar images. The left and right epipolar images when viewed as red and blue bands respectively, create an anaglyph image, which can render a 3D view using a pair of red-blue anaglyph glasses. Figure 4 presents the left epipolar (Fig. 4a), right epipolar (Fig. 4c), and the anaglyph (Fig. 4b) images for the eastern portion of the study area.
14 The stereo GeoEye data were used in concert with the LANDSAT and SPOT data to produce the predictive map through simple photogeologic interpretation utilizing a heads-up digitization (interpretation) process. This involved interpreting geologic features directly on a touch-sensitive computer screen using a stylus pen. Thus the interpretations were captured digitally and were fully geo-referenced to the imagery within the GIS database. This by-passes the step of laborious interpretation on mylar overlays followed by geo-referencing using a digitizing table.
RESULTS
Remote Predictive map comparison to the existing legacy geological map
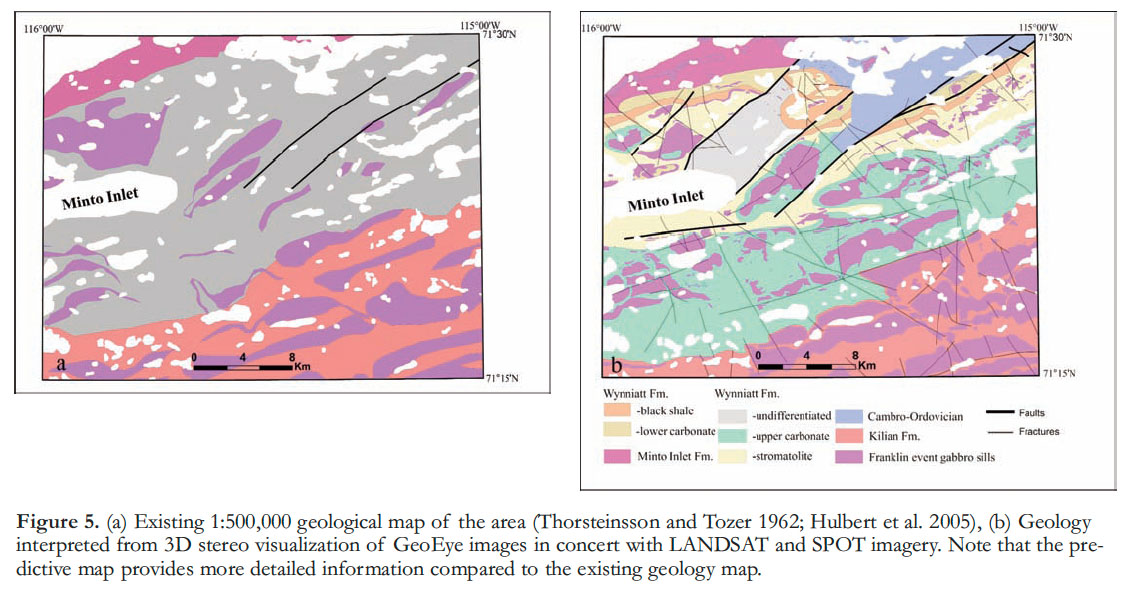
15 The resulting predictive map (Fig. 5b) presents much more detailed information compared to the existing 1:500,000 scale geological map of the area (Fig. 5a; Thorsteinsson and Tozer 1962; Hulbert et al. 2005). The main lithological units exposed in the study area are the Minto Inlet, Wynniatt, and Kilian formations of the Shaler Supergroup, along with gabbro sills and dykes of Franklin magmatic event and Paleozoic succession of CambroOrdovician age. With the aid of recent reconnaissance-level field observations and previous mapping (Rainbird, 1998), one of the main map units, the Wynniatt Formation, was divided into four sub-units (members) and these are recognized in the GeoEye images throughout most of the map area.
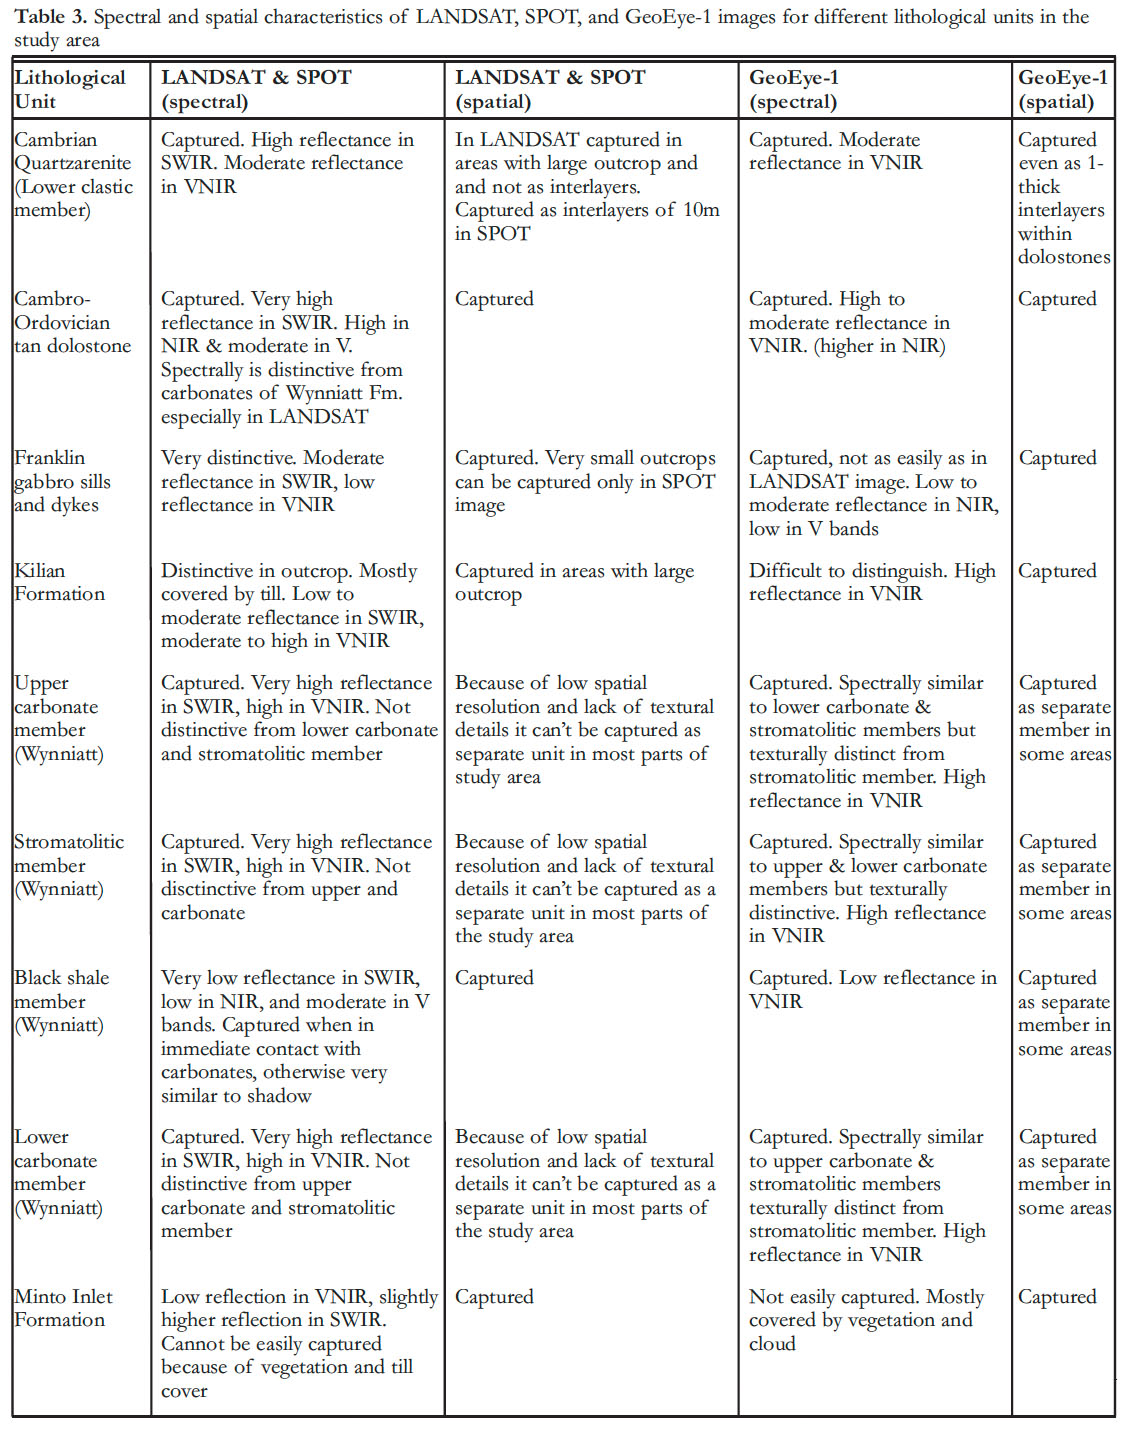
16 The LANDSAT and SPOT SWIR bands proved to be superior for distinguishing gabbro sills and dykes from sedimentary rocks of the Shaler Supergroup. The SPOT image because of the one SWIR band and 10 m spatial resolution, proved to be superior for capturing small outcrops of gabbro, which were not detected on the LANDSAT and GeoEye images. Thus the LANDSAT and SPOT data were employed as complimentary sources of lithologic information for producing the predictive map. In the areas covered by the glacial till, other overburden or vegetation, the contacts between the units were inferred by extrapolation and expert knowledge. Table 3 presents the spectral and spatial characteristics of each lithological unit (derived from the existing geology maps; Figs.1 and 5a and recent field studies) for the LANDSAT, SPOT and GeoEye images respectively.
 Display large image of Figure 3
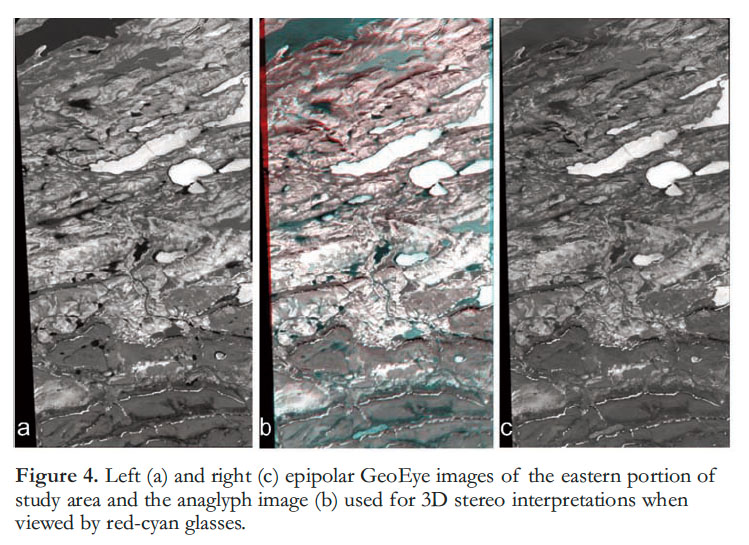 Display large image of Figure 4
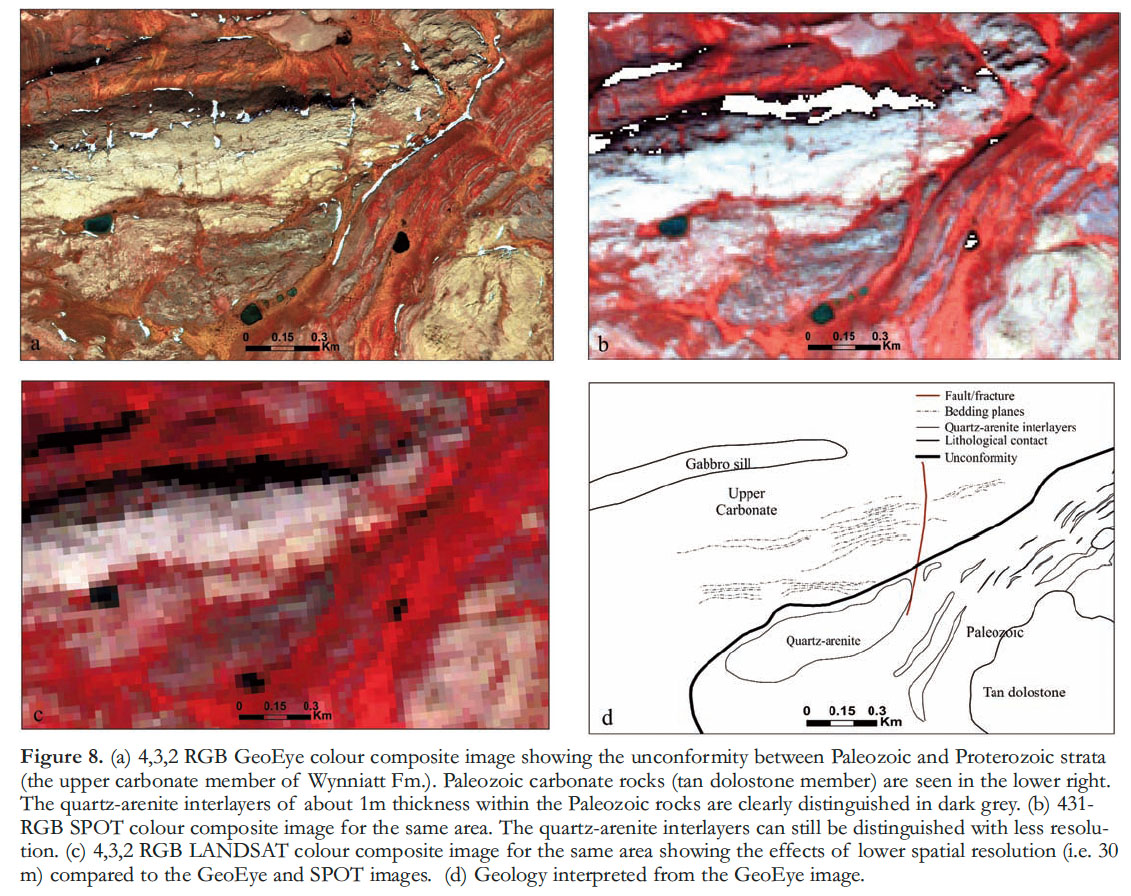
17 The high spatial and moderate spectral resolution of the GeoEye imagery enabled the identification of a black shale unit (black shale member) characterized by low reflectance (Figure 6) and to distinguish (by subtle spectral and textural differences) parallel-stratified to massive stromatolitic dolostones (stromatolitic carbonate member) from underlying and overlying dolostones containing fine-grained interlayers (lower and upper carbonate members, respectively). Figures 6 and 7 are bands 4,3,2 RGB colour composite GeoEye images of small portions of the study area (boxes A and B in Fig. 3a) which provide invaluable structural and lithological details of the Wynniatt Formation and the gabbro sills. As well, an important distinction could be made between Proterozoic sedimentary strata and unconformably overlying interlayered sandstone and carbonate rocks of Cambro-Ordovician age (Fig. 8; Box C in Fig. 3a), which is not indicated in the existing geology map (Fig. 5a) (see Fig. 8d) The high spatial resolution of GeoEye images also facilitated the identification and mapping of the thin (up to 1 m thick) sandstone interlayers in the carbonate rocks of Cambro-Ordovician succession. Figure 8-a, b and c compare the spatial resolution of GeoEye, LANDSAT and SPOT images. The very high spatial resolution of the GeoEye image, despite its lower spectral resolution compared to LANDSAT and SPOT images, provides more detailed textural information, which is very useful for identifying different rock types and geologic structures (see Fig. 8d). While generating the remote predictive map, the Cambro-Ordovician succession was not sub-divided even though in some areas different sub-units could be clearly distinguished on the GeoEye Imagery (Figs. 8a and 9b). This was because, initially, the Paleozoic rocks were not the focus of our study, but after work in the field, we realized that they occupied a much more significant part of the map area. Furthermore, in many areas, Cambrian carbonates were visually very similar to Proterozoic carbonates and could only be separated based on their fossil content.
 Display large image of Figure 5
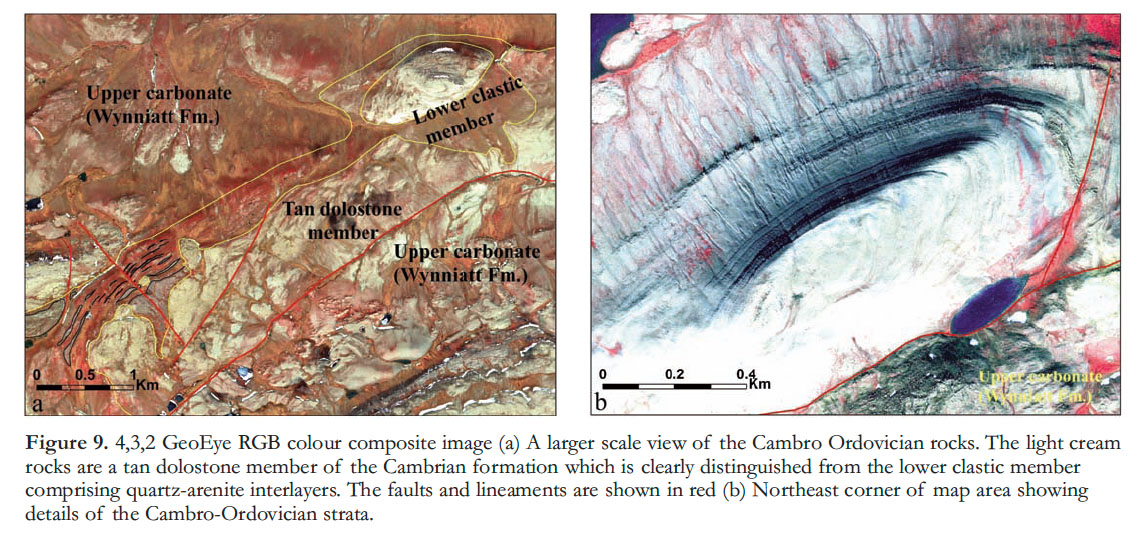
18 Figure 9a is a 4,3,2 GeoEye RGB colour composite image that provides a more regional view of the Cambro-Ordovician rocks. The carbonate unit (labelled tan dolostone member) is shown in cream and has a clear mappable contact with the lower clastic member containing quartz-arenite interlayers. Figure 9b is also a 4,3,2 GeoEye RGB colour composite image covering the northeast corner of the map area showing some details of the Cambro-Ordovician strata.
Evaluation of the Predictive Map – Comparison to the map generated by field work
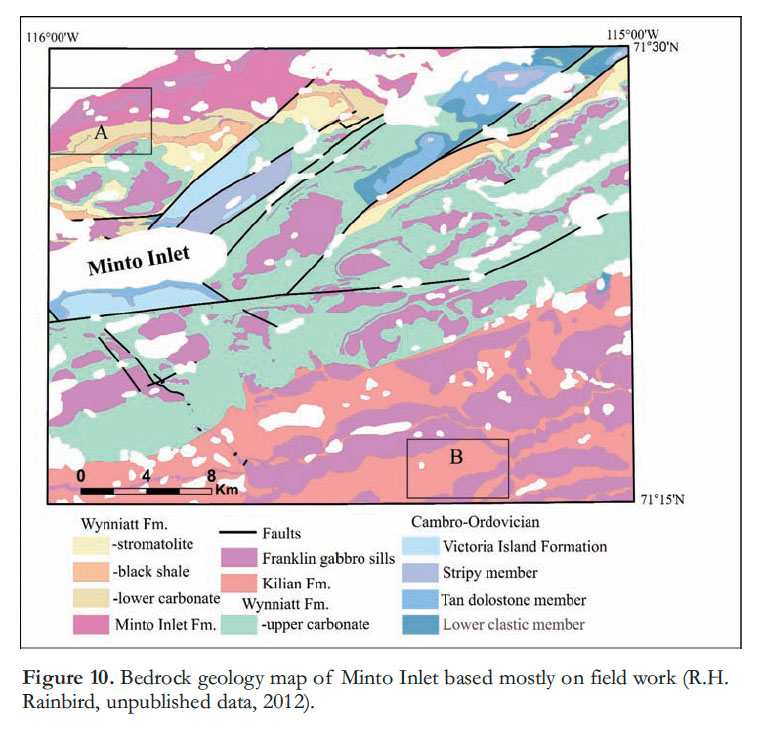
19 A field mapping program was carried out in 2010 and 2011 over the study area under the Geo-mapping for Energy and Minerals (GEM) program, Natural Resources Canada. The bedrock geology map (Fig. 10) was produced largely from field observations using SPOT imagery as a visual mapping guide. The field (Fig. 10) and predictive maps (Fig. 5b) look similar in terms of the regional distribution of lithological units but the field map provides important updates to the predictive map particularly in areas where a thin veneer of Quaternary surficial deposits masks defining spectral attributes.
20 One of the main differences between the two maps is the subdivision of Cambro-Ordovician rocks into subunits on the field map. This precludes a quantitative comparison of the two maps using cross-tabulation and as such our comparison is based on a visual assessment of the maps on a unit-to-unit basis as discussed in the next sections on a formation basis.
Minto Inlet Formation
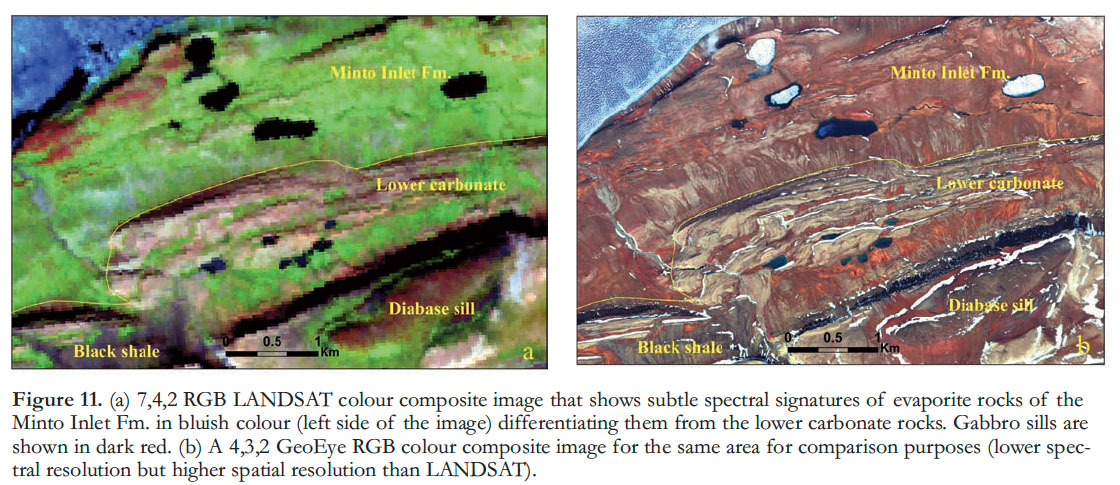
21 The lithological contact between the evaporite rocks of Minto Inlet Formation and the lower carbonate member (Wymiatt Formation) is covered by vegetation in most areas (Fig. 11) and locally by cloud in the GeoEye image. There are scattered exposures that are distinguished only in LANDSAT and SPOT images. Figure 11a is a 7,4,2 LANDSAT RGB colour composite image of the western exposure of these units (Box A in Fig. 10) that shows the Minto Inlet in bluish tone in scattered exposures. There was no SPOT coverage for this part of map area. Figure 11b is a 4,3,2 GeoEye RGB colour composite image of the same area. Despite the higher spatial resolution there is no subtle spectral difference between the rock units. The scattered exposures were used to infer the lithological contact for the covered areas for the rest of map area, which accounts for the small disagreement between the predictive and field maps. Otherwise the two maps are in good agreement regarding this lithological unit.
 Display large image of Table 3
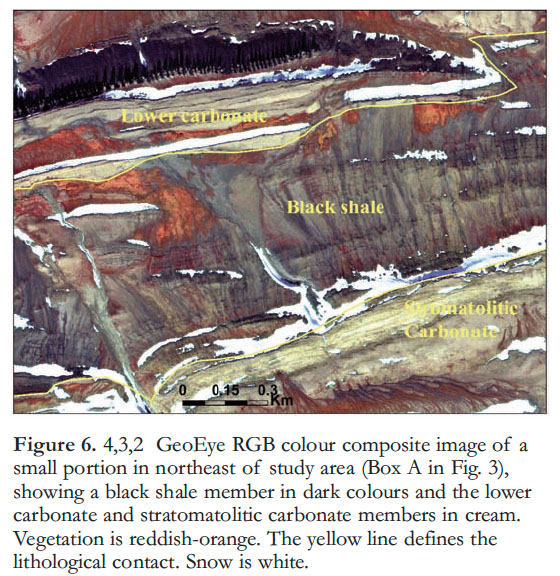 Display large image of Figure 6
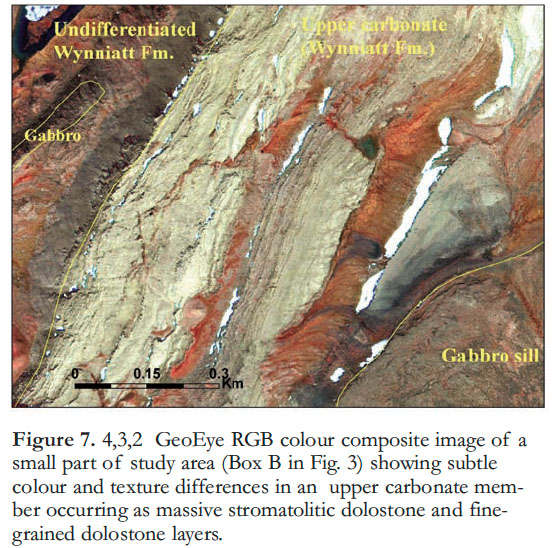 Display large image of Figure 7
22
Wynniatt Formation
23 The level of agreement between the field and predictive maps is high with respect to the Wynniatt Formation carbonate rocks. However, on the predictive map, the upper carbonate member has been incorrectly mapped as a stromatolitic and lower carbonate member, places. This is because the spectral response of the carbonate members is very similar. The very high spatial resolution of the GeoEye imagery show subtle textural differences between the massive stromatolitic dolostone and the fine-grained dolostone layers (Fig. 7), which led us to map the stromatolitic dolostone as the stromatolitic member of Wynniatt Formation. Field work revealed that these strata actually belong to the upper carbonate member, which also contains stromatolitic biostromes. The black shale member is also less extensive on the field map in the central-northern part of the map area compared to the predictive map. Again, most of the difference between the predictive and field maps occurs in areas covered by glacial/surficial material.
Kilian Formation
24 The evaporite and carbonate rocks of the Kilian Formation are mappable on the LANDSAT and SPOT images because of the higher spectral resolution of these images compared to that of the GeoEye imagery. Figure 12a is a 4,3,2 SPOT RGB colour composite image (Box B in Fig.10) showing these rocks in purple and bluish colour. Figure 12b is a 4,3,2 GeoEye RGB colour composite image for the same area. The Kilian Formation is covered with the glacial till especially in the western parts of the map area for which the lithological contact was inferred by extrapolation. Comparison of the predictive and field maps shows some discrepancy especially in areas covered by surficial materials.
Cambro-Ordovician Units
25 One of the main contributions of the field work was subdivision of the Cambro-Ordovician rocks. These units in the map area include, in ascending stratigraphic order, the lower clastic member, tan dolostone member, and stripy member of Cambrian age, and Victoria Island Formation of Ordovician age. (K. Dewing and T. Hadlari, personal communications, 2011). The lower clastic and tan-dolostone members are well exposed in the north-central part of the map area where they unconformably overlie Proterozoic rock units (Figs. 8 and 9a). These rock units are covered by surface material in surrounding areas although some outcrops appear in the northern part and northeast corner of the map area (Fig. 9b). Thus the concealed contact was inferred using scattered outcrops in many areas. These units were not mapped on the predictive map despite clear differences in spectral response because the original focus of the mapping was on the Proterozoic rocks. The SWIR bands (LANDSAT and SPOT) were particularly useful in distinguishing the tan-dolostone unit from Wynniatt Formation carbonates. The other exposure of Cambro-Ordovician rocks occurs in the western part of the map area where they are in fault contact with the upper carbonate unit of the Wynniatt Formation. These areas are covered mostly by vegetation and, unfortunately, some cloud (in the GeoEye imagery) and were mapped as undifferentiated Wynniatt Formation as they were surrounded by Wynniatt Formation carbonate.
 Display large image of Figure 8
Franklin Gabbro Sills and Dykes
26 Gabbro sills and dykes provide the highest level of agreement between the predictive and field maps. They are easily mapped on the remotely sensed data (LANDSAT, SPOT especially) as their spectral characteristics in the SWIR bands are very different (moderately reflective) from those of other rock types. There are only a few areas in which the sills are unrecognized either on the predictive map or on the field map. Areas, in which the sills are unrecognized on the predictive map, always coincide with the areas covered with either vegetation or Quaternary deposits. In a few cases some small sills were not identified on the field map. These sills were, in fact, added to the field map after re-examining the remotely sensed images. The SPOT imagery, because of higher spatial resolution, was particularly useful in capturing the small sills which could not be captured on the LANDSAT image. Also, outcrops south of Minto Inlet, which are mapped as Victoria Island Formation carbonate on the field map (Fig. 10), were originally mapped as gabbro sills based on the LANDSAT and GeoEye imagery and latter were corrected to the stromatolitic member of Wynniatt Formation using SPOT image (Fig. 5b).
SUMMARY and CONCLUSIONS
27 The very high spatial resolution and stereo capability of GeoEye-1 images, together with the higher spectral resolution of LANDSAT and high spatial resolution of SPOT, were utilized to analyze and map the geology of a part of the Minto Inlier. The GeoEye imagery provided invaluable information about both structural and lithological features. In areas of good exposure, interlayers of 1 m thickness and subtle textural differences in carbonate units were easily captured. The 3D stereo capability of GeoEye image pairs allowed us to accurately map gabbro sills of varying sizes and extent. The SWIR bands contained in LANDSAT and, to a lesser extent SPOT data, assisted in mapping other rock types.
 Display large image of Figure 9
28 The gabbro sills were clearly displayed in dark red on the LANDSAT 7,4,2 and SPOT 4,3,2 RGB colour composite images, and thus easily mapped in detail. Smaller sills were more evident on SPOT than LANDSAT imagery due to the higher resolution of SPOT. Scattered exposures of evaporite rocks of the Minto Inlet and Kilian formations could also be mapped on the LANDSAT and SPOT imagery due to their unique spectral response.
29 The bedrock geology map of NTS87H/05 based on 2010 and 2011 field work provided important improvements to the predictive map, particularly in areas where a thin veneer of Quaternary surficial deposits masked defining spectral attributes of the various lithological units. Comparison of the predictive map with the field map shows that the two maps look similar in terms of the regional distribution of the lithological units, however there are discrepancies between the two maps which arose mostly from the complicating spectral signatures of overlying glacial sediments and/or other overburden materials. The spectral similarity between different stratigraphic units comprising similar rock types, also contributed to differences between the predictive map and the field map.
 Display large image of Figure 10
30 This study demonstrates the value of undertaking remote predictive mapping prior to regional field mapping. The predictive map generated prior to field work was overall very similar to the map produced through field work with visual supporting information derived from the SPOT imagery. It is to be expected that differences would exist between the two maps as the methods of producing them differ. In fact, the two maps should not be treated as separate products as the final map, in reality, is an integration of both. Predictive mapping is an iterative process whereby predictions are modified, deleted and improved by field mapping. Furthermore, the modified predictive map and imagery used to produce it were used to assist in updating and modifying field maps.
 Display large image of Figure 11
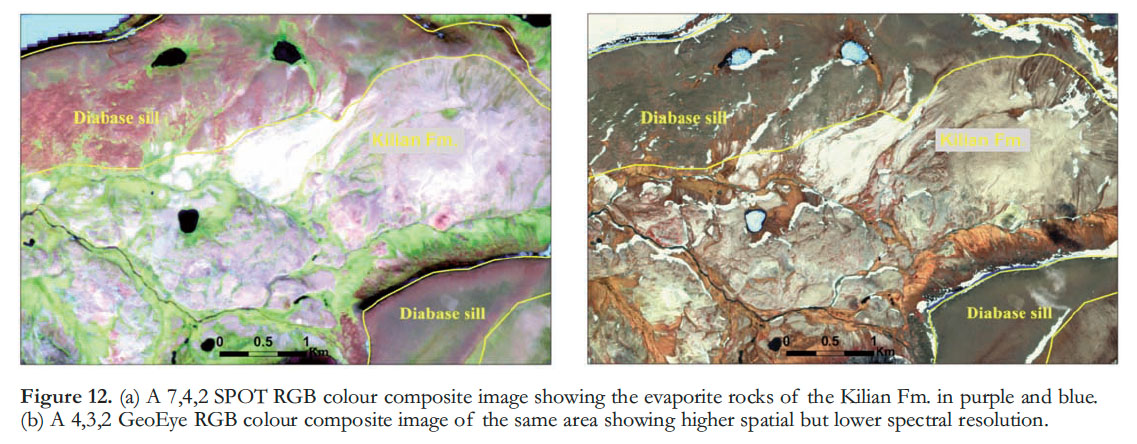 Display large image of Figure 12
31 The Arctic islands and northern Canadian mainland provide an ideal environment for predictive bedrock mapping as exposure is generally good and vegetation cover thin and sporadic. Predictive mapping works best in areas such as the Minto Inlier, where there is moderate to high spectral contrast between rock types that allows mapping of individual spectral units that can be calibrated using existing legacy data, expert knowledge and/ or field work.
This work was funded by Natural Resources Canada’s (NRCan) Geomapping for energy and minerals (GEM) program. We thank 2 anonymous reviewers whose comments and suggestions have contributed to a much clearer presentation of this material. This is Geological of Survey contribution 20110375.