Articles
Understanding Earth–
Ocean Processes using Real-time Data from NEPTUNE, Canada’s Widely Distributed Sensor Networks, Northeast Pacific
SUMMARY
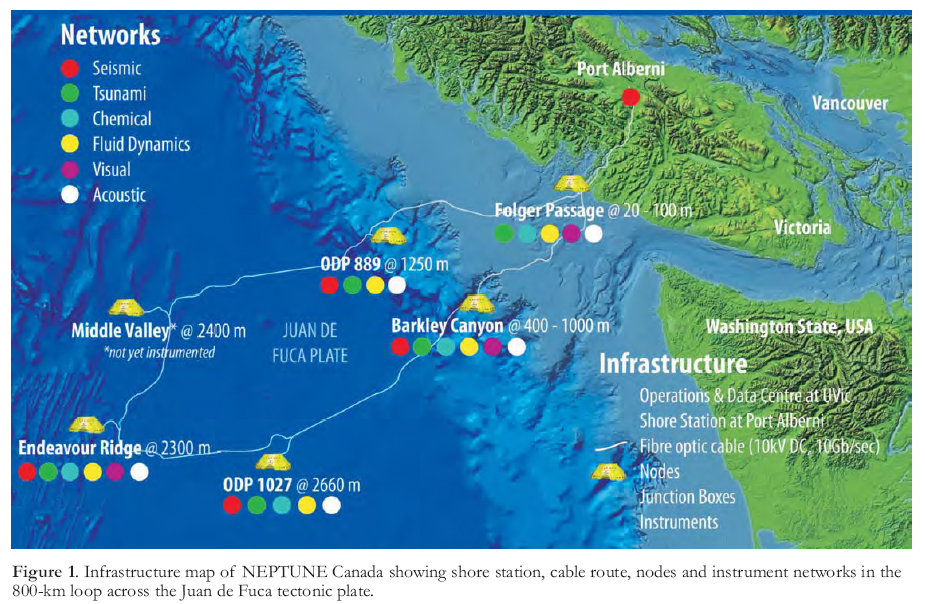
After several years of planning, NEPTUNE Canada [www.neptunecanada.ca], as part of the Ocean Networks Canada Observatory, largely completed the installation of the world’s first regional cabled observatory network in 2009. The 800 km cable loop west of Vancouver Island connects five nodes in coastal, continental slope, abyssal plain and spreading-ridge environments. Abundant power and high-bandwidth communications support a network of hundreds of sensors that deliver data and imagery in real- or near real-time, and will transform our knowledge of the ocean environment and interacting processes. With the world’s oceans and climate in a state of crisis, the development of cabled observatory technologies is most timely and offers a growing data archive of unparalleled importance for new discoveries.
SOMMAIRE
Apres plusieurs années de planification, l’essentiel du premier reseau observatoire régional, NEPTUNE Canada [www.neptunecanada.ca], partie intégrante du Ocean Network Observatory, a été installé en 2009. Ses 800km de cable forment une boucle à l’ Ouest de l’ Isle de Vancouver et sont connectés à cinq noeuds situés au niveau de la zone cotière, du talus continental, de la plaine abyssale et de la dorsale océanique. Grace à cet acces à l’ énergie et la communication à haut débit, un réseau de centaines de capteurs transmettent des données et images en temps réel ou quasi réel, qui transformeront nos connaissances du mileu et processus océaniques. Alors que les océans et le climat sont en état de stress, le dévelopment des technologies liées aux observatoires sous marins représente une opportunité exceptionelle et un recueil de données sans cesse croissant et d’ un potentiel inégalé pour permettre de nouvelles découvertes.
INTRODUCTION
1 The oceans, bounded by the atmosphere, lithosphere and shorelines, and covering 70% of the Earth’s surface, remain a poorly understood component of the Earth system. Climate, and ocean circulation and chemistry are changing, and depletion of ocean life is increasing at an alarming rate, largely a consequence of human activities. There is an imperative for improved public understanding of these environmental changes and for the development of responsive and informed public policy that will better protect society through this century and beyond. It was noted recently (GEOCHANGE 2010, p. 1) that "It has to be acknowledged that humankind is not prepared to enter the era of global natural cataclysms, either technologically, economically, legally, or psychologically. The International Committee GEOCHANGE warns the UN and all governments of the impending danger in order to combine humankind’s efforts to counter large-scale geological disasters." To support future planning and policies, a more quantitative scientific database is required for the ocean realm, a database that has yet to be established after more than a century of investigations drawing on limited data from buoys, battery-operated instruments and ship-based studies.
2 Cabled ocean observatories now represent a new paradigm in scientific investigation that will transform our understanding of the earth–ocean processes within the marine realm (National Research Council 2000; Favali et al. in press). They provide abundant power and high bandwidth communications to remotely controlled sensor networks, which in turn results in abundant real-time data and imagery. More especially, multidisciplinary teams can now investigate short and long-term events and processes, and interrogate a large and growing digital database. Canada is a world-leader through the installation and now operation of the NEPTUNE Canada (NC) and VENUS networks within the Ocean Networks Canada observatory, which are owned and operated by the University of Victoria [www.neptunecanada.ca, www.venus.uvic.ca, www.oceannet-works.ca] as national facilities.
 Display large image of Figure 1
3 The marine realm includes many diverse and extreme environments that have posed severe challenges to adequate investigation and understanding of the various events and processes. The new generation of cabled ocean observatories is now being planned or installed in Canada, US (Ocean Observatories Initiative), Japan (Dense Ocean-floor Network System for Earthquakes and Tsunamis), China, Taiwan (Marine Cable Hosted Observatory), and in the European Union (European Multidisciplinary Seafloor Observatory). In a typical observatory, a backbone cable network adopts sophisticated telecommunications cable technology combined with complex new technologies for power transmission and communication. This system delivers abundant power (up to 10 kV DC) and high bandwidth communication (up to 10 Gb/sec) to support a network of scientific instruments, sensors, and robotics. The network generates continuous time-series of data over a typical observatory design life of 25 or more years. These systems transform the ocean sciences through the volume of real-time data delivered on a 24/7/365/25 basis, by building a vast data repository, by allowing real-time multidisciplinary studies, by enabling worldwide scientific collaborations, and by building on the power of the Internet and social media. These innovations herald a new era of wiring the oceans. This paper focuses on the development of NC as the world’s first regional cabled ocean observatory network and briefly illustrates the novel approaches and technologies applied to investigate complex processes in a variety of extreme environments, from coast to deep sea, off Canada’s west coast, extending into the Northeast Pacific.
4 NEPTUNE (Northeast Pacific Undersea Networked Experiments) Canada covers much of the northern part of the 200 000 km2 Juan de Fuca tectonic plate (Fig. 1). After several years of planning, NC completed the installation of most of the 800 km cable and five observatory nodes in mid 2009 (Barnes et al. 2010; in press); the US National Science Foundation approved the 5-year installation funding of the Ocean Observatories Initiative in late 2009, resulting in the US portion becoming operational in or before 2014 [www.oceanleadership.org]. The five principal research themes for NC are: plate tectonics and earthquake dynamics; fluid fluxes in the oceanic crust and gas hydrates in the accretionary margin; ocean–climate dynamics and impact on biotas; dynamics of deep-sea ecosystems; and engineering and computational research applications (Barnes et al. 2010).
5 NEPTUNE Canada has secured over $100M for the initial installation phase, mainly from the Canada Foundation for Innovation and the BC Knowledge Development Fund, and $17M in-kind support, primarily from industry. Several government departments, NSERC, and the Canadian Network for the Advancement of Research, Industry and Education (CANARIE) have provided other grants and contributions. The University of Victoria (UVic) leads a consortium of 12 Canadian universities, and is required both to own and operate the observatory. UVic also leads the coastal network, VENUS (www.venus.uvic.ca). It established Ocean Networks Canada (ONC) in 2007 as a wholly owned, not-for-profit agency to manage the NC and VENUS cabled networks as national facilities within the overall ONC observatory. ONC has secured an interim operating award ($24M, 2010–2012) and will apply for a five-year award under the newly announced Canadian Foundation for Innovation (CFI) Major Science Initiatives program. ONC also manages a commercialization and engagement unit (ONCCEE; www.onccee.ca).
6 VENUS is a coastal network in waters near Victoria and Vancouver, British Columbia. The first 4 km line was installed in early 2006 in Saanich Inlet, with the node at 100 m depth near the oxic–anoxic transition zone within the fjord. Installation of the second 40-km line, which has two nodes and extends from the Fraser Delta across much of the Strait of Georgia, was completed in 2008. The two networks investigate ocean and biological processes and delta dynamics in waters to 300 m depth. Real-time data and imagery have been successfully relayed from Saanich Inlet through the VENUS website for the last five years.
INFRASTRUCTURE AND ENGINEERING CHALLENGES
7 The first phase of the installation of the NC system started on August 23, 2007, when the 140 m Ile de Sein, one of the world’s most powerful cable ships, appeared off Port Alberni (Fig. 1). After bringing the cable end to shore and connecting it to the shore station purchased by UVic in 2006, the ship went on a 7-week cruise installing the 800 km cable ring, which constitutes the basis of a system that brings power and Internet to the seafloor. The second phase occurred during the summer of 2009 when Alcatel–Lucent Submarine Networks (the prime contractor) installed nodes at five sites identified during the preparation phase and designated as highest priority by the science community. Each 13-tonne node and trawl-resistant frame was especially designed to serve as a power and data hub: it steps down the 10 kV DC primary voltage on the backbone cable to 400 V DC and changes the communications protocol from IP over SONET (Internet Protocol over a Synchronous Optical Network) on the backbone cable to optical Gigabit Ethernet. Once the nodes were in location, the third phase, integration of scientific instruments with the system, was undertaken. That phase started in late summer 2009, continued with two cruises in 2010, and is poised to continue over the life of the 25-year design life observatory network as scientists propose new experiments and instruments to install on the system (Barnes et al. 2010; in press).
 Display large image of Figure 2
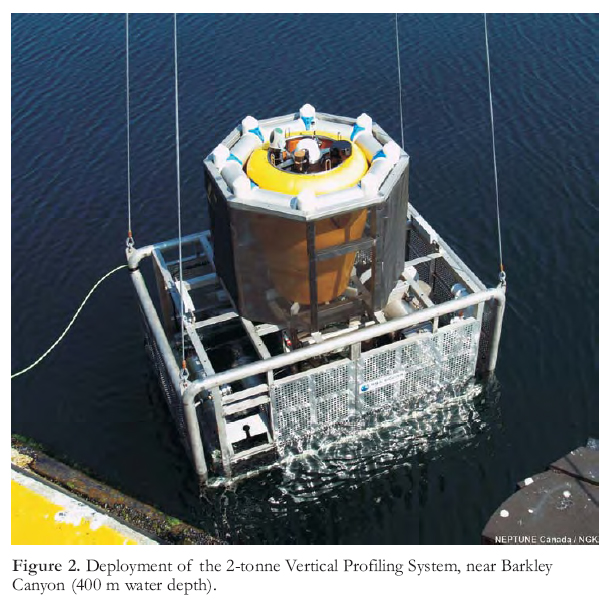
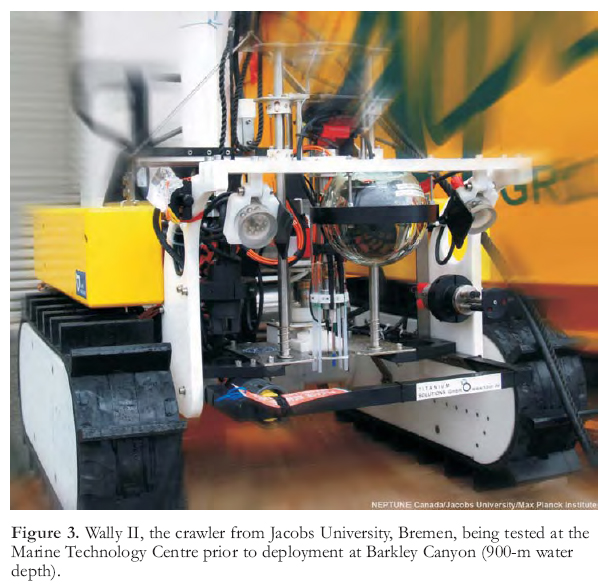
8 Technical challenges have been numerous during each phase but the third phase is the current focus of all attention. It includes not only an extraordinary diversity of sensors but also a large variety of cables, connectors and instrument platforms. Indeed, each node branches out to a series of Junction Boxes through hybrid power/fibre optic cables. The Junction Box acts as a secondary node, multiplying connection points and stepping the 400 V potential farther down to 12, 15 and 48 V. Up to 10 cables extend from each of these Junction Boxes. Electrical 100BaseT cables are used to connect sensors located in the vicinity; however, when the distance between the sensor and the Box is longer than 70 m, they are replaced by hybrid power/fibre optic cables, which require media converter cans on both end of the cable to convert the signal. The sensors themselves can be grouped on platforms such as the Vertical Profiler (Fig. 2), a winch-operated system whereby a float, instrumented with 12 sensors, travels through the 400 m water column, or Wally the Crawler, which operates on the gas hydrates (Fig. 3).
9 Such large platforms are commonly one of a kind and have been designed especially for the network. The crawler designed by Jacobs University, Bremen, has amply demonstrated the ability of a mobile platform to sample the seafloor and monitor methane venting and benthic biota. After a first deployment in 2009, a second generation crawler was installed on the seafloor in September 2010 (Fig. 3) and has been operating flawlessly ever since. However, the road to success in such a hostile environment can be significantly bumpier. The 400-m Vertical Profiler (Fig. 2), designed by NGK (Japan), will allow scientists to study the co-variation of physical and chemical parameters in a highly productive environment. It has already been deployed twice but has had to be recovered each time. The first failure was the result of a problem with the retractor motor, whereas the second was linked to a connector failure. However, before being retrieved, it performed several cycles up and down the water column, demonstrating its potential. The profiler is scheduled to be redeployed in spring 2011 after a series of tests in a nearby fjord inlet. This illustrates the difficulty of designing systems that can withstand the heightened pressure and corrosive environment.
 Display large image of Figure 3
10 Fortunately, prototypes are not the norm on the network. Many sensors are COTS (commercial off the shelf). However, the usage – long-term deployment using cables – is unique, meaning that the technical challenges faced here are no less daunting. During the September 2010 cruise, a major task was the deployment of several kilometres of extension cables to connect the Endeavour seafloor spreading ridge node to a series of Junction Boxes located in the axis of the ridge. Initially, the greatest concern was the treacherous terrain. Was there a route to lay a cable through an active part of the ridge? Incredibly, there was one, but a re-survey at low altitude for several hours was necessary to navigate a zone of steep cliffs and deep crevasses invisible on the initial survey. Unfortunately, that was not the most difficult part. We also had to overcome a failed cable, problems at depth with the cable drum, and even a partial power failure on the ship. It is only because of the quick thinking and creativity of all the people on-board, the ship’s team, the NC team, the Highland Technologies contractors and of course the ROPOS remotely-operated vehicle team, that the Main Endeavour and Regional Cabled Mooring North fields were finally connected along with their phenomenal suites of instruments. The loss of connection with the Main Endeavour Field one month later should not take away from that success. Armed with the experience acquired during the September 2010 Endeavour cruise, we are preparing to bring the Field back online on our next cruise. At the same time, we will inspect currently installed instruments and even install new equipment, expanding the potential of the network even further.
11 Summer 2011 will also be the opportunity to replace some instruments such as cameras and hydrophones that have given mixed satisfaction or have significantly corroded. A process has been engaged with the scientists to review how their needs might have evolved and inform them of the trade-offs we have to face. Through this operation, we want to clearly acknowledge that the real power of the observatory lies with the scientists. The more they become involved, the more relevant and the more efficient we will become in facilitating their research through improvements to the complex network.
SCIENTIFIC EXPERIMENTS
12 The world ocean is the dynamic engine of Earth, driving energy transport and elemental cycles of the globe. It is the integrator between what are (on average) the fast processes of the atmosphere and the slower processes of the earth’s crust. A key hurdle in coming to grips with understanding this earth–ocean–atmosphere system is the range of spatial and temporal scales at which processes occur, their complex interconnectedness, and in many cases, episodic catastrophic events.
Spatial Scope
13 In order to frame earth–ocean processes, it is necessary to capture information from the major regions and transition zones. The underlying bones of the earth, the tectonic structures, define much of the overlying regional distribution and pivot points. With this in mind, NC was designed to extend west from the continental North American plate across the entire Juan de Fuca plate as far as the Pacific plate. As a result, the observatory network spans both continental and oceanic crust, extending from the coast across the shelf, down the continental slope (including a submarine canyon), across the abyssal plain, to span the mid-ocean ridge (Fig. 1).
14 By spanning this range of tectonic settings, the observatory network also spans major zones of the ocean, including a range of photic to aphotic environments, and photosynthetic- to chemosynthetic-energy-based ecosystems (Barnes et al. 2010; in press). Energy sources include both sunlight and geothermal heat, which drive ocean currents, geochemical cycles, and primary production. Sources of nutrients range from terrestrial outflow, to coastal upwelling, to cold seeps and hydrothermal vents; transport of resultant primary productivity includes free fall, surface, mid-water and bottom currents (including currents in submarine canyons and ridge valleys), and tidal pumping. Benthic habitats include soft, firm and hard-bottom environments in all of the shelf, slope, abyssal plain, and mid-ocean ridge regions, including unusual settings such as hydrothermal vents, hydrate seeps with carbonate crusts, a submarine canyon, nepheloid layers, and a wave-washed rocky pinnacle. Scales of life range across microbial, meiofaunal, mesofaunal, macrofaunal, and megafaunal; modes of life include planktonic, pelagic, nektic, benthic (motile and sessile), epifaunal, semi-infaunal, and infaunal. Of key importance is that, with continuous observations, it is possible to quantify the inherent temporal patchiness of biological occurrences.
Temporal Scope
15 Processes within the earth–ocean system vary on scales of microseconds to millennia. Rapid processes require high-frequency sampling often not practical on autonomous battery-powered instruments. Assembly of more than one data stream into variable space also requires time-coordination. The interpretation of longer term processes often requires an adequate assessment of the short-term processes so that the latter signal can be removed. For example, climate trends are hard to discern if you do not have adequate sampling of the annual variability and can show that the trend is more than a random sampling of seasonal or annual variation. Similarly, analysis of ocean waves on various scales needs to proceed from ‘de-tided’ data. Therefore, continuous data at high sampling frequencies provide the opportunity for backing-out trends at various scales (annual, multi-year, decadal).
 Display large image of Figure 4
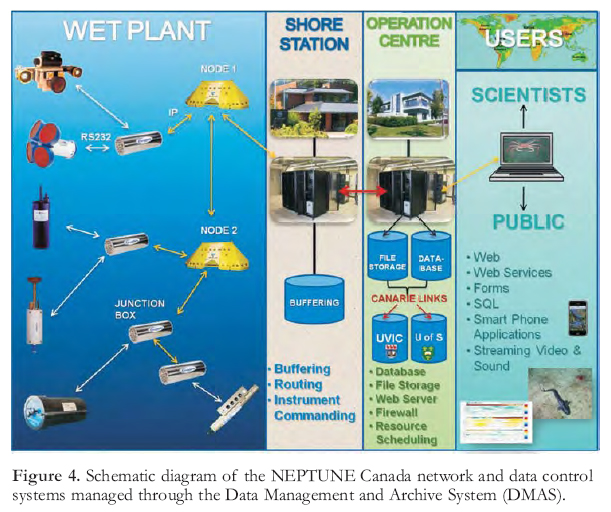
Catastrophic Episodicity
16 Many processes are also highly episodic, and these combined with rapid events at long intervals make it difficult to plan sampling expeditions to capture the events. If the rapid processes are heterogeneously distributed through time (episodic), for example earthquakes, then continuous high-frequency time-coordinated sampling is required to capture the event at all. The solution is to have remote-sensing capability in place all the time, waiting for the events to occur.
Complex Interconnectedness
17 Perhaps even more powerful than the environmental and temporal scope above, however, is the real-time, coincident, co-ordinated sampling of hundreds of data streams across disciplines and the interactive remote control of instruments (Fig. 4). This allows responsive real-time sampling of events, and analysis of relationships among the disparate data to test relationships and drivers across the earth–ocean system.
18 This requires the high resolution coincident sampling, as well as extensive documentation of, and access to, metadata to allow the scientific community the ability to judge the appropriateness of various data combinations for analysis. This not only benefits from, but requires an open data e-science approach to encourage development of research initiatives across disciplinary lines, and across international experience. A sense of the breadth of the scientific involvement is outlined below.
Scientific Development
19 Members of the NC scientific community come in a number of forms, which we describe as Builders, Future Builders, Bridge Builders, Data Analysts, and Knowledge Beneficiaries.
 Display large image of Table 1
Builders
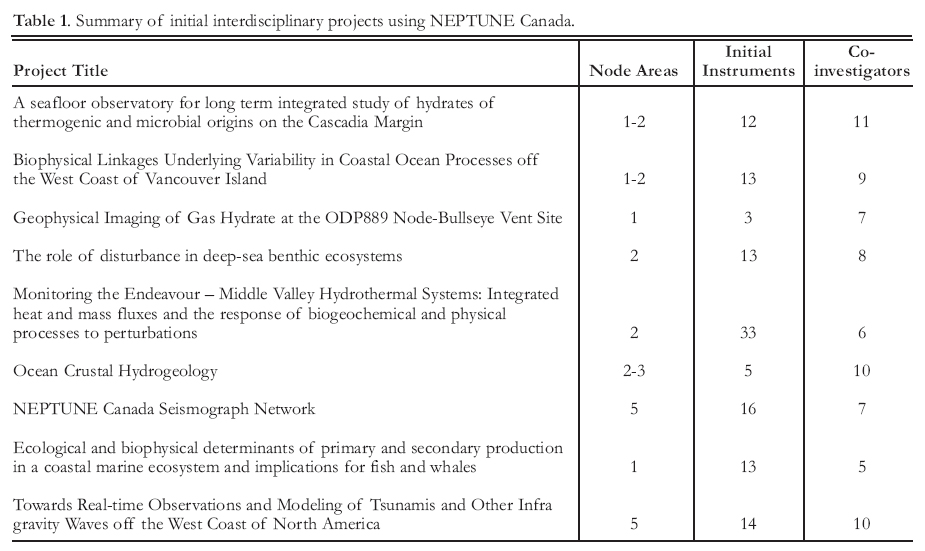
20 Approximately 250 scientists from Canada and internationally were participants in a series of NC workshops in 2004, and were fundamental designers of the system. Out of this process, 9 multidisciplinary science teams were funded in 2005. These projects are listed in Table 1, and further information is available at http://www.neptunecanada.ca/research/research-projects/
21 The science teams consist of ~80 scientists, technicians, and students that have been intimately involved in defining and developing NC over the past 5 or more years, from 16 institutions in Canada, US, and Europe. Their contribution first and foremost is conceptual, but extends to the very hands-on technical tasks involved in operating this complex system, including its configuration and commissioning.
Future Builders
22 The observatory is expandable at every scale, with a large capacity available for new instruments that users can support through international science bodies, instrument manufacturer testing, and private sector testing/data collection. Details on participating in NC are available through the website at http://www.neptunecanada.ca/research/research-opportunities/.
Bridge Builders
23 Cross-calibration of observing methods started with the definition of our node locations, which was based on areas that had been identified as key pivot points during decades of previous ship-based research. In turn, NC is now starting to provide the temporal resolution never before available across a breadth of variables to help in the (temporal) ground-truthing of archived data. This cross-calibration and development of models is applicable not only to the Northeast Pacific, but also for any processes that sensibly have broader impact.
Data Analysts
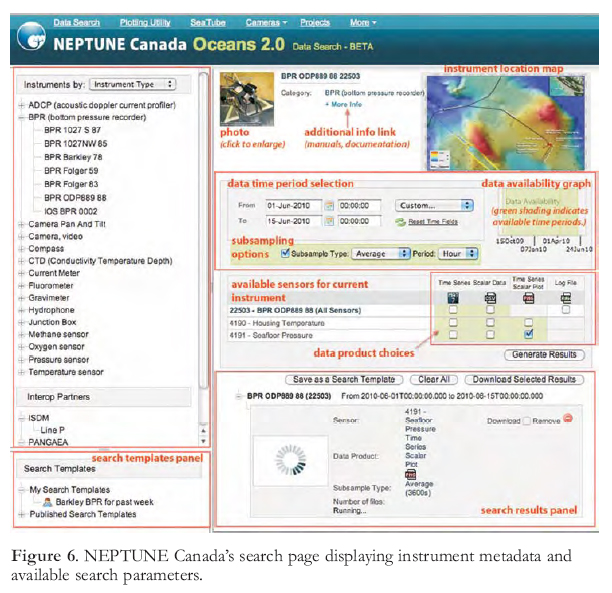
24 NC has a revolutionary data policy: data are freely and openly available real-time, to anyone who registers for a user account (www.neptunecanada.ca/research/research-opportunities; see the search interface in Figs. 5 and 6). This data policy arose out of Canadian and US workshops in the early part of the decade, when it was recognized that collection of data was a key part of the scientific endeavour, that there should be credit for this activity, and that, in turn, the data should be available as openly and quickly as possible. A key development in which NC expects to be a catalyst is Ocean Informatics: multivariate, interdisciplinary analysis of coordinated earth–ocean data, including biological, chemical, physical, and geological parameters.
Knowledge Beneficiaries
25 Knowledge beneficiaries include those in the fields of education, policy, public, and media. Our realm of social computing brings the virtual observatory not only to the scientific community, but to all segments of society, using approaches such as crowd-sourcing to enable not only passive but active involvement in the scientific endeavour by the community at large.
 Display large image of Figure 6
Scientific Initiatives
26 Most of the initial proof-of-concept experiments were installed at 4 of the 5 network nodes during the summer of 2009 (Barnes et al. 2010; in press). At inshore Folger Passage (Barkley Sound, west Vancouver Island), controls on biological productivity are used to evaluate the effects of marine processes on invertebrates, fish and marine mammals. Experiments around Barkley Canyon quantify changes in biological and chemical activity associated with nutrients and cross-shelf sediment transport at the shelf/slope break and through the canyon. Along the mid-continental slope, exposed and shallowly buried hydrates allow monitoring of changes in their distribution, structure, venting, and their responses to earthquakes, slope failures and plate motions. Circulation Obviation Retrofit Kits (CORKs) at mid-plate ODP 1026–7 boreholes will be monitoring real-time changes in crustal temperature and pressure, in response to earthquakes, hydrothermal convection or plate strain. At Endeavour Ridge (instruments installed September 2010), complex interactions among volcanic, tectonic, hydrothermal and biological processes will be quantified at the western edge of the Juan de Fuca plate. Across the network, high resolution seismic information elucidates tectonic processes and earthquakes, and a tsunami system determines open-ocean tsunami amplitude, propagation direction, and speed.
27 Recent research progress was profiled in our December 2010 newsletter (available on the website), and includes reports from across the earth–ocean sciences on how the early data are influencing our understanding. Listening to the Deep by Michel André, of the Technical University of Catalonia, Spain, describes his lab’s work on marine sound and its impact on marine fauna. They have integrated the live-streaming hydrophone data from NC into their analytical system, and provide for the first time in the field of passive acoustic monitoring, not only the live audio data streams but also the output of the statistical analysis (noise measurements, acoustic presence and distribution of species over time) online for public access at http://listentothedeep.com.
28 Quantifying Deep Sea Sediment Surface Bioturbation by Katleen Robert (advised by Kim Juniper) of the University of Victoria, uses real-time cameras to monitor sediment surface mixing (bioturbation) by deep-sea benthic organisms such as flatfish, echinoderms or gastropods. These behaviours result in physical and chemical alterations of the sediment properties, providing important ecological functions and services such as decomposition of organic matter, pollutant burial and nutrient interchange. Ms. Robert is working on providing an estimate of the time required for animals to fully turn over the surface area within the camera’s field of view, which, amazingly, appears to be more on the order of months rather than years.
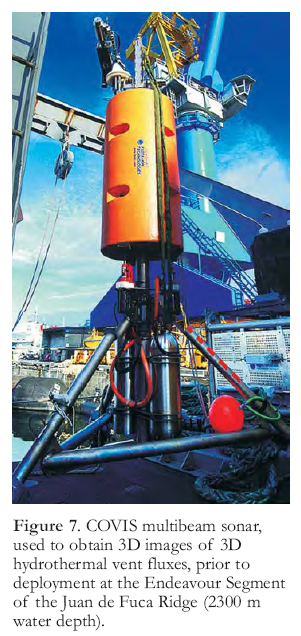
29 Cabled Observatory Vent Imaging Sonar (COVIS), by Peter Rona, Russ Light, Karen Bemis and the COVIS team (Rutgers University and Applied Physics Lab, University of Washington) is designed to acoustically image, quantify and monitor seafloor hydrothermal flow on timescales of hours (response to ocean tides), weeks, months, or years (response to volcanic and tectonic events), to advance understanding of these interrelated processes. From a fixed position, COVIS (Fig. 7) measures the following:
- Volume backscatter intensity from suspended particulate matter and temperature fluctuations in black smoker plumes, which is used to reconstruct the size and shape of the buoyant portion of a plume;
- Doppler phase shift, which is used to obtain the flow-rise velocity at various levels in a buoyant plume; and
- Scintillation, which is used to image the area of diffuse flow seeping from the seafloor.
30 COVIS began acoustic imaging of hydrothermal flow at the Grotto Vent cluster in the Main Endeavour Field, joining the NC seafloor cabled observatory on 29 September 2010, but after a month of operation was affected by the connectivity failure noted earlier.
DATA MANAGEMENT AND ARCHIVE SYSTEM
31 A Data Management and Archiving System (DMAS) has been developed to serve the needs of the VENUS and NC networks (Pirenne in press). The mandates of the system are manifold: data acquisition, real-time monitoring of the underwater infrastructure, real-time control of interactive instrumentation, data archiving, and data search and distribution (Figs. 4, 5 and 6). DMAS implements these high-level requirements by considering the observing system as an extension of the Internet to the seabed. It is a significant software system that has evolved over the past six years to encompass the most modern software technologies of the day, such as Web Services, Web 2.0, etc. It is implemented as a distributed, service-oriented architecture. It is scalable and can support very small, occasionally connected observing systems, as well as large, multi-site networks of high-bandwidth sensors. Data security is a core design feature of the system, tailored to minimize data loss related to hardware, software or external causes.
 Display large image of Figure 7
Archiving and Storage Challenges over 25 Years
32 One of the challenges of a data management system for undersea observing systems is that of data archiving. NC and VENUS measure diverse phenomena and involve many different time scales, from sub-second to decades, or up to 14 orders of magnitude. This translates to data collected at up to 105 Hz (e.g. hydrophones) for very long periods of time.
33 Clearly, one of the issues is that of the ensuing data volume and of the necessary storage capacity required to keep it not only safe, but also readily available to search and retrieval tools. This issue, given the current instrumentation, does not represent a major challenge, as with reasonable financial means, storage capacity to support roughly 50 Tb of data per year is quite affordable compared to the other costs involved in operating the network.
34 A more serious issue however, is that of the technological context: storing data for the lifetime of the observing system and beyond is a function that will face technology obsolescence several times during the planned 25 years of its existence. This challenge is typically addressed by implementing technology ‘refresh’ operations every four to five years; new equipment is then purchased and configured, and data are migrated from the old system onto the new one. This activity clearly requires a significant financial investment in hardware (considering that all previously stored data has to be moved) and in people to oversee the purchase, installation and data migration.
35 Data security is clearly essential, both in terms of protecting against natural as well as man-made hazards. Protection of data against lightning, fire, and earthquakes is achieved by having at least two copies in geographically distinct locations. The distance between the locations has to be commensurate with the type of danger the data have to be protected from. In this instance, for NC and VENUS, one copy of the data resides in Victoria, BC, while the other copy is stored in Saskatoon, SK, 1500 km away.
36 Protection against malevolent acts or human errors is achieved by restricting access to the core infrastructure, both physically as well as virtually. To that effect, shore stations and data centres are secure locations and the network on which the entire system resides is fully protected by the usual array of firewalls and other computer security measures in use in large organizations.
Observatory Control Systems
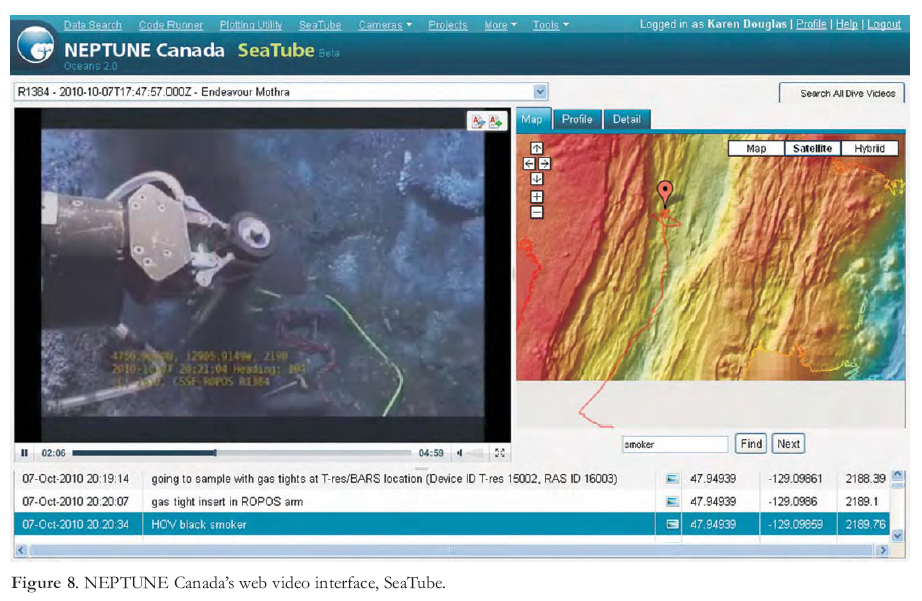
37 From a logical and operational perspective, an underwater sensor network consists of a power system and a communication system (Fig. 4). Both have to be continuously controlled and monitored. On the power side, multiple parameters at many different points have to be measured, collected and compared to acceptable values; current, voltage and resistance to ground are a few of the over 1300 variables that are collected and processed every second. Any value going astray from its pre-determined range will raise alarms and alert duty operators. On the communication side, as the observatory is an underwater extension of the Internet (Fig. 8), standard Internet Protocol (IP) network management tools are used. Alert-based systems are implemented to inform operators of any communication failure occurring on the system.
38 Many different subsystems have to be managed in this way and all have an array of software tools that allow for effective remote management of the entire infrastructure, both underwater and on land. DMAS provides some of them.
Advanced User Tools
39 The underwater network would not be very useful if it did not contain the necessary user tools to allow for data access (for archived as well as real-time data), remote instrument control and the like.
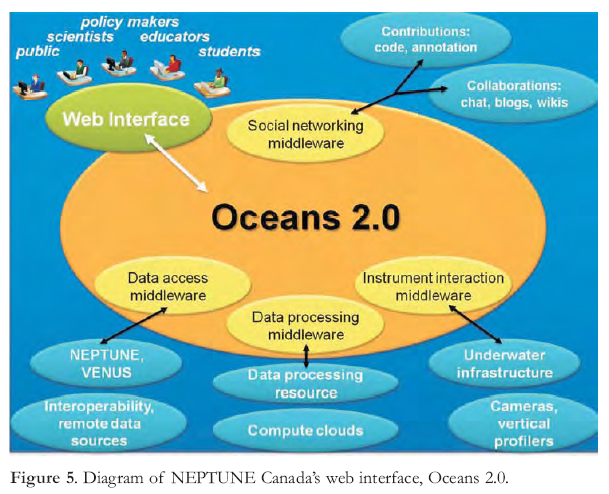
40 One of the key achievements of DMAS has been in the area of user interaction – providing the tools to help users deal with an exponentially growing dataset. Advanced, web-based data search and visualization tools, data quick-look features, shared remote instrument access, remote data processing ‘on the cloud’ (a ‘cloud-based’, or out-sourced computing paradigm) are some of the features that are part of the Oceans 2.0 environment in DMAS (Figs. 5 and 6). Oceans 2.0 represents the adaptation of some of the Web 2.0 concepts of contribution and collaboration, two important characteristics of social media now adapted for use in modern science. The concept of contribution allows users to share their findings on the data (e.g. through annotation) or share resources that they have developed to work with the data (e.g. computer code). Collaboration allows people to form teams or to work on-line together, either at the same time or asynchronously.
FUTURE DEVELOPMENTS AND OPPORTUNITIES
41 NEPTUNE Canada will transform our understanding of biological, chemical, physical, and geological processes across an entire tectonic plate from the shelf to the deep sea. Real-time continuous monitoring allows scientists to capture the variation and episodic nature of these natural processes in a way never before possible. This in turn will permit an understanding of the complex relationships among these processes, whether earthquakes, sedimentation, fish stocks, or marine response to climate change. Opportunities abound for:
- extending and expanding the network and instrument arrays;
- international partnerships with other emerging cabled observatories;
- commercial innovation and demonstration;
- educational and outreach programming;
- collaboration with the Ocean Tracking Network project led by Dalhousie University; and
- nurturing applications/technologies designed for monitoring pollution, port security, linking off-shore oil fields, renewable resource management, and using the long time-series of data essential to improve public policy formulation.
41 Several new instruments from international scientists will be added during 2011 and 2012, and other scientists are currently seeking funding from the US National Science Foundation. There will also be an opportunity for an application of major new funding to expand the NC network through the next CFI Leading Edge Fund competition in 2012–13, which was announced in late 2010. NC invites researchers, educators, institutions, international partners, and industry to consider participating in the observatory network (neptune@uvic.ca; www.neptunecanada.ca).
We acknowledge the financial support provided for the installation and initial operations phases primarily from the Canada Foundation for Innovation and the British Columbia Knowledge Development Fund. The Natural Sciences and Engineering Council of Canada, CFI and the BC Ministry of Advanced Education, together with support for specific aspects from CANARIE and the University of Victoria, have provided funding toward the operating phase. In-kind support and other grant awards have come from many other partners and contractors. The University of Victoria at all levels has been and remains committed to the project in a myriad of ways and for which the project team and its partners are deeply appreciative. Karen Douglas kindly assisted in the design and provision of the illustrations.