Series
Geoscience of Climate and Energy 8.
Climate Models: Are They Compatible with Geological Constraints on Earth System Processes?
W. Richard PeltierDepartment of Physics, University of Toronto, Toronto, ON, Canada M5S 1A7
peltier@atmosp.physics.utoronto.ca
Received April 2010, Accepted as revised September 2010
SUMMARY
Models of the global warming process are obliged to include many important small-scale processes that cannot be explicitly represented, given the low spatial and temporal resolution at which the models can be integrated. As the parameterizations of these processes, in terms of the resolved scale fields, must be tuned to permit them to enable the models to fit climate observations from the instrumental era, it is an issue as to whether such models remain robust when they are applied to the prediction of future warming trends. Geological inferences of past climate conditions provide a means by which the robustness of the models may be assessed. In this paper, two examples of such tests are described, both of which demonstrate that a state-of-the-art model is able to accurately simulate past conditions that differ radically from modern.SOMMAIRE
Les modèles de processus de réchauffement climatique de la planète doivent intégrer de nombreux et importants processus à petite échelle, lesquels ne peuvent être représentés de façon explicite, étant donné la faible résolution spatiale et temporelle des modèles climatiques. Comme le paramétrage de ces processus, à leur échelle propre, doit être ajusté de manière à permettre aux modèles de correspondre à l'observation du climat de l'aire instrumentale, il faut savoir si de tels modèles peuvent demeurer robustes lorsqu’ils sont utilisés pour prévoir les tendances de réchauffement à venir. Or, les inférences climatiques passées déduites de situations géologiques constituent un moyen de tester la robustesse des modèles. Dans le présent article, deux exemples de ces tests sont décrits, et ceux-ci montrent que les modèles actuels sont capables de reproduire avec précision des conditions climatiques anciennes très différentes des conditions actuelles.INTRODUCTION
1 In the ongoing effort to understand the nature and impacts of the greenhouse gas-induced global environmental changes now taking place, the role of climate models, and of Earth System models in general, is clear. Future climate states may be predicted only through application of a detailed mathematical model that incorporates all of the important system sub-components. For these predictions to be meaningful, however, the model must first be subjected to significant tests designed to establish its credibility. A first such test involves the demonstration that the model ‘fits’ the observed characteristics of modern climate when ‘forced’ by modern inputs (solar irradiance, atmospheric greenhouse gas concentrations, surface topography, surface albedo, etc.). It may be assumed that most modern models pass this test satisfactorily, although significant regional biases continue to exist.
2 However, this test, even if fully successful, is not definitive. The problem is that all such models involve schemes designed to ‘parameterize’ the influence of processes that are not explicitly resolved by the finite resolution of space and time required to enable the numerical model to be efficiently integrated, given the constraints imposed by finite computational resources (e.g. the representation of cumulus convection in the atmosphere and turbulent mixing processes in the oceans). Parameters of the model must therefore be ‘tuned’ to enable it to reconcile modern observations. There is no guarantee that when subjected to different forcing, due, say, to differing greenhouse gas concentrations, the model so tuned will respond correctly. More severe tests of the models we employ to make predictions are therefore required. It is at this point that data from a variety of different geological archives has come to play an increasingly important role. This is clearly evident in the Fourth Assessment Report (AR4) of the Inter-governmental Panel on Climate Change (IPCC 2007), in which an entire chapter was devoted to the subject of paleoclimate, and the impact that geological evidence of climate system variability has had on model validation.
3 The purpose of this paper is to illustrate the synergies that have developed as a consequence of the ‘prediction’ and ‘postdiction’ approaches to climate change analyses having become so strongly intertwined. The discussion will focus specifically upon the extent to which changes in thermohaline circulation strength have contributed to climate changes of the past, and the extent to which a leading global climate model is able to reconcile the relevant geological constraints.
THE MODEL
4 For the purpose of this discussion the focus will be on results obtained using the National Center for Atmospheric Research (NCAR) coupled atmosphere–ocean–sea-ice–land surface processes model. My comments will be based upon work conducted with the NCAR Climate System Model, specifically the v1.4 edition of this model (Climate System Model 1.4, Boville and Gent 1998), which incorporates improved tropical dynamics (Otto-Bliesner and Brady 2001). The atmospheric component of the model is Community Climate Model 3.6 (T31L18) with an equivalent grid spacing of 3.75° x 3.75° and 18 vertical levels. The land surface model, LSM1, has specified vegetation types and a comprehensive treatment of surface processes (Boville et al. 2001). The ocean model is the NCAR Ocean Model 1.4, which has 25 vertical levels, 3.6° longitudinal grid spacing, and a latitudinal spacing of 1.8° poleward of 30° latitude, decreasing smoothly to 0.9° within 10° of the equator (Gent et al. 1998). The sea-ice model (Weather-ly et al. 1998) includes ice thermodynamics based upon a three-layer model (Semtner 1976), and ice dynamics based on the assumption of a cavitating fluid rheology (Flato and Hibler 1992).
5 In global warming mode, this model has a ‘climate sensitivity’ of approximately 3°C of mean surface temperature increase (at equilibrium) in response to a doubling of the atmospheric CO2 concentration. This is within the range of sensitivities believed to be characteristic of the actual Earth System. When compared to modern climate observations, the model is among the very best available, although the follow-on model Community Climate System Model (CCSM) 3.0 has also been a heavily exercised version of the NCAR structure, one that has itself just been replaced by CCSM 4.0.
GEOLOGICAL TESTS
6 In terms of tests that may be performed to confirm the accuracy of the model under forcing conditions radically different from modern, those that involve the strength of the Atlantic Meridional Overturning Circulation (MOC) are among the most interesting and demanding. This important climatic ‘flywheel’ has an intrinsic timescale of centuries to a millennium, as opposed to the much shorter timescales that govern the internal variability of the atmosphere. I will describe two tests, one that focuses upon the properties of an equilibrium state of the system and another that involves the time-dependent reaction to a transient stimulus.
THE CLIMATE OF THE LAST GLACIAL MAXIMUM: EQUILIBRIUM STRENGTH OF THE THC
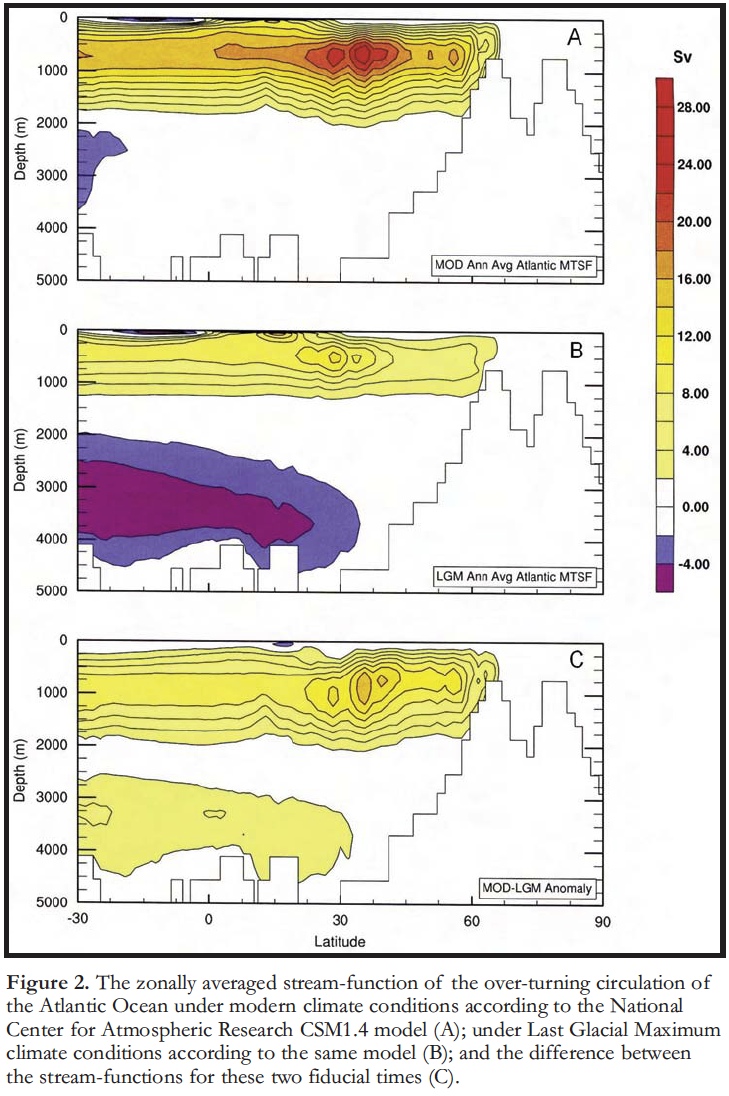
7 At last glacial maximum (LGM), the quasi-steady properties of the forcing to which the climate system was subject, involved significant changes to both surface topography and albedo, in consequence of the massive accumulations of land ice that covered the northern hemisphere continents at that time (Fig. 1). One additional consequence of continental glaciation was a eustatic depression of sea level of approximately 120 m. The most recent reconstruction of surface properties is that embodied in the ICE-5G (VM2) model of Peltier (2004), a model that has recently been validated in detail by the Gravity Recovery and Climate Experiment satellite observations of the time-dependent gravitational field of the planet (e.g. Peltier and Drummond 2008; Peltier 2009; Peltier and Luthcke 2009). Also at LGM, the radiatively-active trace-gas concentrations of CO2, CH4 and N20 were significantly different from modern levels, but are known on the basis of measurements on air bubbles trapped in the ice-cores drilled at several sites in Antarctica, including those at the Vostok and EPICA sites. At nominal LGM of 21 ka, there also existed a modest change in the orbital insolation regime. When all of these properties of the LGM system are so specified, the CSM 1.4 model delivers statistical equilibrium results for the Atlantic MOC (Peltier and Solheim 2004; Fig. 2).
Figure 1. A schematic depiction of surface conditions in the northern hemisphere, at Last Glacial Maximum (LGM), approximately 21 000 years BP. Land-ice location and thickness is depicted on a colour bar grading from light to darker mauve/purple. The greatest thickness of land-ice at LGM occurred just to the west of Hudson Bay over the Keewatin sector of the Canadian Shield, where ice thickness was in excess of 4 km. The variation of sea-ice cover at LGM is depicted as white for the distribution in the summer season, and as a grey extension for the distribution during winter. The distribution of the annually averaged sea surface temperature is illustrated on a colour scale that grades from warm (red-orange) in the tropics to cold (blue-green) in more northern latitudes.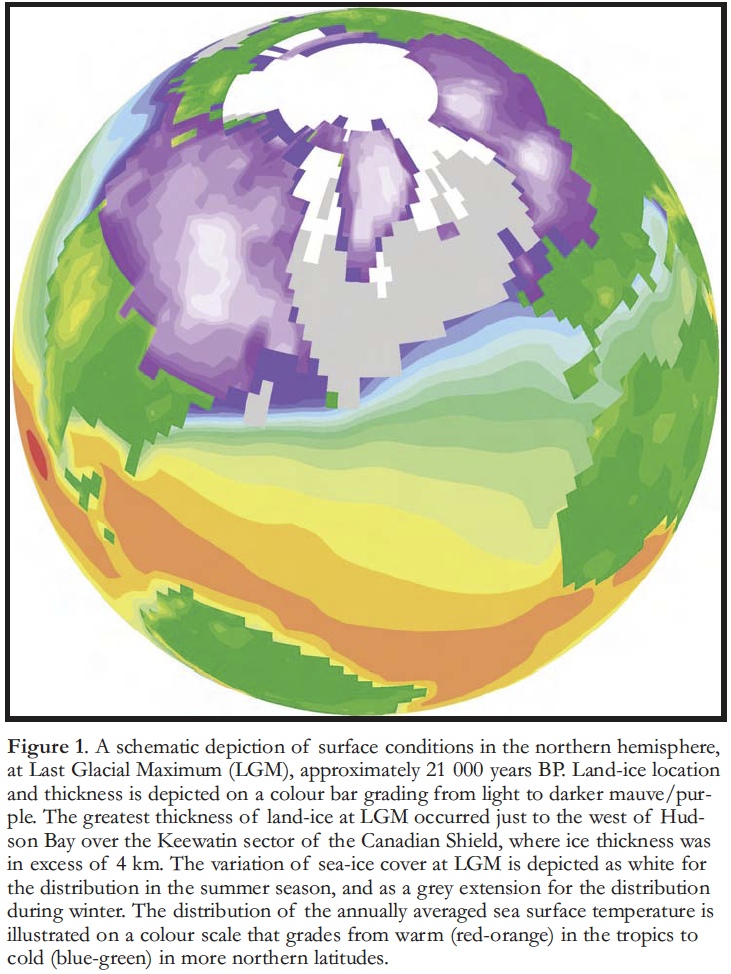
Display large image of Figure 1
Display large image of Figure 2
8 Figure 2 compares the modern and LGM structures of the MOC in terms of contours of the overturning stream function below the surface mixed layer. Under modern conditions, the maximum strength of the MOC is approximately 22 Sverdrups (Sv) in this model (ocean currents are measured in Sverdrups, where 1 Sv = 106 m3/s). At LGM, the maximum strength is reduced to approximately 14 Sv, a reduction of about 35%. The Peltier and Solheim (2004) prediction of the reduction in the LGM strength of the MOC, is in close accord with an appropriate geological proxy for the strength of the MOC at LGM, relative to its strength under modern conditions (McManus et al. 2004). The proxy employed by McManus et al. (2004) was the ratio of the concentration of protactinium (Pa) to thorium (Th) in a sedimentary core (recovered near Bermuda) that was well-placed to measure the impact of changes in the strength of the western boundary undercurrent – the return flow to the south produced by deep-water formation in the Greenland, Icelandic and Norwegian seas, as well as the Labrador Sea. This isotopic tracer is able to provide a measure of changes in the strength of the MOC because these two daughter products of the decay of uranium are differentially scavenged on particles, with thorium being most rapidly removed from the water column by this mechanism. Changes in the southward-flowing speed of the undercurrent therefore impact the Th/Pa ratio, which can be measured as a function of time in a deep-sea sedimentary core for which accurate age-control has been established. Knowing the strength of the modern Atlantic THC, the isotopic ratio time series can be calibrated and the LGM strength of the MOC inferred. The McManus et al. (2004) inference and the Peltier and Solheim (2004) reconstruction agree.
THE YOUNGER DRYAS COLD REVERSAL: TRANSIENT ADJUSTMENT OF THC STRENGTH
9 The Younger Dryas cold reversal that began at approximately 12.8 ka interrupted the transition into the warmer Holocene that began subsequent to LGM. This event lasted approximately 1000 years, ending at approximately 11 500 years BP with the transition into the pre-Boreal interval. The most compelling explanation of this event is that by Broecker et al. (1989), who suggested that it was caused by a shift in the direction of freshwater run-off from the collapsing Laurentide ice sheet, whereby the freshening of the surface of the Atlantic over the North Atlantic Deep Water formation sites would lead to a sharp diminution of the strength of the MOC. Prior to the onset of the Younger Dryas, freshwater from the southern flank of the Laurentide ice sheet exited the surface of the continent southward into the Gulf of Mexico through the Mississippi river outlet. At the onset of the Younger Dryas, Broecker et al. (1989) hypothesized that the outflow direction shifted to the east through the St. Lawrence River because of a shift in the drainage of glacial Lake Agassiz. More recently, as a consequence of a failure to discover evidence for the spillway through which the runoff would have entered the western terminus of present day Lake Superior, Lowell et al. (2005) questioned the validity of this interpretation. Their conclusion, that the eastern route for a freshwater surge onto the surface of the Atlantic Ocean was not supported by evidence on the landscape, had been reached earlier: analysis of oxygen isotopic data from sedimentary cores at the mouth of the St. Lawrence River had failed to reveal any evidence for the freshwater anomaly that the hypothesized switch in out-flow direction required (de Vernal et al. 1996). In an effort to discover an alternate avenue for freshwater routing during the disintegration of the Laurentide ice sheet, Tarasov and Peltier (2005) performed a direct calculation of freshwater runoff, which suggested that subsequent to the abandonment of the southward-directed spillways, freshwater routing shifted to a northern route into the Arctic Ocean through the McKenzie River onto the surface of the Beaufort Sea. A significant question that immediately arises is whether a freshwater outflow into the Arctic Ocean would have the same impact on the strength of the Atlantic MOC as would a direct outflow into the Atlantic.
10 This issue has been addressed by Peltier et al. (2006) using the same model employed to investigate the equilibrium strength of the MOC at LGM. Figure 3 sketches the design of numerical experiments that have been performed in an attempt to re-establish the viability of the Broecker et al. (1989) freshwater runoff-based explanation of the Younger Dryas. The working hypothesis of Peltier et al. (2006) was that the addition of freshwater to the surface of the Atlantic reduced the rate of North Atlantic Deep Water formation, leading to the dramatic Younger Dryas cooling of the northern hemisphere recorded in a variety of surface temperature proxies (see also Peltier (2007) for comments on a paper by Knies et al. (2007) that supported the possible importance of the Arctic Ocean as a major player in the routing of freshwater anomalies into the Greenland, Icelandic, and Norwegian seas).
Figure 3. Locations of application of the surface freshwater forcing for both the Atlantic and Arctic regions.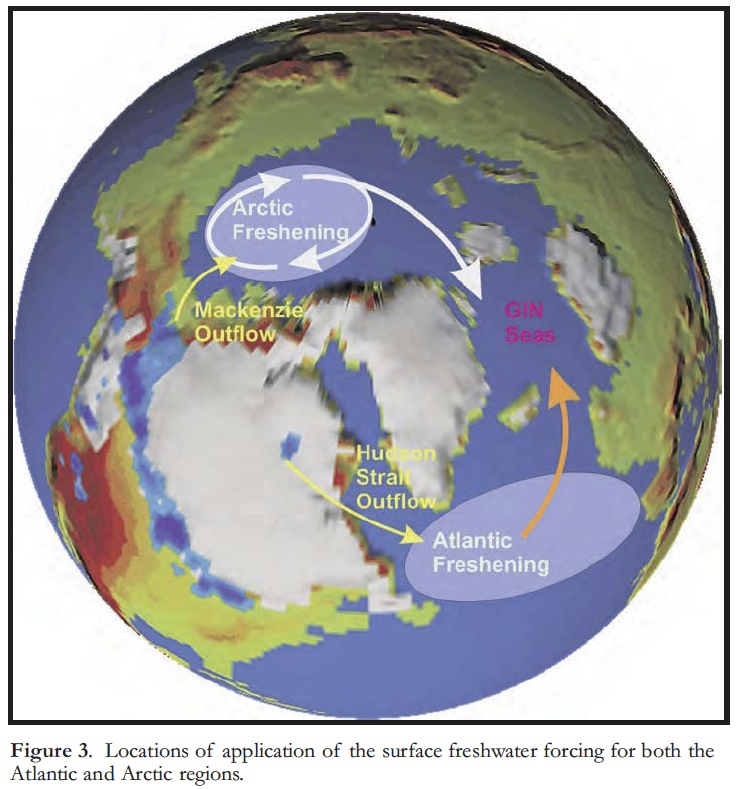
Display large image of Figure 3
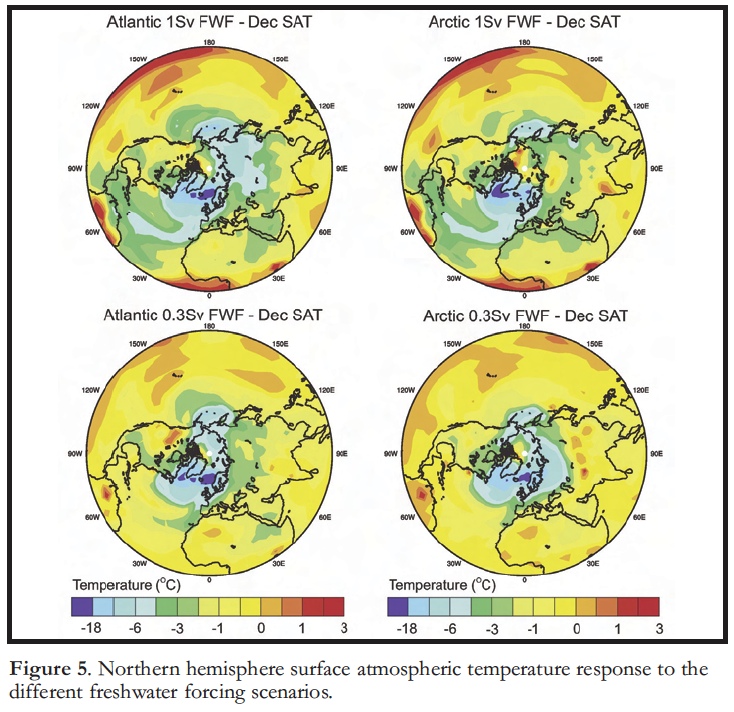
11 Figure 4 illustrates the response of the MOC to the freshening of the surface of either the Arctic or the Atlantic oceans for different rates of freshwater addition applied for a period of 100 years (0.3 Sv and 1.0 Sv). Also shown are the responses of sea-ice extent and surface air temperature at Summit, Greenland, for both the Arctic and Atlantic scenarios. The results indicate that the modelled surface air-temperature depression at Summit compares closely to that inferred by Grachev and Severinghaus (2005) based on the analysis of gas isotopic data (a surface air-temperature proxy) from the Greenland GISP2 ice-core; the model delivers an excellent fit to the surface air temperature proxy for either of the two rates of freshwater forcing and for either choice of the geographical region on which the freshwater forcing is applied. The Broecker et al. (1989) scenario for the Younger Dryas is therefore compatible with the geological observations in either case. Figure 5 compares the hemispheric impacts on December surface air temperature for the two freshwater forcings and for the two different areas of geographical application. Aside from slight differences in geographical expression of the hemispheric cooling caused by the freshwater-induced decrease in the strength of the MOC, the idea that the Younger Dryas was caused by such an effect is strongly reinforced by the comparison between geological inference and model prediction.
Figure 4. Response of the strength of the Atlantic MOC to freshwater forcing applied to either the Arctic Ocean over the Beaufort Gyre or to the Atlantic Ocean between 50° and 70° north latitude. Results are shown for ‘hosing experiments’ of 100 years duration for forcing strengths of 0.3 Sv and 1.0 Sv. Also shown are time series for the response of sea-ice area to the applied freshwater forcing as well as time series for the temperature perturbation predicted to occur at the site of the Summit, Greenland GISP2 ice-core.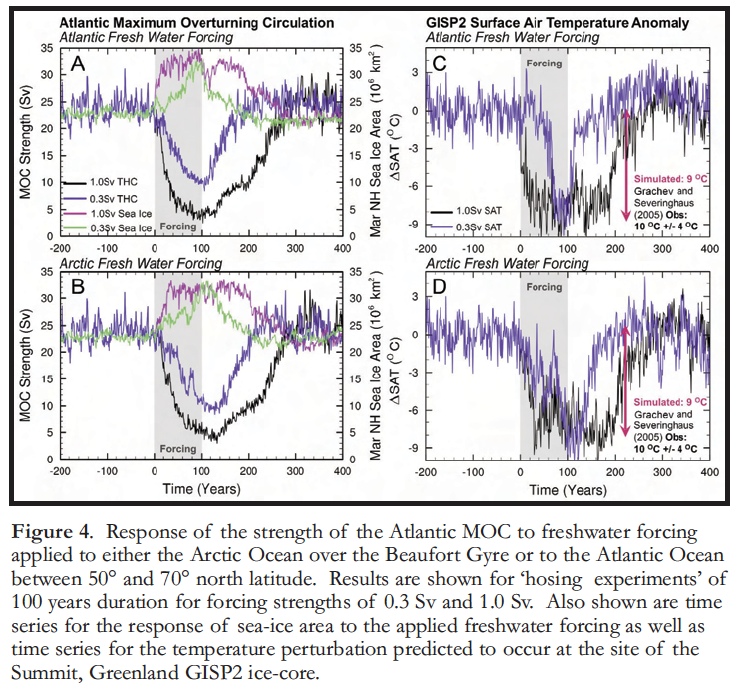
Display large image of Figure 4
Display large image of Figure 5
12 Until recently, the absence of evidence for the timing of freshwater outflow into the Beaufort Sea through the McKenzie River outlet was widely assumed to undermine the plausibility of this hypothesis (e.g. Broecker et al. 2010). However, detailed application of optically stimulated luminescence dating of material from sedimentary sections in the McKenzie Delta (Murton et al. 2010) has now provided unequivocal evidence for an intense freshwater outflow that apparently continued for the millennium-long duration of the Younger Dryas. The Tarasov and Peltier (2005) hypothesis must now be considered verified.
CONCLUSIONS
13 The few results illustrated in this paper are intended as examples of an enterprise that is being pursued very energetically within the climate dynamics community. We employ geological inferences of past climates to challenge the capabilities of the models employed to predict the degree of warming to be expected as a consequence of increasing atmospheric concentrations of the greenhouse gases. Such comparisons provide a very useful means of ensuring that these models have significant application outside the modern era to which their parameterizations have been tuned.
REFERENCES
Boville, B.A., and Gent, 1998, The NCAR Climate System Model, Version One: Journal of Climate, v. 11, p. 1115-1130.
Boville, B.A., Kiehl, J.T., Rasch, P.J., and Bryan, F.O., 2001, Improvements to the NCAR CSM-1 for transient climate simulations: Journal of Climate, v. 14, p. 164-179.
Broecker, W.S., Kennett, J.P., Flower, B.P., Teller, J.T., Trumbore, S., Bonani, G., and Wolfli, W., 1989, Routing of melt-water from the Laurentide Ice Sheet during the Younger Dryas cold episode: Nature, v. 341, p. 318-321.
Broecker, W.S., Denton, G.H., Edwards, L.R., Cheng, H., Alley, R.B., and Putnam, A.E., 2010, Putting the Younger Dryas cold event into context: Quaternary Science Reviews, v. 29, p. 1078-1081.
de Vernal, A., Hilaire-Marcel, C., and Bilodeau, G., 1996, Reduced meltwater outflow from the Laurentide ice margin during the Younger Dryas: Nature, v. 381, p. 774-777.
Flato, G.M., and Hibler III, W.D., 1992, Modeling pack ice as a cavitating fluid: Journal of Physical Oceanography, v. 22, p. 626-651.
Gent, P.R., Bryan, F.O., Danabasoglu, G., Doney, S.C., Holland, W.R., Large, W.G., and McWilliams, J.C., 1998, The NCAR Climate System Model global ocean component: Journal of Climate, v. 11, p. 1287-1306.
Grachev, A.M., and Severinghaus, J.P., 2005, A revised +10 +/-4oC magnitude of the abrupt change in Greenland temperature of the Younger Dryas termination using published GISP2 gas isotope data and air thermal diffusion constants: Quaternary Science Reviews, v. 24, p. 513-519.
IPCC, 2007, Climate change 2007: Fourth Assessment Report of the International Panel on Climate Change: Cambridge University Press, Cambridge, UK, 996 p.
Knies, J., Matthiessen, J., Mackensen, A., Stein, R., Vogt, C., Frederichs, T., and Nam, S., 2007, Effects of Arctic freshwater forcing on thermohaline circulation during the Pleistocene: Geology, v. 35, p. 1075-1078.
Lowell, T.V., Fisher, T.G., Comer, G.C., Hajdas, I., Waterson, N., Glover, K., Loope, H.M., Schaefer, J.M., Rinterknecht, V., Broecker, W., Denton, G., and Teller, J.T., 2005, Testing the Lake Agassiz meltwater trigger for the Younger Dryas: EOS, v. 86, p. 365-373.
McManus, J.F., Francois, R., Gherardi, J.- M., Keigwin, L.D., and Brown-Leger, S., 2004, Collapse and rapid resumption of Atlantic meridional circulation linked to deglacial climate changes: Nature, v. 428, p. 834-837.
Murton, J.B., Bateman, M.D., Dallimore, S.R., Teller, J.T. and Yang, Z., 2010, Identification of Younger Dryas outburst flood path from Lake Agassiz to the Arctic Ocean: Nature, v. 464, p. 740-743, doi:10.1038/nature08954.
Otto-Bliesner, B.L., and Brady, E.C., 2001, Tropical Pacific variability in the NCAR Climate System Model: Journal of Climate, v. 14, p. 3587-3607.
Peltier, W.R., 2004, Global glacial isostasy and the surface of the ice-age Earth: The ICE-5G(VM2) model and GRACE: Annual Reviews of Earth and Planetary Sciences, v. 32, p. 111-149.
Peltier, W.R., 2007, Rapid climate change and Arctic Ocean freshening: Geology, v. 35, p. 1147-1148, doi:10.1130/focus122007.1.
Peltier, W.R., 2009, Closure of the budget of global sea level rise over the GRACE era: Quaternary Science Reviews, v. 28, p. 1658-1674, doi:10.1016/j.quascirev.2009.04.004.
Peltier, W.R., and Solheim, L.P., 2004, The climate of the Earth at Last Glacial Maximum: Statistical equilibrium state and a mode of internal variability: Quaternary Science Reviews, v. 23, p. 335-357.
Peltier, W.R., and Drummond, R., 2008, The rheological stratification of the lithosphere: A direct inference based upon the geodetically observed pattern of the glacial isostatic adjustment of the North American continent: Geophysical Research Letters, v. 35, L16314, doi: 10.1029/2008GL034586.
Peltier, W.R., and Luthcke, S.B., 2009, On the origins of Earth rotation anomalies: New insights on the basis of both "Paleogeodetic" daat and Gravity Recovery and Climate Experiment (GRACE) data: Journal of Geophysical Research, v. 114, B11405. doi:10.1029/JB006352.2009.
Peltier, W.R., Vettoretti, G., and Stastna, M., 2006, Atlantic meridional overturning and climate response to Arctic Ocean freshening: Geophysical Research Letters, v. 33, L06713, doi:10.1029/2005GL025251.
Semtner, A.J., 1976, A model for the thermodynamic growth of sea-ice in numerical investigations of climate: Journal of Physical Oceanography, v. 6, p. 379-389.
Tarasov, L., and Peltier, W.R., 2005, Arctic freshwater forcing of the Younger Dryas cold reversal: Nature, v. 435, p. 662-665.
Weatherly, J.W., Briegleb, B.P., Large, W.G., and Maslanik, J.A., 1998, Sea ice and polar climate in the NCAR CSM: Journal of Climate, v. 11, p. 1472-1486.