Series
International Year of Planet Earth 5.
Applications of Seafloor Mapping on the Canadian Atlantic Continental Shelf
Brian J. ToddGeological Survey of Canada (Atlantic), Natural Resources Canada, Bedford Institute of Oceanography, PO Box 1006 Dartmouth, NS, Canada, B2Y 4A2
brian.todd@NRCan.gc.ca
John Shaw
Geological Survey of Canada (Atlantic), Natural Resources Canada, Bedford Institute of Oceanography, PO Box 1006 Dartmouth, NS, Canada, B2Y 4A2
john.shaw@NRCan.gc.ca
Submitted December 2008. Accepted as revised May 2009
SUMMARY
Canada’s final mapping frontier is its offshore territory. Compared to Canada’s landmass, only a limited portion of Canada’s seafloor has been mapped using the modern technology of multi-beam sonar. Where this high-resolution mapping technique has been applied on Canada’s Atlantic continental margin, insight has been gained into the studies of seafloor habitat mapping, Quaternary history and sea-level change, sediment bedforms and dynamics, and seafloor conditions for in-stream tidal power. Seafloor habitat mapping in Canada provides the knowledge base to effectively manage offshore fisheries, evaluate marine protected areas, minimize the environmental impact of offshore development, and resolve seafloor-use conflicts. Multibeam sonar mapping has revealed a complex glacial landsystem developed on the Canadian Atlantic continental shelf and supports the concept of the late glacial maximum reaching the shelf edge. The application of multibeam sonar technology offers unprecedented images of bedform geomorphology and this knowledge is crucial to understanding sediment mobility and its effect on seafloor habitat, engineering, and infrastructure. To minimize the risk to engineering infrastructure on the seabed, planning of tidal-energy developments in regions of large tidal range requires detailed information about the water depth, seafloor substrate and sediment mobility, and long-term seabed change garnered using multibeam sonar mapping techniques.RÉSUMÉ
L’ultime frontière de la cartographie du Canada est son territoire extracôtier. Par rapport à son territoire continental, seule une faible portion du territoire extracôtier canadien a été cartographié par la technique moderne d’imagerie sonar multifaisceaux. Là où cette technique de cartographie de haute résolution a été utilisée sur la marge continentale canadienne atlantique, on a pu faire des progrès dans l’étude de cartographie d’habitat du fond marin, de l’histoire quaternaire des fluctuations du niveau de la mer, de la morphologie des couches et de la dynamique sédimentaires, ainsi que des caractéristiques du fond marin en vue de l’installation de centrales marémotrices. La cartographie d’habitat du fond marin permet de constituer une base de connaissances nécessaires pour gérer efficacement la pêche hauturière, établir la valeur des zones marines protégées, minimiser les incidences environ-nementales des activités de mise en valeur extracôtières, et résoudre les conflits d’utilisation des fonds marins. La cartographie par imagerie sonar multifaisceaux a montré qu’un système complexe de terres émergées s’est développé sur le plateau continental atlantique du Canada et qui correspond au concept d’un maximum glaciaire ayant atteint la limite du plateau continental. L’utilisation de la technologie sonar multifaisceaux permet d’obtenir des images sans précédents de la morphologie des dépôts, et ces connaissances sont cruciales pour comprendre la mobilité des sédiments et les répercussions sur l’habitat du fond marin, les aménagements et les infrastructures. Dans le but de minimiser les risques sur les infrastructures installées sur le fond marin, la planification d’installations marémotrices en zones de marées à grandes variations exige des informations détaillées sur la profondeur d’eau, la nature du fond marin et la mobilité des sédiments, ainsi que sur les changements à longs termes obtenues par l’utilisation de technique de cartographie sonar multifaisceaux.INTRODUCTION
1 Canada is the second largest country in the world, with a land area of almost 10 million square kilometres (Atlas of Canada 2001). The area of seafloor over which Canada currently exercises sovereignty is 7.1 million square kilometres (Fisheries and Oceans Canada 2009). By 2013, Canada intends to make a submission to the United Nations Commission on the Limits of the Continental Shelf that defines the outer limits of Canada’s continental shelf (Foreign Affairs and International Trade Canada 2008). Initial estimates indicate that this will add approximately 1.75 million square kilometres of seafloor, an area almost the combined size of the three prairie provinces, to the current total. This will increase Canada’s offshore territory to 8.85 million square kilometres, nearly equivalent to Canada’s land area.
2 All of Canada’s subaerial territory has been topographically mapped at a scale of 1:250 000 (913 sheets), and ninety percent has been mapped at a scale of 1:50 000 (12 119 sheets) (Mapping Services Branch, Natural Resources Canada 2007). In contrast to Canada’s subaerial map coverage, less than 1% of the present seafloor has been mapped using the modern technology of multibeam sonar. The advent of this technology in the early 1990s revolutionized marine geological mapping in Canada and worldwide (Courtney and Shaw 2000; Wille 2005). Multibeam sonar enables full seafloor mapping coverage and the ability to discriminate and locate objects as small as 0.5–1.0 m (Mayer 2006). Prior to this technological advance, geological maps of the Canadian Atlantic continental shelf, mainly at a scale of 1:250 000, had been compiled from relatively widely spaced single-beam sonar tran-sects analyzed in conjunction with traditional marine geophysical techniques (seismic reflection profiling and sides-can sonar); resulting geological interpretations were verified by sampling of seabed sediment and rock. In contrast, seafloor mapping at scales approaching 1:1000 is now routinely undertaken using multibeam sonar.
3 A decade ago, the new ability to map the seafloor at larger scales than previously possible coincided with a growing demand from governments, industry, academia and the public for increasingly detailed information about Canada’s offshore territory and how it was being developed (e.g. Pickrill et al. 2001). Like topographic and geological maps on land, maps of offshore Canada are used for different and distinct purposes. In this paper, four vignettes of the scientific results from seafloor mapping on Canada’s Atlantic continental margin, encompassing:
- Seafloor habitat mapping;
- Quaternary history and sea-level change;
- Sediment bedforms and dynamics; and
- Seafloor engineering for in-stream tidal power, are presented.
We discuss the context of each vignette and describe how the new view of the seafloor, embodied by maps based on multibeam sonar technology, have enhanced our scientific understanding of these aspects of Canada’s offshore lands.
SEAFLOOR HABITAT MAPPING
4 Public and government concern with the identification, management and conservation of marine environments and species has stimulated legislation throughout the world, e.g. Canada’s Oceans Act (Parliament of Canada 1996), The United States’ Magnuson– Stevens Fishery Conservation and Management Act (United States 1996) and Australia’s Environment Protection and Biodiversity Conservation Act (Commonwealth of Australia 1999). To create successful strategies to manage, protect and sustain Canada’s marine resources, knowledge of the distribution of seafloor habitats and the organisms that inhabit them is required. To address this need, the interdisciplinary scientific field of seafloor habitat mapping has been applied to provide the knowledge required to effectively manage offshore fisheries, evaluate marine protected areas, minimize the environmental impact of offshore development, and resolve seafloor use conflicts.
5 In mapping the ocean floor, habitat is defined as a spatially recognizable area where the physical, chemical, and biological environment is distinctly different from surrounding environments (Kostylev et al. 2001). Seafloor organisms can be associated with specific habitat properties, hence relationships between organisms and habitat may allow habitat to be used as a proxy to predict species distribution and abundance over large tracts of the ocean. However, such prediction requires accurate regional mapping of seafloor habitat. The latter is accomplished by applying a suite of acoustical methods including multibeam sonar, sidescan sonar, and seismic reflection profiling. Although the seafloor topography and backscatter strength information extracted from multibeam sonar data are a solid foundation for the study of habitats, the classification of habitats also requires analysis of seafloor video and photographic imagery in conjunction with knowledge gleaned from geological and biological samples of the seabed.
Sea Scallops on German Bank, Scotian Shelf
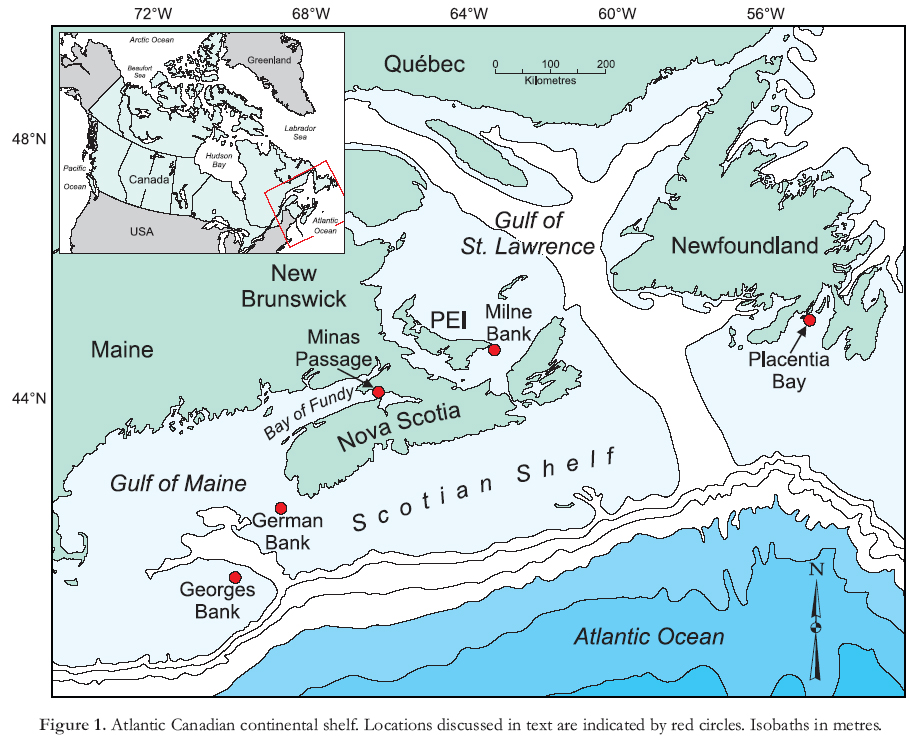
6 To illustrate how one aspect of seafloor habitat mapping has been applied recently, consider German Bank on the southern Scotian Shelf (Fig. 1), where seafloor habitat maps are the critical underpinning of a lucrative sea scallop fishing ground that was opened in 2001 (Smith et al. 2005, 2006). In a departure from previous practice, the resource manager (the Government of Canada) and the fishing industry shared in map development and utilization.
7 The geomorphology of German Bank is dominated by outcrop-ping bedrock (Fig. 2A) that was modified by glacial erosion (King and McLean 1976; King and Fader 1986). Overlying the bedrock are discontinuous and relatively thin deposits (up to 30 m thick) of unconsolidated Quaternary sediments (till and glaciomarine silt) (Fig. 2C). The Quaternary deposits are overlain, in turn, by a veneer of postglacial sediment (sand and gravel) that reaches 20 m thickness, in places, and partially buries glacial landforms (moraines formed of till) on the seafloor (Todd et al. 2007; Todd 2009).
8 Periodic surveys are a customary method of monitoring shellfish populations (Gunderson 1993) and a stratified random sampling design is commonly used to establish sampling locations. Stratified random sampling is an experimental design that divides a geographic study area into smaller areas called strata; the design then selects a number of random sample sites within each stratum, the number of sites being proportional to either the area of the stratum or to the relative variance (if known) associated with the stratum (Thompson 2002). On German Bank, sea scallops (Placopecten magellanicus) were collected at sample locations from 2001 to 2007 (Smith et al. 2008). The distribution of sample stations and numbers of scallops collected are shown on the surficial geology map (Fig. 2C). It is evident from this comparison that the largest number of sea scallops are associated with sample stations located on post-glacial sand and gravel sediment. The affinity of sea scallops for this substrate is strikingly demonstrated in Figure 3, which shows an order of magnitude difference between the density of sea scallops (animals/km2) on glaciomarine silt (13), till (40), bedrock (83) and postglacial sand and gravel (950). Elsewhere on the Scotian Shelf, substrate type has also been identified as the determining factor for sea scallop distribution (Thouzeau et al. 1991; Kostylev et al. 2003).
Figure 1. Atlantic Canadian continental shelf. Locations discussed in text are indicated by red circles. Isobaths in metres.
Display large image of Figure 1
9 High-resolution seafloor habitat mapping has directly benefited the fishing sector of Canada’s marine economy (Pickrill and Todd 2003). Sea scallop fishing vessels routinely use multibeam-based maps onboard to improve fishing efficiency, resulting in reduced time at sea and the concomitant reduction in fuel consumption. Because the sea scallop fishery now reaches its government-regulated catch limit in as little as one-quarter the time required before the advent of the high-resolution maps, seafloor habitat is less impacted by trawling (Pickrill and Kostylev 2007). As a result of the success of seafloor habitat mapping with the sea scallop, this approach is now being applied to other commercial species such as American lobster (Tremblay et al. 2008).
QUATERNARY HISTORY AND SEA-LEVEL CHANGE
Advances in Understanding Shelf Glaciation
10 It has long been recognized that glaciation has imparted a distinctive character to the Canadian continental shelves. Although surficial geology maps (e.g. Fader et al. 1977, 1982) and scientific reports (e.g. King and Fader 1986) have showed that vast areas of the seafloor of Atlantic Canada are under-lain by glacigenic sediments, the Canada-wide synthesis of Dyke and Prest (1987) positioned the last glacial maximum (LGM) ice margin at the modern coasts. This inconsistency was remedied with the advent of atomic mass spectroscopy (AMS) dating of biogenic material in marine sediments, which replaced the previous bulk-dating method. Following King and Fader’s (1989) reported AMS dates for Atlantic Canadian shelves, Dyke et al. (2002) depicted the LGM margin near the edge of the continental shelves.
Figure 2. Mapping sea scallop habitat on German Bank, Scotian Shelf. A)Shaded-relief bathymetry; B) backscatter strength; C) interpreted surficial geology, showing the location of sea scallop survey tows (2001–2007) and number of scallops per tow.

Display large image of Figure 2
11 Shaw et al. (2006) expanded on this idea of the LGM margin by developing a conceptual model of late Wisconsinan glaciation of Atlantic Canada shelves. The model was informed by emerging ideas on modern ice sheets in Greenland and Antarctica (Bamber et al. 2000a, b, 2001). It was argued that the late Wisconsinan ice sheet was organized into catchments drained by ice streams; the ice margin lay at the edge of the continental shelf at the LGM (Fig. 4), with ice streams occupying shelf troughs. Early retreat took place in calving embayments and along channels, stranding ice on the intervening banks. A major calving episode, beginning just before 14 000 14C yr before present (BP) (Fig. 4), removed ice from the Gulf of St. Lawrence; by 13 000 14C yr BP most glacial ice in Atlantic Canada was on land, and ablated by melting rather than by calving.
High Resolution Imagery of Glacial Landsystems
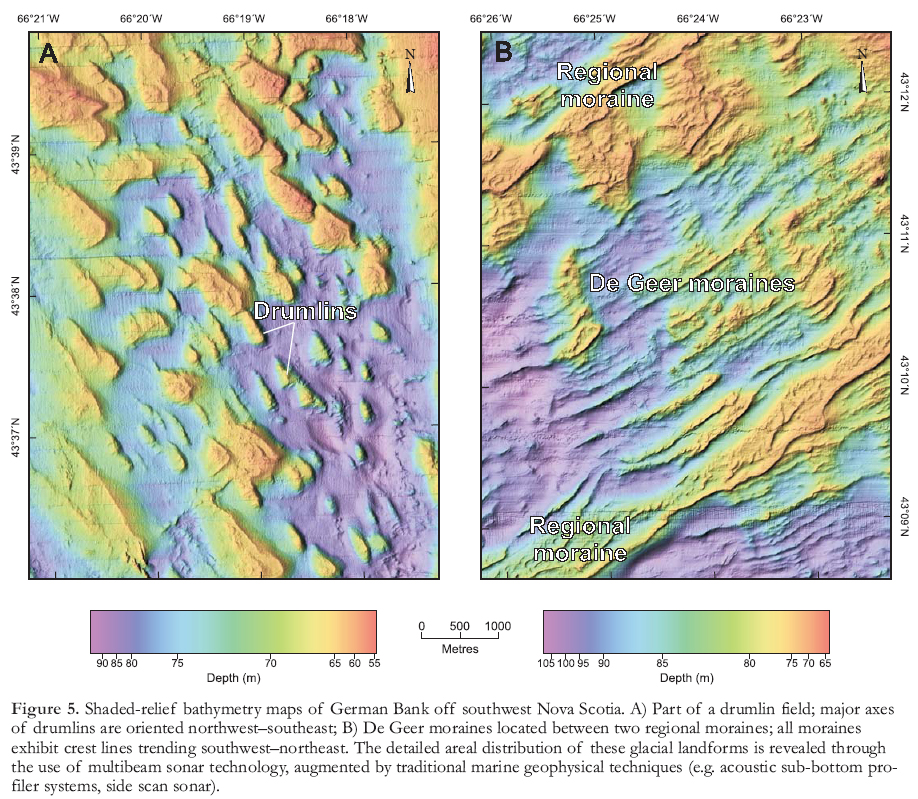
12 The glacial landsystems approach, as presented by Evans (2006), evaluates the geomorphology and subsurface materials in a glaciated landscape and relates them to the processes of formation. Data from multibeam sonar systems (Courtney and Shaw 2000) collected from the mid-1990s onward reveal the complexity of glacial landsystems developed on continental shelves by ice advance and retreat (Shaw et al. 2009), and expand our understanding of glacial processes that were hitherto based on acoustical sensing by sub-bottom acoustic profilers and sidescan sonar. The new data support the model of the LGM margin being positioned near the edge of the Atlantic continental shelf. Two examples of new seafloor data are presented here. On German Bank, subglacial landforms, indicative of former ice-flow direction and velocity, include drumlins (the counterparts of large drumlin fields on land in southwest Nova Scotia; Fig. 5A) and megaflutes (more elongated versions of drumlins that indicate faster ice flow). The pattern of retreat is indicated by regional-scale moraines (>10 km long) that reflect major stillstands during retreat, or even re-advances, and De Geer moraines (<10 km long) that point to incremental retreat of grounded ice in shallow water (Fig. 5B; Todd et al. 2007).
13 The new multibeam data show great regional variations in landsystems, correlative with regional variations in ice dynamics. For example, in Placentia Bay, southern Newfoundland, fields of drumlins and megaflutes (Fig. 6) that curve toward the south are evidence of accelerating, fast-flowing grounded ice. From the fields of De Geer moraines superimposed on the megaflutes (and radiocarbon dates on glaciomarine sediments; Shaw et al. 2008b) we infer subsequent incremental retreat of the late Wisconsinan ice margin toward shallower water to the north.
Figure 3. Density of sea scallops found on different surficial geological units on German Bank, highlighting the affinity of sea scallops for the postglacial sand and gravel substrate.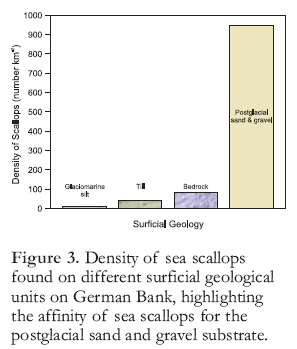
Relative Sea-level Changes on Continental Shelves
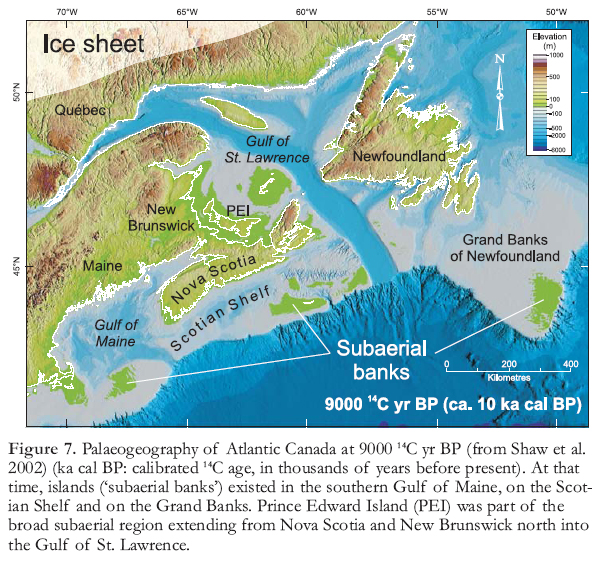
14 In the past decade, advances have been made in understanding how changes in relative sea level, resulting from glacioisostatic processes, alter geography. For example, Hetherington et al. (2003) showed changes on Canada’s Pacific coast after deglaciation. Shaw et al. (2002) published maps showing paleo-geographic time slices for Atlantic Canada. Figure 7 depicts the situation at 9000 14C yr BP, at which time islands on the outer continental shelf that had been more extensive at earlier times, were submerging rapidly. Prince Edward Island (PEI) was still connected to the mainland of Nova Scotia, and would only become an island at ca. 6000 14C yr BP. More refined relative sea-level curves may alter these maps somewhat, but nonetheless they provide a useful guide to areas that were formerly emergent. Note that relative sea-level rise due to glacio-isostasy continues today in much of Atlantic Canada; the line of zero subsidence extends along the northern Gulf of St. Lawrence.
SEDIMENT BEDFORMS AND DYNAMICS
New Views of Sediment Bedforms
15 Bedforms are wave-like geometric configurations of the water–sediment interface that are formed by fluid flow over an erodable granular bed (Allen 1985). The presence of bedforms indicates that fluid velocities are, or were, sufficient to erode and transport surficial sediment. Sediment bedforms are migratory features and their height, wavelength, and speed and direction of migration are a function of sediment grain size in the eroding bed, water depth, and current velocity (Allen 1985; Whitmeyer and FitzGerald 2008). Prior to the advent of multi-beam sonar, our view of sediment bed-forms was limited to the swath width of sidescan sonar (tens to hundreds of metres). Even when multiple sidescan sonograms are manipulated into a mosaic to create a regional map showing morphology, bedform elevation is still lacking. Multibeam sonar offers unprecedented images of bedform geometry and provides elevation infor mation as well as backscatter strength, which is a proxy for sediment grain size (Courtney and Shaw 2000). Such geomorphological knowledge is crucial to understanding sediment mobility and its potential effect on seafloor habitat, engineering and infrastructure.
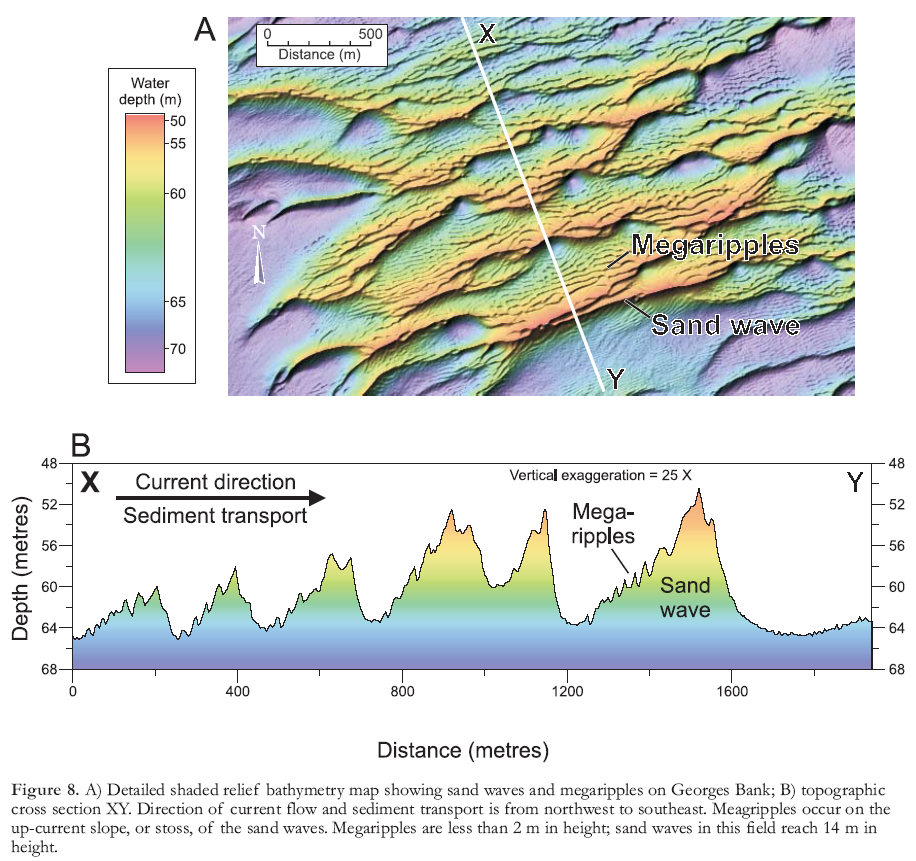
16 A stunning array of sediment bedforms exists on Georges Bank, a large submarine bank in the Gulf of Maine near the edge of the continental shelf south of Nova Scotia and east of Cape Cod (Fig. 1). At water depths of about 60 m or less, sediment on Georges Bank is continually reworked by tidal currents, resulting in a size hierarchy of current-generated bed-forms in sand-rich areas. Although these Georges Bank bedforms have been recognized for decades (e.g. Shepard et al. 1934; Jordan 1962), early work using single beam sonar captured only the gross geomorphology and bank-wide distribution of these features. On northeastern Georges Bank, multibeam sonar was used to map sand waves with crests trending approximately southwest–northeast (Fig. 8), normal to the major axis of the semi-diurnal tidal current (Butman and Beardsley 1987). Sand wave crests display a complex anastomosing pattern in plan view (Fig. 8). The sand waves have wavelengths of 50–300 m and reach heights of 19 m. In cross section they are asymmetric, and display gently-sloping upcurrent, or stoss, faces, and steeply dipping downcurrent, or lee, faces. Superimposed on the sand waves and sharing the same general crest orientation are megaripples; these features have smaller wavelengths and heights and exhibit a complex three-dimensional pattern in plan view (Fig. 8). Based on the morphological characteristics of the sand waves, and their overall distribution, a southeast direction of sediment transport is inferred for northeastern Georges Bank, suggesting that sediment is lost from the bank down the continental slope.
Figure 4. Glacial ice extent at ca. 14 000 14C yr BP (radiocarbon years), when iceberg calving was extensive in the Gulf of St. Lawrence (ka cal BP: calibrated 14C age, in thousands of years before present). The late Wisconsinan last glacial maximum (LGM) ice margin is indicated by the dashed black line. Flow lines within the ice sheet are shown by thin blue lines. Dashed grey lines indicate ice divides within the ice sheet. Calving during deglaciation was dominantly in deep water, so that ice caps were isolated on the offshore banks (shown in green) in some areas.Figure 5. Shaded-relief bathymetry maps of German Bank off southwest Nova Scotia. A) Part of a drumlin field; major axes of drumlins are oriented northwest–southeast; B) De Geer moraines located between two regional moraines; all moraines exhibit crest lines trending southwest–northeast. The detailed areal distribution of these glacial landforms is revealed through the use of multibeam sonar technology, augmented by traditional marine geophysical techniques (e.g. acoustic sub-bottom profiler systems, side scan sonar).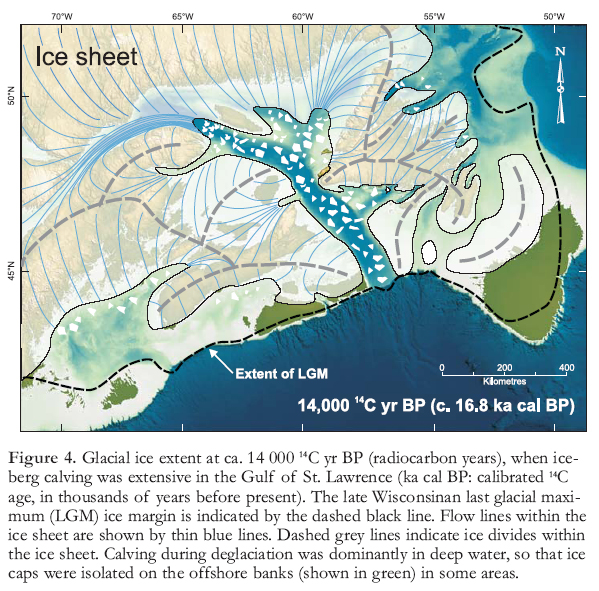
Broad-scale Sediment Movement
17 Measurements of bedform geomorphology based on multibeam sonar provide critical data for sediment transport modelling. To test these models, repetitive multibeam sonar mapping – the marine equivalent to repeated aerial photography over land – provides insight into sediment transport processes and pathways and reveals changes in seafloor geomorphology over time. In turn, measurements of these changes are used to refine transport models.
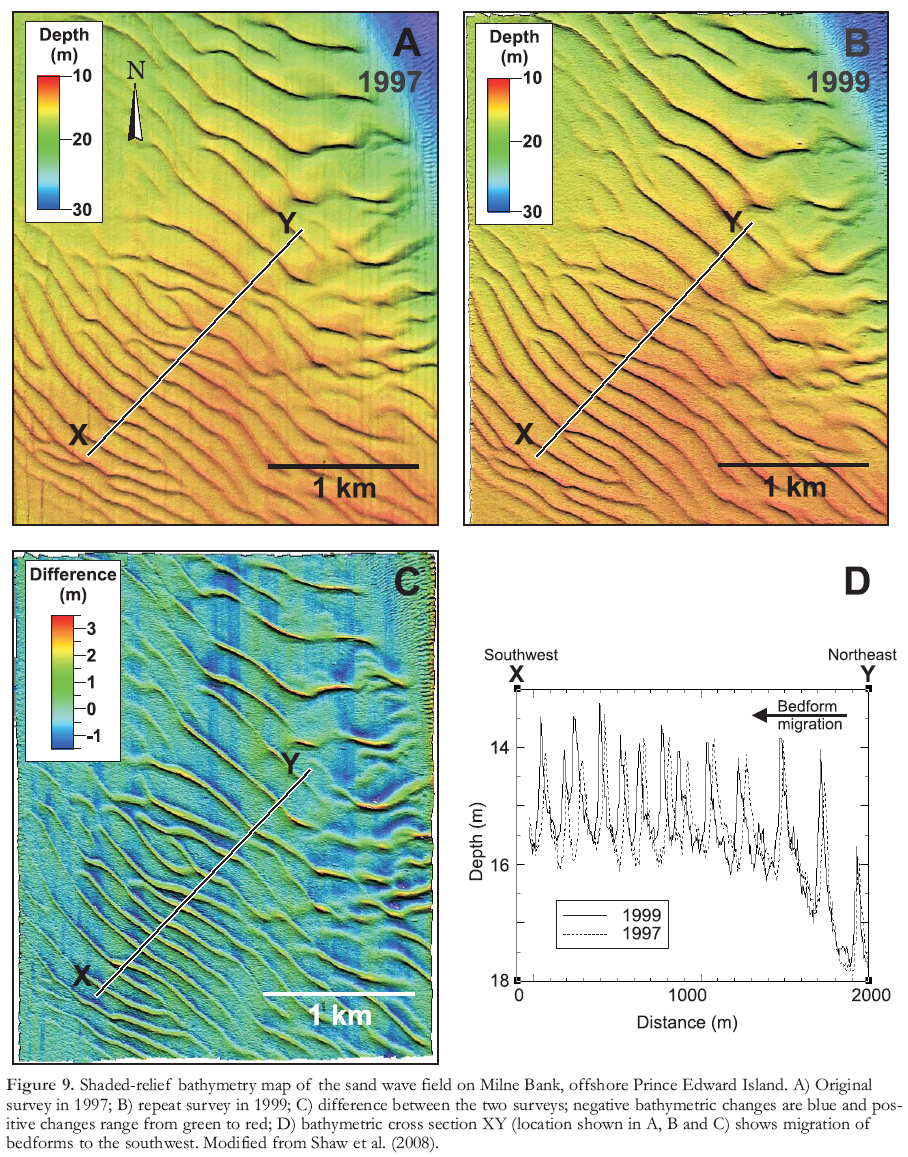
18 To investigate the broad-scale sediment transport around eastern Prince Edward Island in the Gulf of St. Lawrence (Fig. 1), multibeam sonar surveys were conducted two years apart on Milne Bank (Shaw et al. 2008a). This bank is located at the transition from the eroding north coast to the depositional south coast of the island. Part of Milne Bank is covered by a field of sand waves with crests that are oriented northwest to southeast (Fig. 9). The sand waves are 2 to 4 m in height and have a mean wavelength of 158 m. In cross section, the sand waves are asymmetric with steeper lee faces to the southwest. The southerly tidal current here has a maximum magnitude of 60 cm/sec (Shaw et al. 2008a) which is above the threshold of 42 to 46 cm/sec required for sediment motion of bank sand grains measuring 0.25 to 0.33 mm in size (Miller et al. 1977).
Figure 6. Shaded-relief bathymetry map showing outcropping bedrock mantled by drumlins and megaflutes in Placentia Bay, southern Newfoundland. Drumlins are ridges of ice-contact sediment (till) formed under the ice, and are elongated in the former ice-flow direction. Megaflutes are more elongated than drumlins, and indicate faster ice flow. Here the convergent pattern is indicative of acceleration of grounded ice towards the south. In the bottom right of the image the megaflutes disappear beneath a cover of glaciomarine mud (heavily imprinted by iceberg furrows) and postglacial mud. A more complete description is given in Shaw et al. (2009b).

Display large image of Figure 6
Display large image of Figure 7
19 Figure 9 shows bathymetric maps of the repeated surveys on Milne Bank. Although perhaps not immediately evident to the eye at the scale of this figure, changes in seafloor bathymetry over the course of two years are highlighted by the difference map (Fig. 9C), which shows areas that have increased and decreased in relief. The sand wave field experienced a net migration to the southwest of about 17 m/yr; the maximum distance moved in two years was 49 m.
20 As climate change and sea-level rise continue to affect Canada’s coastal infrastructure, and as offshore resource industries build new seafloor installations, repetitive seafloor mapping will play an increasingly important role in efforts to mitigate deleterious effects of sediment movement.
SEAFLOOR ENGINEERING FOR IN-STREAM TIDAL POWER
21 The Bay of Fundy is an estuarine embayment in the northeast Gulf of Maine between Nova Scotia and New Brunswick (Fig. 1). The largest tides in the world occur here; the tidal range is 4 m at the mouth of the bay, where it joins the Gulf of Maine, and attains a maximum of 17 m at the head (Bishop 2008). These large tides generate strong currents; the harnessing of these currents to generate power has been the focus of engineering schemes dating back to 1910 (Baker 1982) and has periodically garnered attention throughout the twentieth century (Daborn and Dadswell 1988; Desplanque and Mossman 2004). In the 1960s, a plan to construct a tidal dam was abandoned, partly because of predicted widespread environmental effects, including alteration of the tidal range throughout the Bay of Fundy and Gulf of Maine. With revived interest in renewable energy, advances in engineering of marine structures, and the success of ‘in-stream’ installations elsewhere (e.g. United Kingdom, France), Minas Passage at the head of the Bay of Fundy (Fig. 1) is now the subject of an engineering study as a site for electricity generation.
Figure 8. A) Detailed shaded relief bathymetry map showing sand waves and megaripples on Georges Bank; B) topographic cross section XY. Direction of current flow and sediment transport is from northwest to southeast. Meagripples occur on the up-current slope, or stoss, of the sand waves. Megaripples are less than 2 m in height; sand waves in this field reach 14 m in height.
Display large image of Figure 8
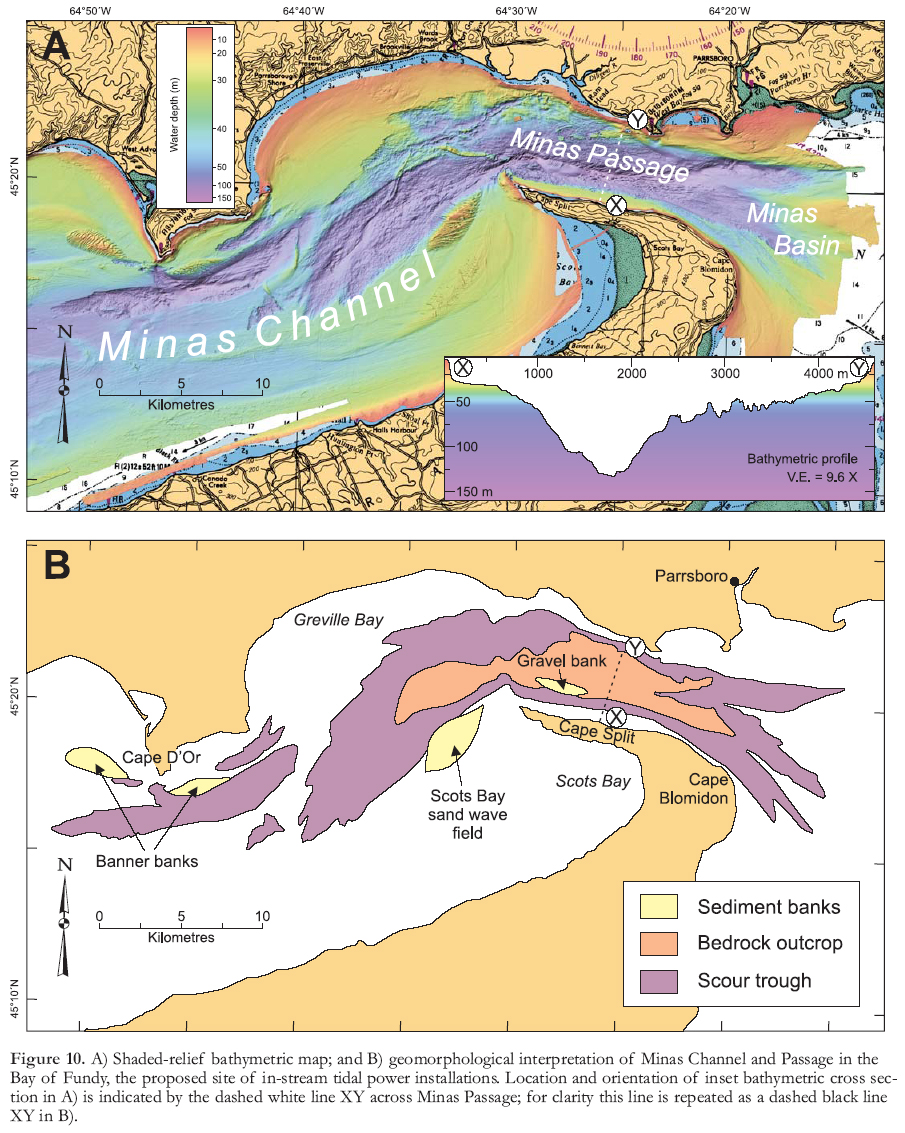
22 Multibeam sonar mapping of this region of the Bay of Fundy reveals a complex seafloor geomorphology much affected by tidal currents (Fig. 10). During glacial and deglacial time, it is likely that sediment was deposited throughout Minas Channel and Minas Passage. As the ice sheet ablated and sea-level rose, the high tidal range of the Bay of Fundy began to develop about 7000 yr BP (Scott and Greenberg 1983; Gehrels et al. 1995). Powerful currents sweeping through Minas Passage eroded the Quaternary sediments and created a scour trough that reaches a depth of 170 m and splays to the west and east in a series of separate, finger-like troughs. The volume of Quaternary sediment removed from the trough is conservatively estimated at 4 km3. Out-cropping bedrock lies at the core of the scour trough.
23 Undoubtedly the most important criterion in the selection of an installation site for in-stream tidal energy conversion infrastructure is tidal current speed; this is directly related to the amount of energy that can be extracted (Electric Power Research Institute (EPRI) 2005). The kinetic energy of moving water turning rotors [http://www.seageneration.co.uk] or turbines [http://www.lunarenergy.co.uk] is transformed into electricity. Currents of 7–8 knots (13–15 km/hr) are documented on the south side of Minas Passage adjacent to Cape Split (Fig. 10), whereas current velocity on the north side is 5–6 knots (9–11 km/hr) (Canadian Hydrographic Service 2003). Theoretically, up to 7 GW of power is available for extraction (Karsten et al. 2008). However, with the engineering technology currently available, EPRI (2005) estimates suggest that the maximum in-stream tidal capacity that could be installed within Minas Passage is 333 MW.
Figure 9. Shaded-relief bathymetry map of the sand wave field on Milne Bank, offshore Prince Edward Island. A) Original survey in 1997; B) repeat survey in 1999; C) difference between the two surveys; negative bathymetric changes are blue and positive changes range from green to red; D) bathymetric cross section XY (location shown in A, B and C) shows migration of bedforms to the southwest. Modified from Shaw et al. (2008).
Display large image of Figure 9
Display large image of Figure 10
24 Three other site selection criteria are significant in the case of Minas Passage: bathymetry, seafloor geology, and submarine cable routes. First, once the tidal current energy resource has been established, bathymetry must be considered. For example, rotors and turbines are large devices (reaching 25 m in diameter) that can require up to 35 m water depth for installation; in passages used by commercial shipping, the minimum water depth required for safe operation can reach almost 50 m (EPRI 2005). Water depths in central Minas Passage are well in excess of this minimum (Fig. 10). Second, the geology of the seafloor must be suitable for the in-stream device foundation; regardless of the engineering design, the devices must be situated on bedrock (EPRI 2005). Approximately 44 km2 of bedrock is exposed in Minas Passage, almost all of which is below 50 m (Fig. 10). Third, the submarine cable route to shore must be considered in terms of substrate composition, potential for sediment mobility and changes to the seafloor over time. Although exposed bedrock predominates in Minas Passage and Minas Channel, notable current-formed sedimentary features are situated adjacent to prominent headlands. Paired sets of these sediment banks or ‘banner banks’ (Dyer and Huntley 1999) are located on each side of Cape D’Or and Cape Split, including the Scots Bay sand wave field flanking Cape Split (Fig. 10). The orientation of the bedforms in the Scots Bay field indicates that bedform migration is counterclockwise, being to the south on the west side of the field and to the north on east side of the field. This extensive sand deposit is surrounded by an immobile gravel seafloor (Fader and Miller 1991), suggesting that the sand wave field is a self-contained system, likely trapped within a large tidal eddy. The banner bank twin of the Scots Bay sand wave field is a 3 km-long, 20 m-thick body of gravel waves trapped in the deep bedrock trough north of Cape Split. To improve our understanding of sediment transport on the seafloor in Minas Passage, in situ current measurements are required in this challenging environment.
DISCUSSION AND CONCLUSION
25 The four vignettes of seafloor mapping in Atlantic Canada presented here have highlighted how multibeam sonar technology has, when applied in conjunction with traditional marine geo-science survey techniques, contributed to the emerging field of habitat mapping, improved our scientific understanding of Quaternary history and sea-level change, shown sediment bed-forms in unprecedented detail, and provided the basis for future in-stream tidal power development.
26 Multibeam sonar technology is being utilized by Natural Resources Canada throughout Canada’s offshore lands in a variety of geological settings with different scientific objectives. In the Labrador Sea (Fig. 1), increased world demand for natural gas has renewed interest in hydrocarbon exploration and development on the Labrador Shelf. An important engineering constraint to seabed infrastructure in this region is the drift of icebergs southward along the Labrador Shelf, where iceberg keels contact and deform seabed sediments. Repetitive seabed mapping using multibeam and sidescan sonar in exploration areas has focused on estimating scour rates and improving the discrimination of modern and relict iceberg scours (King and Sonnichsen 2008). In Canada’s north, future hydrocarbon infrastructure development in the Beaufort Sea (Fig. 1) will also face engineering constraints. For example, seafloor mapping using multibeam sonar has revealed scours formed by the keels of sea-ice pressure ridges, submarine slumps, active pockmarks formed by gas venting, and possible mud volcanoes (Blasco et al. 2005). In the Pacific Ocean offshore British Columbia (Fig. 1), siliceous sponge reefs have been recognized for two decades. These reefs form distinctive ecological settings that provide habitat, at a range of spatial scales, to a diverse community of species. Multibeam sonar backscatter strength has been used to map the areal extent of sponge reefs, which exhibit distinctive low backscatter strength in contrast with the high backscatter strength of bedrock and sediments (Conway et al. 2005).
27 Worldwide, multibeam sonar mapping of the seafloor has extended to almost every aspect of marine science, ranging from tectonics to engineering to biology to archaeology, and has ranged geographically over all ocean territory from the Antarctic to the Arctic (see Wille (2005) for a comprehensive suite of examples). Most of the seafloor mapping done worldwide is undertaken by surface vessels, which are expensive and time-consuming to operate. A small, but increasing, proportion of seafloor mapping is underway through the use of autonomous, unmanned underwater vehicles (AUVs), which are less expensive to produce and operate than ocean-going research vessels, and have the added advantage of being capable of deep diving for specific mapping tasks on abyssal plains or long-duration diving to map beneath a cover of sea ice [see http://www.transit-port.net/Lists/AUVs.org.html for a list of international AUV engineering groups and projects]. It is likely that, as seafloor mapping reaches to increasingly remote oceanic locations, the use of AUVs will become more common.
28 A decade ago, the growing recognition of the powerful utility of the technique, and the emergence of a standard suite of data formats and map products, led to the proposal in 2001 of the national SeaMap program, designed to map Canada’s offshore lands (Pickrill and Kostylev 2007). SeaMap was a joint initiative between Natural Resources Canada and Fish-eries and Oceans Canada; its goals were to establish mapping and reporting standards and to set national priorities for mapping the shape of the seabed, the bedrock and overlying sediments, and the associated benthic communities. This systematic mapping of Canada’s offshore lands was envisioned as providing the knowledge base to underpin Canada’s Oceans Act. Although the SeaMap proposal was not funded, its robust underlying principles continue to guide seafloor mapping science and research within Natural Resources Canada. Indeed, the SeaMap concept and principles have been adopted internationally with successful seafloor mapping programs in Ireland (Irish National Seabed Survey, [http://www.infomar.ie]), Norway (MAREANO, [http://www.mareano.no/english/index.html]) and the European Union (BALANCE, [http://www.balance-eu.org/]).
29 Natural Resources Canada has established new standards for seafloor mapping based on multibeam sonar and other acoustic and bottom-sampling techniques (Shaw and Todd 2002) and has embarked on a new Marine Map Series (e.g. Shaw and Potter 2008; Todd 2009). In partnership with the Canadian Hydrographic Service, Natural Resources Canada is systematically mapping high-priority areas of Canada’s offshore lands as resources become available and national priorities evolve.
ACKNOWLEDGEMENTS
The multibeam sonar information discussed here are local-scale examples extracted from regional surveys that have been ongoing for over a decade. We thank the masters and crews of Canadian government and private industry vessels that have made collection of the multibeam sonar data possible, including the CCGS Frederick J. Creed, CCGS Matthew, and the MV Anne S. Pierce. Staff of the Canadian Hydrographic Service, the Geological Survey of Canada, and the Ocean Mapping Group of the University of New Brunswick spent many months at sea collecting the data, and many more months in the laboratory processing the information. The last decade of marine geological research at the Geological Survey of Canada greatly benefited from the guidance of Richard A. Pickrill, who was instrumental in establishing productive partnerships within the Government of Canada, and with academia and private industry. Stephen J. Smith of Fisheries and Oceans Canada kindly provided the German Bank sea scallop catch data and shared his statistical insight. Scott Hayward provided GIS and mapping support. We thank Vladimir Kostylev, Vaughn Barrie, Patrick Potter, Steve Solomon (Geological Survey of Canada) and James Teller (University of Manitoba) for their reviews of the manuscript. This is ESS Contribution Number 20080709.REFERENCES
Allen, J.R.L., 1985, Principles of Physical Sedimentology: George Allen &Unwin, London, 272 p.
Atlas of Canada, 2001, http://atlas.nrcan.gc.ca/sites/english/learningresources/facts/surfareas.html.
Baker, G.C., 1982, Some historical aspects of tidal power, in New Approaches to Tidal Power (conference proceedings): Bedford Institute of Oceanography, Dartmouth, Nova Scotia, 9 p.
Bamber, J.L., Hardy, R.J., and Joughin, I., 2000a, An analysis of balance velocities over the Greenland ice sheet and comparison with synthetic aperture radar interferometry: Journal of Glaciology, v. 46, p. 67-74.
Bamber, J.L., Vaughan, D.J., and Joughin, I., 2000b, Widespread complex flow in the interior of the Antarctic Ice Sheet: Science, v. 287, p. 1248-1250.
Bamber, J.L., Ekholm, S., and Krabill, W.B., 2001, A new, high-resolution digital elevation model of Greenland fully validated with airborne laser altimeter data: Journal of Geophysical Research, v. 106, p. 6733-6745.
Bishop, R., 2008, Tides and the Earth–Moon system, in Observer’s Handbook 2009: Royal Astronomical Society of Canada, p. 183-187.
Blasco, S.M., Bennett, R., Hughes Clarke, J.E., Bartlett, J., and Shearer, J.M., 2005, 3-D multibeam mapping reveals geological processes associated with fluted seabed, pockmarks, mud volcanoes, deep water ice scours and slump feature in the Beaufort Sea–Amundsen Gulf (abstract): Geological Association of Canada–Mineralogical Association of Canada–Canadian Society of Petroleum Geologists–Canadian Society of Soil Science Joint Meeting, Halifax, Nova Scotia, Abstracts, v. 30, p. 13.
Butman, B., and Beardsley, R.C., 1987, Physical oceanography, in Backus, R.H., ed., Georges Bank: Massachusetts Institute of Technology Press, Cambridge, p. 88-98.
Canadian Hydrographic Service, 2003, Bay of Fundy, Inner Portion, Hydrographic Chart 4010, scale 1:200 000.
Commonwealth of Australia, 1999, An Act relating to the protection of the environment and the conservation of bio-diversity, and for related purposes, Act No. 91, [http://www.frli.gov.au/Com-Law/Legislation/ActCompilation1.nsf/0/F9A0A154F06FE8CECA25751600184FB6/$file/EnvProtBioDiv-Cons99Vol1WD02.pdf]
Conway, K.W., Barrie, J.V., and Krautter, M., 2005, Geomorphology of unique reefs on the western Canadian shelf; sponge reefs mapped by multibeam bathymetry: Geo-Marine Letters, v. 25, p. 205-213.
Courtney, R., and Shaw, J., 2000, Multi-beam bathymetry and backscatter imaging of the Canadian continental shelf: Geoscience Canada, v. 27, p. 31-42.
Daborn, G.R., and Dadswell, M.J., 1988, Natural and anthropogenic changes in the Bay of Fundy–Gulf of Maine– Georges Bank system, in El-Sabh, M.I. and Murty, T.S., eds.: Natural and Man-Made Hazards, D. Reidel, Dordrecht, p. 547-560.
Desplanque, C., and Mossman, D.J., 2004, Tides and their seminal impact on the geology, geography, history, and socioeconomics of the Bay of Fundy, eastern Canada: Atlantic Geology, v. 40, p. 1-130.
Dyer, K.R., and Huntley, D.A., 1999, The origin, classification and modelling of sand banks and ridges: Continental Shelf Research, v. 19, p. 1285-1330.
Dyke, A.S., and Prest, V.K., 1987, Late Wisconsinan and Holocene history of the Laurentide ice sheet: Géographie physique et Quaternaire, v. 41, p. 237-263.
Dyke, A.S., Andrews, J.T., Clark, P.U., England, J.H., Miller, G.H., Shaw, J., and Veillette, J.J., 2002, The Laurentide and Innuitian ice sheets during the last glacial maximum: Quaternary Science Reviews, v. 21, p. 9-31.
EPRI (Electric Power Research Institute), 2005, Nova Scotia tidal in-stream energy conversion (TISEC): Survey and characterization of potential project sites, 97 p.
Evans, D.J.A., 2006, Glacial landsystems, in Knight, P.G., ed.: Glacier Science and Environmental Change, Blackwell, Oxford, p. 83-88.
Fader, G.B.J., and Miller, R.O., 1991, The Scots Bay sand wave field, Bay of Fundy: An example of potential environmental enhancement by extraction (abstract): Geological Association of Canada–Mineralogical Association of Canada, Joint Annual Meeting, Toronto, Ontario, Program with Abstracts, v. 16, p. A35.
Fader, G.B.J., King, L.H., and MacLean, B., 1977, Surficial geology of the eastern Gulf of Maine and Bay of Fundy: Canadian Hydrographic Service, Marine Sciences Paper 19; Geological Survey of Canada, Paper 76-16, 23 p. and map.
Fader, G.B., King, L.H., Josenhans, H.W., 1982, Surficial geology of the Laurentian Channel and the western Grand Banks of Newfoundland: Canadian Hydrographic Service, Marine Sciences Paper 21; Geological Survey of Canada, Paper 81-22, 37 p. and map.
Fisheries and Oceans Canada, 2009, http://www.dfo-mpo.gc.ca/oceans/canadasoceans-oceansducanada/marinezones-zonesmarines-eng.htm
Foreign Affairs and International Trade Canada, 2008, http://www.international.gc.ca/continental/limits-continental-limites.aspx?lang=eng&menu_id=20&menu=R
Gehrels, W.R., Belknap, D.F., Pearce, B.R., and Gong, B., 1995, Modeling the contribution of M2 tidal amplification to the Holocene rise of mean water level in the Gulf of Maine and the Bay of Fundy: Marine Geology, v. 124, p. 71-85.
Gunderson, D.R., 1993, Surveys of Fish-eries Resources: John Wiley & Sons, New York, 256 p.
Hetherington, R., Barrie, J.V., Reid, R.G.B., MacLeod, R., Smith, D.J., James, T.S., and Kung, R., 2003, Late Pleistocene coastal paleogeography of the Queen Charlotte Islands, British Columbia, Canada, and its implications for terrestrial biogeography and early postglacial human occupation: Canadian Journal of Earth Sciences, v. 40, p. 1755-1766.
Jordan, G.F., 1962, Large submarine sand waves: Science, v. 136, p. 839-848.
Karsten, R.H., McMillan, J.M., Lickley, M.J., and Haynes, R.D., 2008, Assessment of tidal current energy in the Minas Passage, Bay of Fundy: Proceedings of the Institution of Mechanical Engineers, Part A, Journal of Power and Energy, v. 222, p. 493-507.
King, L.H., and Fader, G.B.J., 1986, Wisconsinan glaciation of the Atlantic continental shelf of southeast Canada: Geological Survey of Canada, Bulletin 363, 72 p.
King, L.H., and Fader, G.B.J., 1989, Late Wisconsinan ice on the Scotian Shelf: Geological Survey of Canada, Open File Report 1972, 15 p.
King, L.H., and McLean, B., 1976, Geology of the Scotian Shelf: Canadian Hydrographic Service Marine Sciences, Paper 7; Geological Survey of Canada, Paper 74-31, 31 p., and map.
King, T., and Sonnichsen, G.V., 2008, A review of recent iceberg scour survey data from the Labrador Shelf: 19th International Association of Hydraulic Engineering and Research International Symposium on Ice, Vancouver, British Columbia, 12 p.
Kostylev, V.E., Todd, B.J., Fader, G.B.J., Courtney, R.C., Cameron, G.D.M., and Pickrill, R.A., 2001, Benthic habitat mapping on the Scotian Shelf based on multibeam bathymetry, surficial geology and seafloor photographs: Marine Ecology Progress Series, v. 219, p. 121-137.
Kostylev, V.E., Courtney, R.C., Robert, G., and Todd, B.J., 2003, Stock evaluation of giant scallop (Placopecten magellanicus) using high-resolution acoustics for seabed mapping: Fisheries Research, v. 60, p. 479-492.
Mapping Services Branch, Natural Resources Canada, 2007, http://maps.nrcan.gc.ca/topo_e.php.
Mayer, L.A., 2006, Frontiers in seafloor mapping and visualization: Marine Geophysical Researches, v. 27, p. 7-17.
Miller, M.C., McCave, I.N., and Komar, P.D., 1977, Threshold of sediment motion under unidirectional currents: Sedimentology, v. 24, p. 507–527.
Parliament of Canada, 1996, An Act respecting the oceans of Canada: Ottawa, [http://laws.justice.gc.ca/en/o-2.4/82235.html]
Pickrill, R.A., and Todd, B.J., 2003, The multiple roles of acoustic mapping in integrated ocean management, Canadian Atlantic continental margin: Ocean and Coastal Management, v. 46, p. 601-614.
Pickrill, R.A., and Kostylev, V.E., 2007, Habitat mapping and national seafloor mapping strategies in Canada, in Todd, B.J and Greene, H.G., eds., Mapping the Seafloor for Habitat Characterization: Geological Association of Canada, Special Publication 47, p. 483-495.
Pickrill, R.A., Piper, D.J.W., Collins, J., Kleiner, A., and Gee, L., 2001, Scotian Slope mapping project: The benefits of an integrated regional high-resolution multibeam survey: Offshore Technology Conference, Houston, Texas, Society of Petroleum Engineers, Paper OTC 12995, 11 p.
Scott, D.B., and Greenberg, D.A., 1983, Relative sea-level rise and tidal development in the Fundy tidal system: Canadian Journal of Earth Sciences, v. 20, p. 1554-1564.
Shaw, J., and Todd, B.J., 2002, Development of mapping standards for marine bathymetry, backscatter, geology and habitat maps: Natural Resources Canada, internal report, 22 p.
Shaw, J., and Potter, D.P., 2008, Surficial geology and sun-illuminated seafloor topography, Bras d’Or Lake, Cape Breton Island, Nova Scotia: Geological Survey of Canada, Map 2115A, scale 1:50 000.
Shaw, J., Gareau, P., and Courtney, R.C., 2002, Paleogeography of Atlantic Canada 13–0 kyr: Quaternary Science Reviews, v. 21, p. 1861-1878.
Shaw., J., Piper, D.J.W., Fader, G.B., King, E.L., Todd, B.J., Bell, T., Batterson, M.J., and Liverman, D.J.E., 2006, A conceptual model of the deglaciation of Atlantic Canada: Quaternary Science Reviews, v. 25, p. 2059-2081.
Shaw, J., Duffy, G., Taylor, R.B., Chassé, J., and Frobel, D., 2008a, Role of a submarine bank in the long-term evolution of the northeast coast of Prince Edward Island, Canada: Journal of Coastal Research, v. 24, p. 1249-1259.
Shaw, J., Fader, G.B.J., and Taylor, R.B., 2008b, Submerged early Holocene coastal and terrestrial landforms on the inner shelves of Atlantic Canada: Quaternary International, doi:10.1016/j.quaint.2008.07.017.
Shaw, J., Todd, B.J., Brushett, D., Parrott, D.R., and Bell, T., 2009, Late Wisconsinan glacial landsystems on Atlantic Canadian shelves: New evidence from multibeam and single-beam sonar data: Boreas, v. 38, p. 146-159.
Shepard, F.P., Trefethen, J.M., and Cohee, G.W., 1934, Origin of Georges Bank: Geological Society of America Bulletin, v. 45, p. 281-302.
Smith, S.J., Costello, G., Kostylev, V.E., Lundy, M.J., and Todd, B.J., 2005, Application of multibeam bathymetry and surficial geology to the spatial management of scallops (Placopecten magellanicus) in southwest Nova Scotia: Journal of Shellfish Research, v. 25, p. 308.
Smith, S.J., Lundy, M.J., Todd, B.J., Kostylev, V.E., and Costello, G., 2006, Incorporating bottom type information into survey estimates of sea scallop (Placopecten magellanicus) abundance: International Council for the Exploration of the Sea, Annual Science Conference, Copenhagen, ICES CM 2006/I:01, 20 p.
Smith, S.J., Black, J., Todd, B.J., Kostylev, V.E., and Lundy, M.J., 2008, The impact of commercial fishing on the determination of habitat associations of sea scallops: International Council for the Exploration of the Sea, Annual Science Conference, Copenhagen, ICES CM 2008/G:08, 22 p.
Thompson, S.K., 2002, Sampling: John Wiley & Sons, New York, 343 p.
Thouzeau, G., Robert, G., and Smith, S.J., 1991, Spatial variability in distribution and growth of juvenile and adult sea scallops Placopecten magellanicus (Gmelin) on eastern Georges Bank (Northwest Atlantic): Marine Ecology Progress Series, v. 74, p. 205-218.
Todd, B.J., 2009, Surficial geology and sun-illuminated seafloor topography, German Bank area, Scotian Shelf: Geological Survey of Canada, Map 2148A, scale 1:50 000.
Todd, B.J., Valentine, P.C., Longva, O., and Shaw, J., 2007, Glacial landforms on German Bank, Scotian Shelf: Evidence for Late Wisconsinan ice-sheet dynamics and implications for the formation of De Geer moraines: Boreas, v. 36, p. 148-169.
Tremblay, M.J., Smith, S.J., Clement, P.M., and Todd, B.J., 2008, The potential of underwater imaging to evaluate lobster (Homarus americanus) density on different habitats: International Council for the Exploration of the Sea, Annual Science Conference, Copenhagen, ICES CM 2008/G:04, 27 p.
United States, 1996, Magnuson–Stevens Fishery Conservation and Management Act, amended 1996, Public Law 94-265, April 13, 1976, 90 Stat. 331 (16 U.S.C. 1801 et seq.) as amended by the Magnuson–Stevens Fishery Conservation and Management Reauthorization Act (P.L. 109-479), January 12, 2007: [http://www.nmfs.noaa.gov/msa2005/docs/MSA_amended_msa%20_20070112_FINAL.pdf].
Whitmeyer, S.J., and FitzGerald, D.M., 2008, Episodic dynamics of a sand wave field: Marine Geology, v. 252, p. 24-37.
Wille, P.C., 2005, Sound Images of the Ocean in Research and Monitoring: Springer, Berlin, 471 p.