Articles
1871 Productivity Differentials and the Decline of the Maritime Manufacturing Sector
This article examines manufacturing productivity differences between urban centres in the Maritimes and Central Canada. The results indicate that productivity in the Maritime cities exceeded that of its Central Canadian counterparts. The article reconciles this finding with earlier research by demonstrating that the relative productivity of the Maritimes at the provincial level is lowered by the higher proportion of rural establishments with low productivity in the region. The article concludes that lower productivity in the rural regions of the Maritimes may have contributed to the decline of the Maritime manufacturing sector.
Cet article se penche sur les écarts de productivité manufacturière entre les centres urbains des Maritimes et ceux du centre du Canada. Les résultats indiquent que la productivité manufacturière était plus élevée dans les villes des Maritimes que dans leurs homologues du centre du pays. Cet article concilie ce constat avec les résultats de recherches antérieures en démontrant que la proportion plus élevée d’établissements ruraux à faible productivité dans la région vient réduire la productivité relative des Maritimes à l’échelle provinciale. L’article conclut que la plus faible productivité des régions rurales des Maritimes a peut-être contribué au déclin du secteur manufacturier dans la région.
1 ACCORDING TO ENDOGENOUS GROWTH THEORY, initial conditions matter. The structure of an economy, both from industrial and regional perspectives, cannot be fully understood independent of its beginnings. The latter half of the 19th century marks the beginning of the industrial era in the Canadian economy. At the onset of this period, the Maritime Provinces represented an important manufacturing region in Canada. Norrie, Owram, and Emery note that manufacturing output per capita in New Brunswick was comparable to Ontario and Quebec in 1871. Between 1896 and the beginning of the First World War, Canadian real GNP grew at an impressive rate of 6.48 per cent annually. The Canadian manufacturing sector expanded in step with national output by maintaining its share of roughly 22 per cent of Canadian GDP over this boom period.1 Growth in Maritime manufacturing output, however, failed to keep pace with the rest of Canada, and the Maritime manufacturing sector fell into a period of decline that persisted throughout the 20th century. In 1880 the Maritimes accounted for 11 per cent of the manufactured goods produced in the Canadian economy; this fell to 6 per cent by 1910, and 4 per cent by 1939.2 At precisely the point in history when the Canadian economy made the leap to modern economic growth, the Maritime manufacturing sector faltered.
2 This article examines the total factor productivity (TFP) performance of the Canadian manufacturing sector in 1871, and sheds light on the initial factors that led to the decline of the Maritime manufacturing sector. Special emphasis is placed on the differences in productivity between rural areas and urban centres in the Maritimes, and how these differences may have affected manufacturing growth in the region. First, I estimate the productivity performance of the manufacturing sector in New Brunswick, Nova Scotia, and Quebec relative to Ontario. The subsequent section uses regression analysis to isolate the initial conditions that had the greatest effect on productivity performance during this era. The third part of the article links these initial conditions to data from the 1891 census with the objective of determining the factors that led to the decline of the Maritime manufacturing sector.
3 Three sources of data are used: the census manuscripts from the 1871 enumeration of Canadian manufacturing establishments, the 1871 Census of Canada, and the 1891 Census of Canada. The choice of 1871 captures the profile of the Maritime manufacturing sector during the early stages of industrialization in the region. The analysis pre-dates several important events that influenced the sector, including the completion of the Intercolonial Railway (ICR) in 1876 and the implementation of the National Policy in 1879. This provides a baseline analysis of the region’s competitive position relative to Central Canada at the beginning of a transitional period. In making comparisons between Central Canada and the Maritimes during this era, it is important to acknowledge that the timing of industrialization did not occur simultaneously in both regions. For example, railway expansion projects were an important force driving industrialization and occurred much earlier in Central Canada. In 1857 the Province of Canada had 2,900 kilometres of rail, while the Maritimes had only 600 kilometres by 1867.3 The timing of industrialization in Western Canada is another important factor that affected the geographic distribution of Canadian manufacturing output during the late 19th and early 20th century. Inwood and Chamard note that growth in the Western Canadian manufacturing sector outpaced Ontario, Quebec, and the Maritime Provinces during the first 50 years after Confederation.4 Therefore, the decline of the Maritime Provinces’ share of national manufacturing output is partially explained by the rapid expansion of the manufacturing sector in Western Canada.
4 The existing literature on regional productivity and the origins of inequality in Canadian manufacturing output during this era has established that the Maritime provinces were at best equally productive as, and in several sub-sectors less productive than, Ontario in manufacturing.5 When the focus of the analysis is shifted from the provincial to the city level, however, the results suggest a more nuanced conclusion. In comparing Saint John and Halifax with similar urban centres in Quebec and Ontario, I find that the productivity performance of the Maritime cities exceeds that of its Central Canadian counterparts. At the same time, the Maritime region is found to have a highly disproportionate number of manufacturing establishments located in rural regions as compared with Ontario and Quebec. Inwood and Keay have established that rural firms were less productive than urban firms in the Canadian manufacturing sector in 1871.6 Building on their findings, I present evidence that illustrates that the overall productivity performance of the Maritime Provinces is significantly lowered by the high percentage of rural establishments in the region. Focusing on Saint John and Halifax, the evidence reveals that growth in manufacturing between 1871 and 1891 was correlated with each city’s initial productivity level as well as the overall productivity level in each of the respective provinces. During this era, the industrial landscape in Ontario and Quebec featured dense clusters of manufacturing establishments that extended from the urban centres into the countryside. By contrast, in the Maritimes there was a lack of integration between the process of industrialization in Saint John and Halifax and the region’s rural communities. I argue that in the late 19th century the higher-density and better-integrated markets of Central Canada were rewarded at the expense of the manufacturing sector in the Maritimes. I conclude that the higher fraction and lower productivity of rural manufacturers in the Maritimes may partially explain the long downturn in the region’s share of Canadian manufacturing output.
5 Inwood examines early empirical evidence in order to assess the proposed arguments explaining why the Maritime region failed to keep pace with the process of industrialization that occurred in Central Canada during the late 19th and early 20th centuries. He uses the 1871 Census data and an index number approach to calculate TFP ratios for Quebec, New Brunswick, and Nova Scotia relative to Ontario. The results indicate that in 1870, on average, Ontario-based manufacturers were more productive than each of their provincial counterparts. New Brunswick- based manufacturers were 12 per cent less productive than Ontario-based manufacturers, while Quebec-based manufacturers were 14 per cent less productive. Nova Scotian manufacturers were the least productive, with a TFP level 22 per cent below that of Ontario.7
6 The manuscripts from the 1871 enumeration of Canadian manufacturing establishments were rendered into machine-readable form by Inwood.8 Using these data, Gerriets and Inwood re-examined the 1871 inter-provincial productivity differentials between Ontario, Quebec, New Brunswick, and Nova Scotia. In order to facilitate meaningful comparisons, the authors constructed provincial measures of productivity that are specific to firms of comparable size and industrial structure. They found capital productivity to be lower in Quebec and Nova Scotia and higher in New Brunswick relative to Ontario. Labour productivity was roughly equivalent in Quebec and Nova Scotia and lower in New Brunswick relative to Ontario. Gerriets and Inwood conclude “productivity everywhere was roughly comparable to that of Ontario, providing the comparisons are drawn between the same size of enterprise in the same industries.”9
7 Inwood and Keay note that Canadian manufacturing establishments tended to be proto-industrial in that they were smaller and used less mechanical power and capital as compared with manufacturing firms of the era in the United States. Interestingly, the authors find that Canadian firms’ technological choices were well suited to their environment in that the manufacturing sector was technically efficient despite their limited use of mechanical power and capital. While the proto-industrial nature of these firms apparently did not constrain growth in Canadian manufacturing, an important factor affecting the productivity of Canadian manufacturing firms was whether they were located in an urban or rural area. In 17 of Canada’s 20 largest manufacturing industries, productivity was higher in urban sub-districts, with the average urban establishments being 17 per cent more productive than rural firms.10
8 This article uses manuscript data from the 1871 enumeration of Canadian manufacturing establishments, sourced from Inwood and Keay.11 The dataset includes only the 20 Canadian manufacturing industries having the greatest number of establishments in 1871. In total, the sample with which I begin includes observations on 27,111 establishments (henceforth referred to as the “complete sample”). Inwood notes that after the reconstitution of multi-process establishments, the total number of establishments listed in the 1871 manuscripts is 40,761.12 Thus the 27,111 establishments in the complete sample represent approximately two- thirds of the total number of manufacturing establishments in Inwood’s reconstituted version of the 1871 manuscripts.
9 Inwood notes that the 1871 enumerators were instructed to encompass a broad spectrum of establishments, ranging from small, farm-based operations to large factories.13 Clearly there are fundamental differences between these two extremes that require, for the purposes of this study, a narrowing of the definition of what it meant to be a Canadian manufacturing establishment in 1871. The objective of this research is to identify the initial conditions that led to the emergence of regional differentials in the Canadian manufacturing sector. To achieve this objective, the sub-sample of establishments that had the greatest potential for growth in the late 19th century were isolated. As previously noted, Inwood and Keay’s paper finds a large productivity differential between urban and rural Canadian manufacturers during this era.14 More generally, the research of Robert Allen has established links between the process of urbanization and early industrialization.15 It is therefore logical to focus my analysis on the sub-set of urban manufacturing establishments in 1871. For the purposes of this study, all establishments located in sub-districts with a population density greater than 1,000 persons per square mile are defined as urban manufacturing establishments. This density level is referred to as the preferred population density threshold. Establishments residing in sub-districts with population densities below this threshold are defined as rural establishments. Applying the preferred population density threshold greatly reduces my sample size to 3,849 urban establishments. A further reduction of my sample occurs as a result of dropping missing observations and suspected outliers, leaving a total of 3,557 manufacturing establishments available for use in the analysis.16 The differences between urban, rural, and provincial productivity represent a central theme in this article. While the focus of my analysis concerns manufacturing productivity and growth in the urban centres, I also explore these issues in a rural context and at the provincial level. To do so, I periodically revisit the complete sample to calculate estimates that contrast the differences among urban, rural, and provincial productivity.
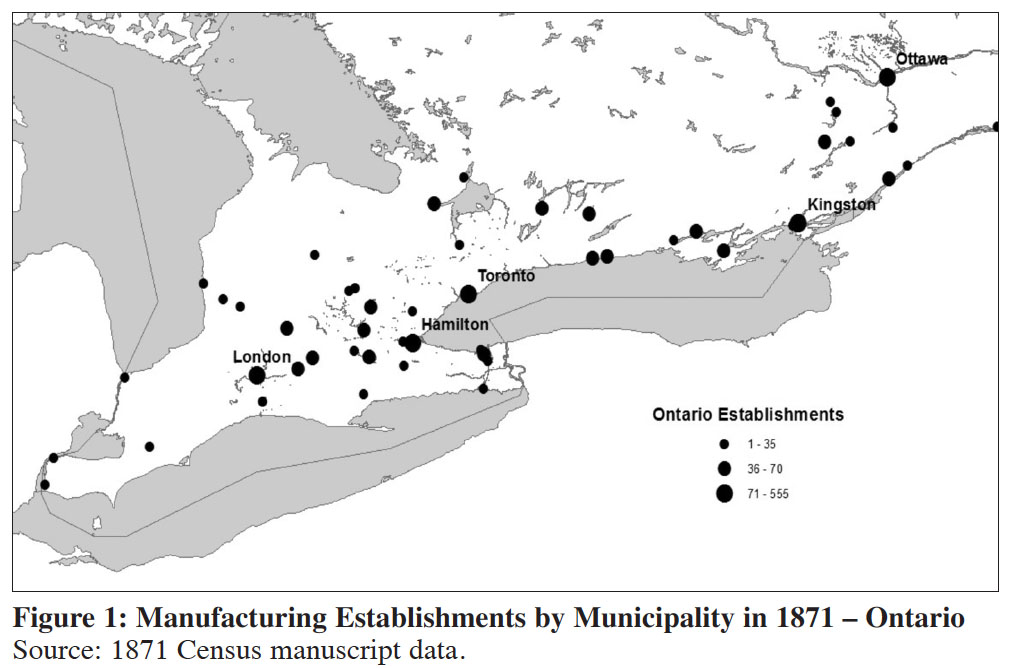
10 Geographically, the 3,557 establishments in the sample reside in 72 different census districts, 147 different sub-districts, and 82 different municipalities. Regional maps of the 82 municipalities are provided in figures 1-3. The maps use graduated dots to distinguish municipalities that have many manufacturing establishments from those municipalities with few. Those municipalities having greater than 70 manufacturing establishments are labeled by name. The sub-district population density threshold results in a sample of 52 Ontario municipalities, 28 Quebec municipalities, and only two Maritime municipalities (Saint John and Halifax).17 The median sub-district population density for the sample is 3,359 people per square mile, and 91.73 per cent of the establishments were in sub-districts having a population greater than 1,000 inhabitants. Thus the sample can be accurately characterized to feature predominantly urban-based manufacturing establishments.
11 A limitation of setting the preferred sub-district population density threshold at 1,000 persons per square mile is that several secondary towns in the Maritime region are omitted from the analysis. Acheson notes that the principal Maritime manufacturing centres in 1880-1890 included Halifax, Dartmouth, Saint John, New Glasgow, Saint Stephen, Moncton, Fredericton/Marysville, Yarmouth, and Amherst.18 All but two of these municipalities are included in the sample when the population density threshold is reduced to 50 persons per square mile. The notable exceptions are the railroad centres of Moncton and Amherst, which experienced a boom in their industrial development with the arrival of the ICR in 1876.19 Unfortunately, lowering the population density threshold to 50 persons per square mile also results in the inclusion of many small villages that would not be considered urban by any definition. It is reasonable to assume that the production technologies used in these small villages differed considerably from those used in Canadian urban centres in 1871. This is problematic from a methodological standpoint as the TFP calculations used in this paper rely on the assumption that establishments used a common technology. Thus while the number of Maritime municipalities can be increased by reducing the population density threshold, doing so compromises the validity of the TFP calculations and interprovincial comparisons. I therefore proceed under the preferred population density threshold of 1,000 persons per square mile.
 Display large image of Figure 1
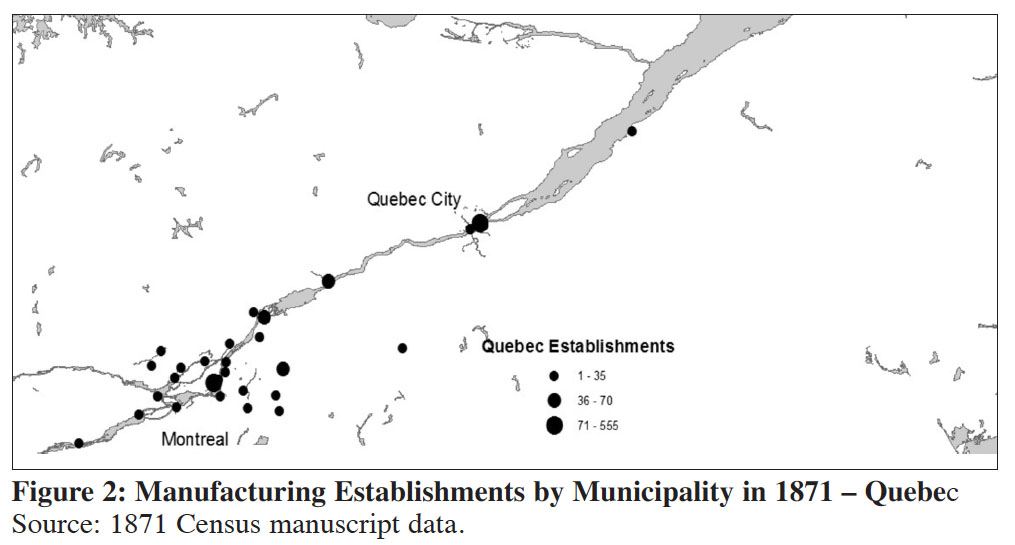 Display large image of Figure 2
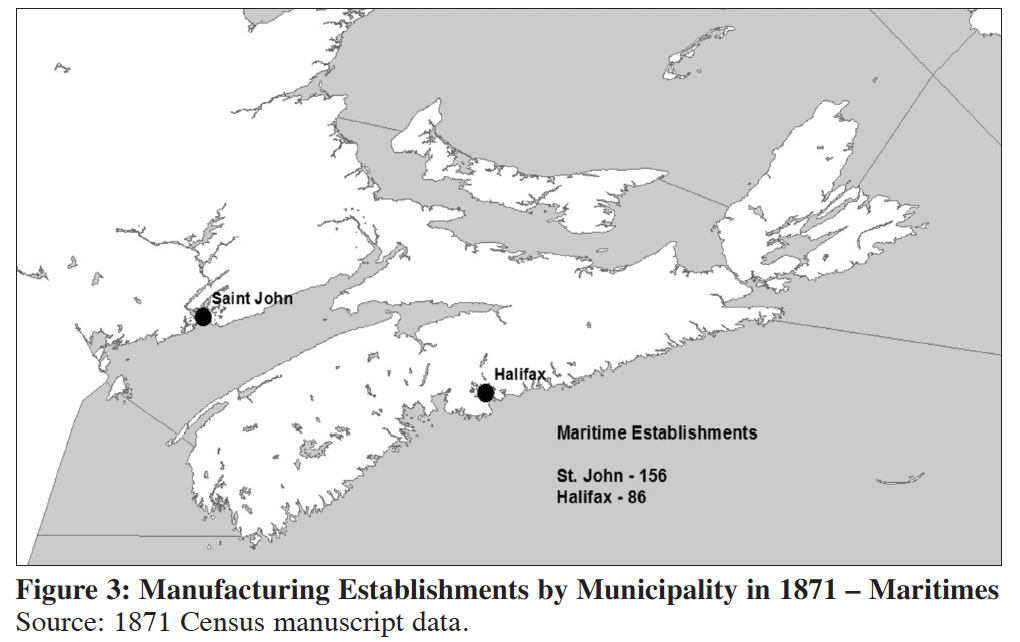 Display large image of Figure 3
12 Inwood has commented on the fact that the percentage of the population living in rural areas was much larger for the Maritimes as compared with Ontario and Quebec. He notes “only 8 per cent of Maritimers lived in census districts with a population density exceeding 25 persons per square mile in 1851, against 53 per cent in Quebec and 75 per cent in Ontario.” This trend continued in the late 19th century, with only 20 per cent of Maritimers living in urban areas in 1891 as compared with 29 per cent in Quebec and 35 per cent in Ontario.20 The proportion of manufacturing establishments residing in rural areas was also much higher in the Maritimes as compared with Ontario and Quebec. In 1871, the percentage of industrial establishments residing in sub-districts with population densities less than 25 persons per square mile was 6 per cent in Ontario, 19 per cent in Quebec, 62 per cent in New Brunswick, and 48 per cent in Nova Scotia.21
13 TFP is defined as the portion of output that is unexplained by the quantity of inputs used in production.22 A common, albeit narrow, interpretation is to associate TFP with the level of physical technology that is employed by a firm. Inwood and Keay note that a more complete interpretation of TFP includes the contribution of factors such as internal and external scale effects, input quality, and firm and market structure. TFP is commonly used as a proxy for international competitiveness, technical efficiency, and profitability as it measures proficiency in converting inputs into outputs.23
14 There exists a wide range of methodological techniques for calculating TFP growth rates and levels. I use a Tornqvist index number approach to calculate establishment-specific TFP relative to a sector-specific national average TFP level. There are two reasons that I have chosen to use the Tornqvist approach over other TFP measurement techniques. From a theoretical perspective, the Tornqvist approach requires that the sector-specific production functions be of the translog form. The translog production function is flexible in the sense that commonly referenced production functions, such as constant elasticity of substitution (CES) and Cobb-Douglas, are simply special cases of the translog production function.24 A second advantage of the Tornqvist approach is that all of the data required to perform the TFP calculation is available in the 1871 Census manuscripts.
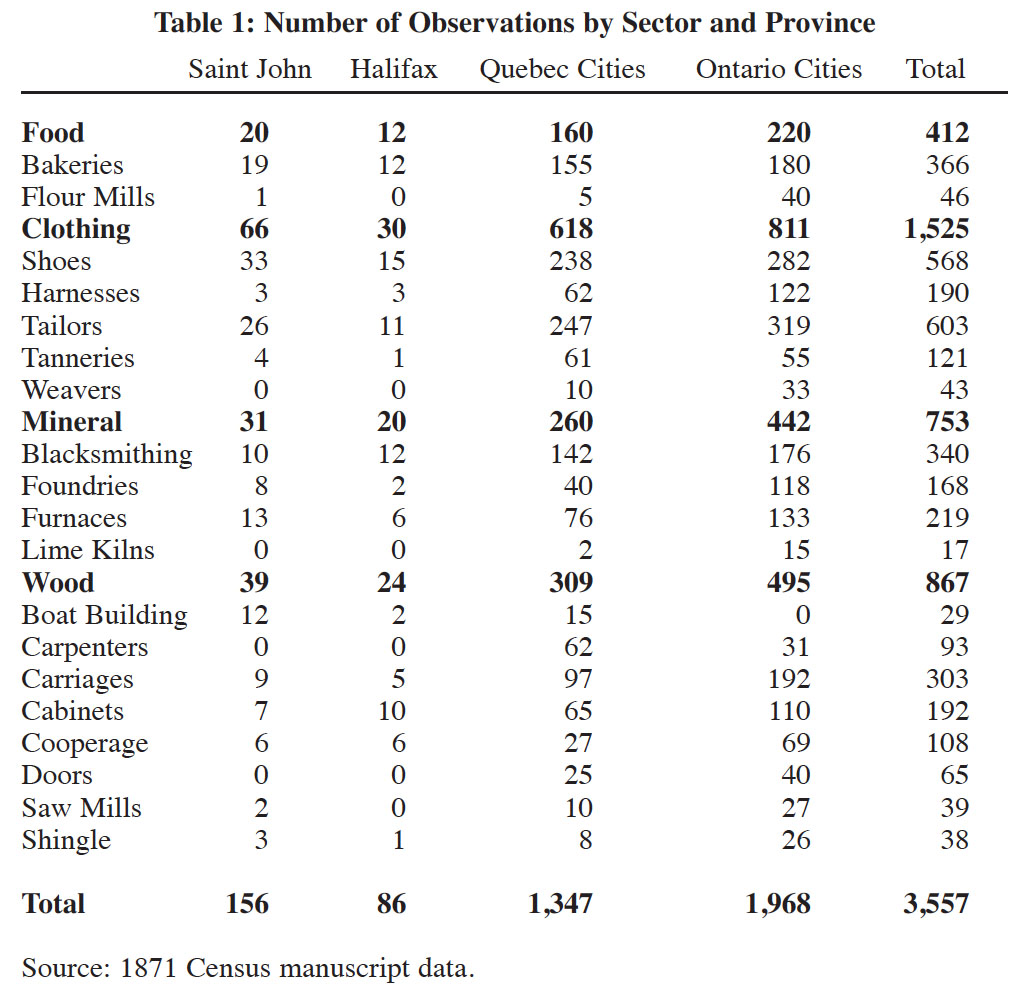
15 The TFP level of each of the 3,557 establishments in the sample is calculated from the census manuscript data. Each firm’s TFP level is measured relative to the sub-sector specific national average TFP level. I have grouped 19 of the 20 industries in the sample into 4 manufacturing sub-sectors: food, clothing, mineral, and wood.25 The number of observations by industry, sector, and province are listed in Table 1, which illustrates several important interprovincial differences in the industrial structure of Canadian manufacturing in urban centres. Saint John had a larger fraction of boatbuilding establishments than the urban centres in Quebec and Ontario. Acheson has written on the importance of shipbuilding to New Brunswick’s economy, noting that the industry accounted for more than one-third of New Brunswick exports at Confederation.26 The manufacturing sector in Halifax was more diverse, although according to McCann this was detrimental to the pace of industrialization in the city. He argues that Halifax did not have a cost-effective means of sourcing staple resources from its hinterland and this prevented specialization in the city. The urban centres in Quebec had a larger fraction of firms in the clothing sector than did the other provinces. McCann notes that competition from the Montreal cotton textile industry eventually led to the takeover and closure of Maritime manufacturers in the early 20th century.27
 Display large image of Table 1
16 Grouping industries into sectors is not ideal from the standpoint of the TFP calculation. By doing so I am implicitly assuming that all industries within a sector employed the same production technology, and also that the census manuscript values for inputs and outputs are comparable across industries within a sector. As an alternative, I could have made the TFP calculations industry-specific; however, this would have resulted in extremely small samples for calculating mean industry TFP levels in the Maritime cities (see industry totals in Table 1). As this study involves a comparative analysis of regional productivity levels, it is desirable to have as large a sample as possible from each province. Therefore, I use sector-specific TFP calculations, recognizing the shortcomings of grouping industries into sub-sectors.
17 The Tornqvist TFP calculation takes the following form:
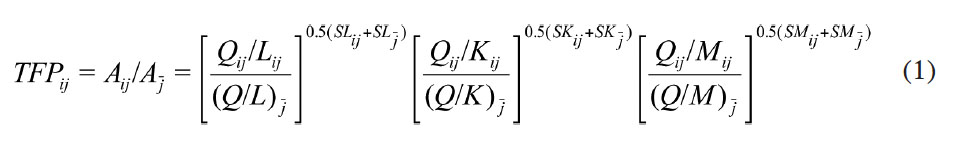
Where:
18 In specifying the variables for the TFP calculation, I followed the preferred method that was proposed by Inwood and Keay for working with the 1871 Census manuscript data.28 Specifically, I use the following variable specifications:
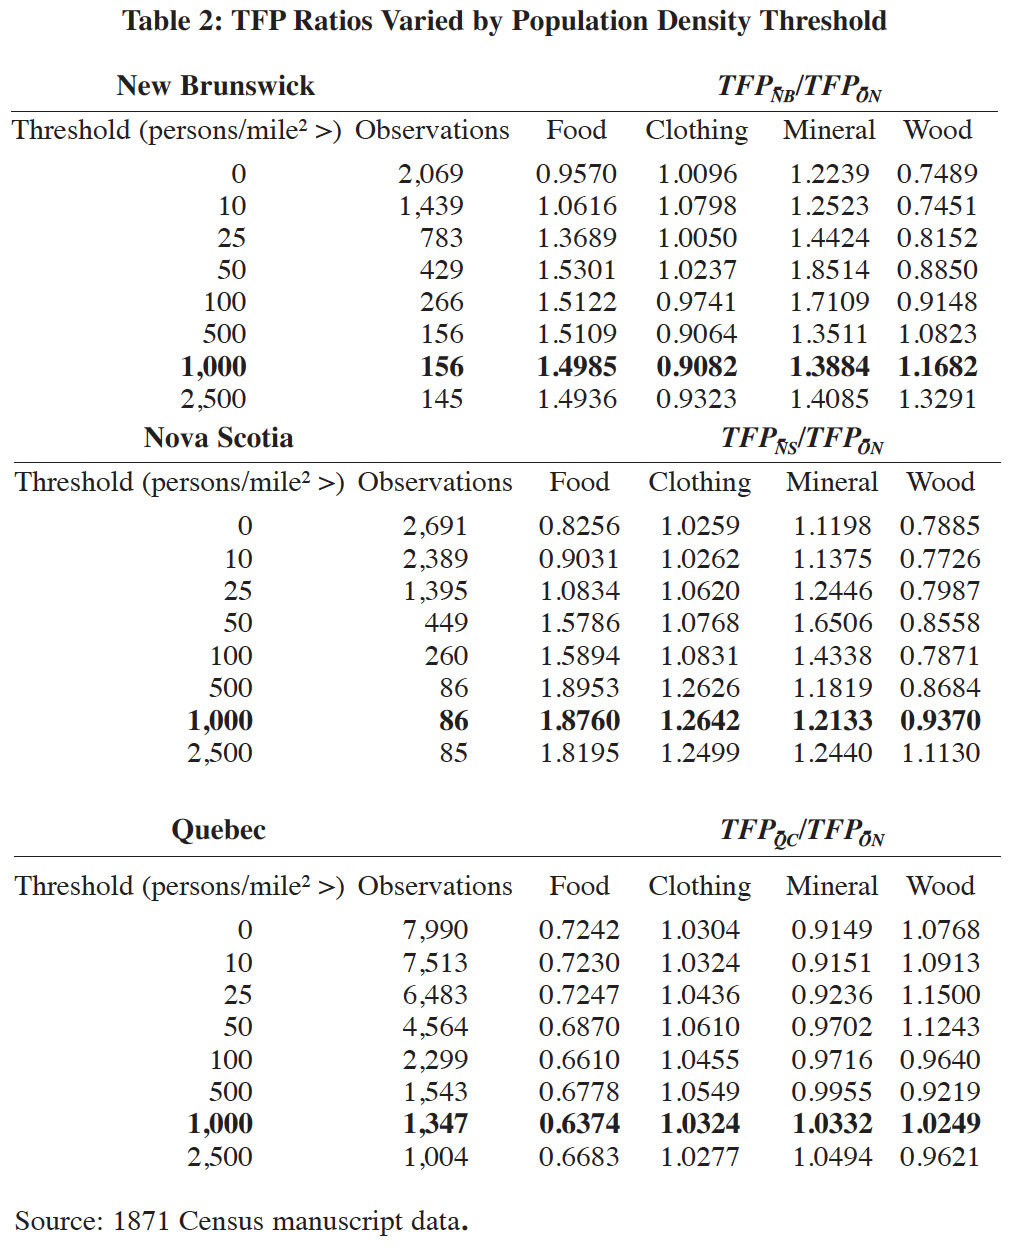
19 Having calculated the TFP level for each establishment in my sample, I next calculated the average TFP level in each province for each sector, which I denote as TFP-prov . Table 2 presents the ratio of the average TFP level in each province relative to that of Ontario for each sector. The TFP ratios are presented for a range of population density thresholds ranging from zero (the complete sample), to 2,500 persons per square mile. The values for my preferred threshold ( > 1000) are in bold. Recall that at the preferred threshold the only two Maritime municipalities in my sample are Saint John and Halifax.
20 Analyzing the results in Table 2 at the preferred population density threshold, the evidence suggests that productivity levels in the Maritime cities were greater than in the urban centres of Ontario. Relative to Ontario, the mean TFP levels in Saint John are higher in the food, mineral, and wood sectors while being lower in the clothing sector. For each sector I conducted a difference-in-means test to determine if the mean level of TFP in Saint John is statistically different from that of Ontario. At the 5 per cent level of significance, I found the difference to be statistically significant for the food and mineral sectors.32 Thus, the average TFP level was significantly higher in Saint John in two of the four sectors (50 per cent higher for food, and 38 per cent higher for mineral), and not statistically different from Ontario in the remaining two sectors.
21 Continuing the analysis of Table 2 at the preferred population density threshold, the mean TFP levels in Halifax are higher in the food, clothing, and mineral sectors, and lower in the wood sector. I again conducted a difference-in-means test for each sector to determine if the mean level of TFP in Halifax is statistically different than the mean level of TFP in Ontario. At the 5 per cent level of significance, I found the difference to be statistically significant for the food and clothing sectors.33 As with Saint John, the mean TFP level was significantly higher in Halifax in two of four sectors (88 per cent for food and 26 per cent for clothing) while not being statistically different from Ontario in the remaining two sectors.
 Display large image of Table 2
22 Finally, for Quebec the mean TFP level is lower in food and marginally higher in the remaining three sectors. The difference-in-means tests indicate that food is the only sector where the mean level of TFP in Quebec is statistically different from Ontario at the 5 per cent level.34
23 As previously discussed, industrialization was occurring in several towns in the Maritimes apart from Saint John and Halifax in 1871. When the population density threshold is reduced to 50 persons per square mile, the Maritime sample expands to include establishments located in Halifax, Dartmouth, Saint John, New Glasgow, Saint Stephen, Moncton, Fredericton, Yarmouth, and Amherst. The conclusions drawn from Table 2 at this lower threshold are similar to the comparisons that have been discussed for the preferred threshold. New Brunswick has higher average productivity in the food and minerals sector, and lower average productivity in the wood sector than Ontario.35 Nova Scotia has higher average productivity in the food, clothing, and mineral sector, and lower average productivity in the wood sector.36 Therefore, extending the urban sample to also include small towns does not alter the conclusion that the productivity performance of New Brunswick and Nova Scotia was high relative to Ontario.
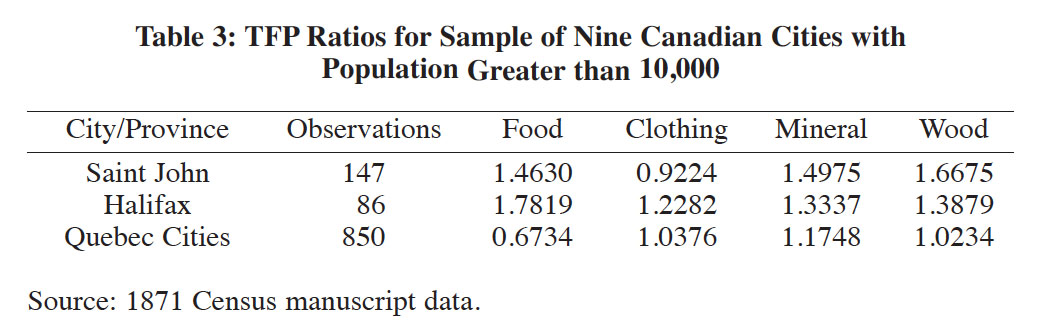
24 The interprovincial comparisons at the preferred threshold may be sensitive to the fact that Halifax and Saint John were the 4th and 5th largest cities in Canada in 1871, with populations of 29,582 and 28,805 respectively. By contrast, the majority of the Ontario municipalities in the urban sample had populations of less than 5,000. It is important to question whether the strong productivity performance of the Maritime cities persists when the comparison is made between urban centres of similar population. Table 3 reports the provincial TFP ratios with the sample restricted to include only the nine Canadian cities with a population greater than 10,000 in 1871. Relative to Ontario cities, the mean TFP levels in Saint John are higher in the food, mineral, and wood sectors, and lower in the clothing sector. The difference is statistically significant at the 5 per cent level in the food, mineral, and wood sectors. In Halifax, the mean TFP level is higher in all four sectors, and the difference is significant at the 5 per cent level in all sectors. Therefore, Table 3 reinforces the conclusion that the productivity of Maritime urban establishments was high relative to central Canadian urban manufacturers.
 Display large image of Table 3
25 The conclusions drawn from Table 2 and Table 3 differ from Inwood as well as Gerriets and Inwood in that productivity in the Maritimes is higher than in Ontario.37 In comparing these results with the earlier works, of course, it is important to note the differences in the methodology used in each respective study. In particular, Table 2 illustrates that the population density threshold has important consequences for the comparison of productivity in the different regions. Importantly, when the threshold is set to 0 the TFP ratios for Nova Scotia are lower in all four sectors as compared with the preferred threshold while in New Brunswick the TFP ratios are lower in 3 out of 4 sectors (with the clothing sector being the exception).
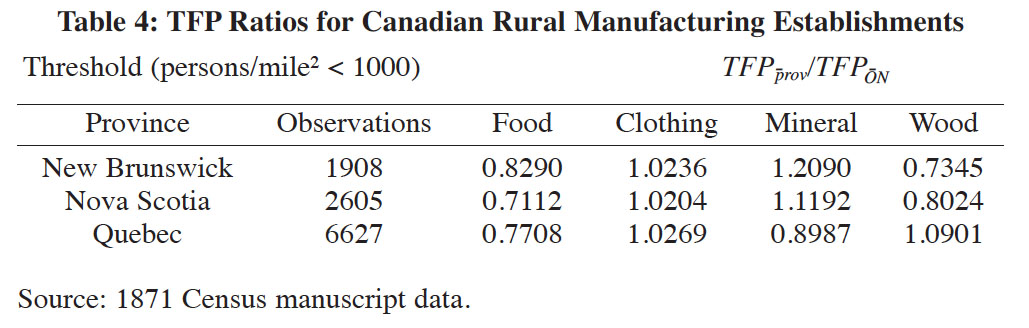
26 There are two plausible explanations as to why lowering the population density threshold forces down the TFP ratios for New Brunswick and Nova Scotia. First, in the 1871 manuscripts the proportion of manufacturing establishments residing in rural areas is much higher in the Maritimes as compared with Ontario and Quebec; this fact, combined with Inwood and Keay’s finding that Canadian rural manufacturing firms were less productive than urban firms,38 helps explain why the productivity performance of the Maritime region falls relative to Ontario when the population density threshold is dropped. A second explanation, however, must also be considered. In addition to there being a greater proportion of rural establishments in the Maritimes, it may also have been the case that these establishments were also less productive relative to rural manufacturing establishments in Ontario. To investigate this possibility I calculated another set of TFP ratios for manufacturing establishments residing in sub-districts with population densities less than 1,000 persons per square mile. These TFP ratios are reported in Table 4. Overall, my results indicate that rural manufacturers in the Maritimes were less productive when compared to rural establishments in Ontario. In both New Brunswick and Nova Scotia the average TFP level in the food and wood sectors are found to be lower than Ontario, and the differences are statistically significant at the 1 per cent level. In both provinces the mean TFP level in the mineral sector is found to be higher than in Ontario, and the difference is statistically significant at the 5 per cent level. Finally, in the clothing sector the average TFP level in New Brunswick and Nova Scotia is not statistically different from that of Ontario.
 Display large image of Table 4
27 To summarize, I found the level of manufacturing productivity in Saint John and Halifax in 1871 to be higher than comparable urban centres in Ontario. The strong productivity performance of Maritime urban centres persists when the population density threshold is reduced to include small industry towns in the sample. However, at the provincial level the depiction of productivity in the Maritime region is significantly lower than Ontario because of two factors: first, rural manufacturers in the Maritimes were less productive than rural establishments in Ontario; second, there was a much greater proportion of rural establishments in the Maritimes and rural establishments everywhere in Canada were less productive than urban establishments.
 Display large image of Figure 5
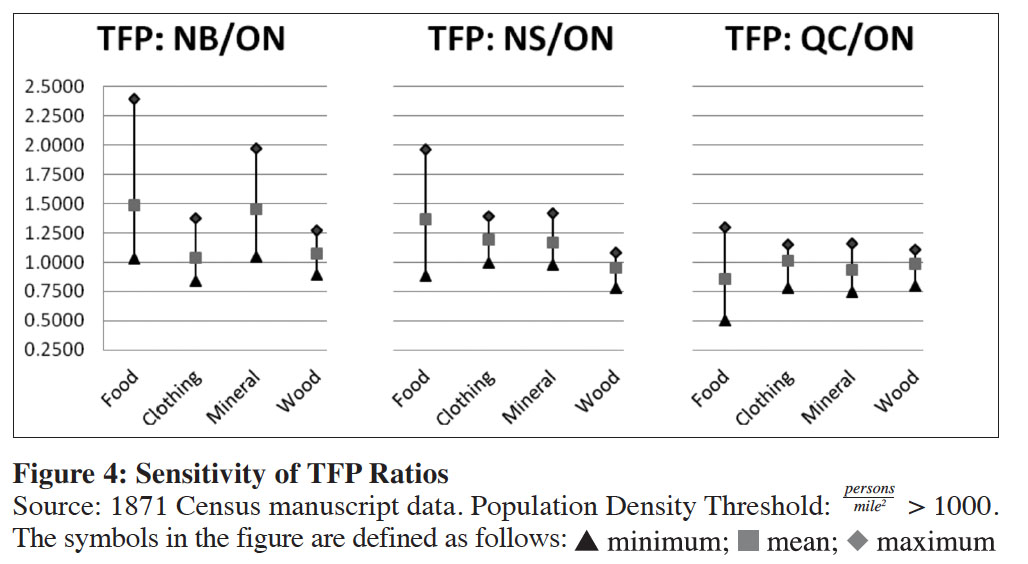
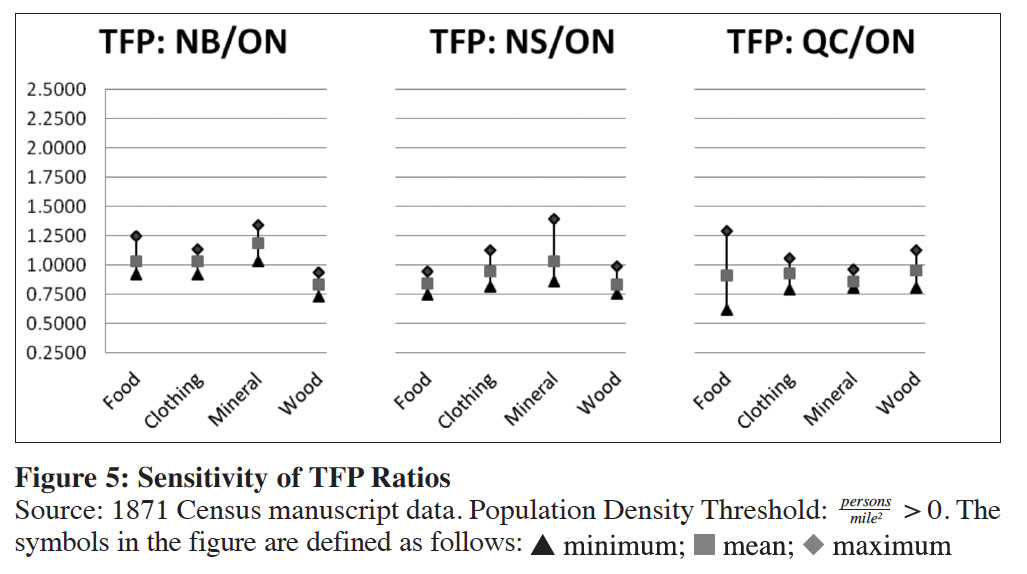
28 Inwood and Keay note that the conclusions drawn from TFP calculations can be highly sensitive to the variable specifications.39 It is important to question the extent to which the qualitative conclusions I have drawn from Table 2 depend on how the variables in the TFP calculation have been specified. To test the robustness of my findings I calculated the TFP ratios using 44 different specifications.40 The results are illustrated in Figure 4 for the preferred population density threshold. Figure 4 illustrates that the TFP levels in the Maritime cities are high relative to Ontario in a majority of the sub-sectors of manufacturing. The mean value of the TFP ratios across the 44 specifications is greater than one in each of the four sectors for Saint John, and greater than one for Halifax in the same 3 sectors as in my preferred specification (food, clothing, and mineral). Figure 5 plots the 44 specifications of the TFP ratios again, although this time with the population density threshold dropped to zero. In both New Brunswick and Nova Scotia the distribution over the 44 different TFP specifications shifts towards zero (the minimum and maximum values are lower in each of the four sectors in both provinces). The mean value of the TFP ratios also drops in both provinces in all sectors with one exception (clothing in New Brunswick), which exactly mirrors the results for my preferred specification. I conclude that my qualitative conclusions are robust to the specification of the TFP calculation.
 Display large image of Figure 6
29 What factors account for the differences in productivity across urban Canadian manufacturing establishments in 1871? I address this question by testing the relationship between TFP performance and the theoretical determinants of productivity using regression analysis. Specifically, my regression model takes the following form:
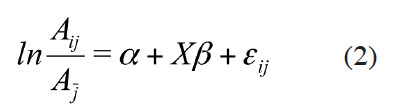
30 In equation (2) i denotes the establishment and j denotes the sub-sector to which the establishment belongs. The dependent variable is the natural logarithm of establishment’s TFP level relative to the national sector specific average, and the matrix X contains the explanatory variables that are theorized to be correlated with productivity performance. The explanatory variables included in X are listed in Table 5 and defined below.
31 The relationship between internal and external scale economies and TFP performance has been an important focus in the literature on regional productivity differentials during the late 19th century.41 Internal scale economies are present whenever an increase in production requires a less-than-proportionate increase in all inputs. Under internal scale economies, larger firms are more productive and the cost savings amassed to the firm from expansion are reflected in a higher level of TFP. For my measure of internal scale I use the natural logarithm of each firm’s gross value of production. External scale economies are present whenever market agglomeration affords firms a productivity advantage. External scale economies may be present in multiple markets simultaneously and therefore I include two explanatory variables to capture this effect: the natural logarithm of the population density in the sub-district where the establishment was located and the natural logarithm of the industrial density. Industrial density is defined as the number of manufacturing firms in the sub-district where the establishment resided, divided by the area of the sub-district in square miles.
32 The staples thesis postulates that development in the peripheral economies of the 19th century (such as Canada, Argentina, and Australia) was characterized by export- driven economic growth in the natural resource sectors of the economy. The diversification of peripheral economies was accomplished through backward linkages (the development of inputs and infrastructure for the natural resource sector) and forward linkages (the development of primary and secondary manufacturing industries for processing the raw materials exploited by the natural resource sector). If internal economies of scale were present in 1871, then the scarcity of natural resources in some regions may have constrained manufacturing growth and productivity. This line of reasoning assumes that the markets for natural resources as inputs in the manufacturing sector were not integrated. Even if we assume that input markets were integrated, there are additional reasons why a region’s resource endowment might be positively correlated with TFP. For example, manufacturers in resource-rich districts may have had access to higher-quality inputs at the source where raw materials were produced. To capture the effect of resource endowment, I use the 1871 Census to develop district specific measures of resource availability for each of the four sectors.42 For the food sector I use the natural logarithm of the aggregate value of annual wheat production in the district (spring and winter wheat combined in bushels), divided by the total area of the district in acres. For the clothing sector I use the natural logarithm of the total quantity of wool produced in the district (in pounds), divided by the total area of the district in acres. For the wood sector I use the natural logarithm of the total quantity of cubic feet of timber (all varieties of hard and soft wood combined), divided by the total area of the district in acres. Constructing the resource endowment variable for the final sector (minerals) is challenging on account of the infrequency of mineral production in urban districts in 1871. To accommodate for the scarcity of mineral extraction in urban districts, I use an indicator variable that takes a value of one if iron ore was produced in the census district or an adjacent district to where the establishment resided.43
33 To model the potential effect of labour quality on productivity, I include in my explanatory variables the natural logarithm of the literacy rate in the district where the establishment was located. The literacy rate is used as a proxy for human capital, which theory suggests should be positively correlated with productivity.44 To measure the effect of market accessibility, I include an indicator variable for rail transportation that takes a value of one if the district was serviced by the Grand Trunk line (or a subsidiary line of the Grand Trunk) in 1871.45 I also include an indicator variable for inanimate power, which takes a value of one if the firm used either water or steam power in its operations.
34 I also include three indicator variables corresponding to the province in which each establishment resided (Ontarian cities is specified as the reference group).46 These variables isolate the institutional and other social and economic factors that were location-specific but are not controlled for by the other explanatory variables. Finally, a set of industry-specific indicator variables is included in each sector-specific model to control for the fixed effects associated with each industry within a sector.47
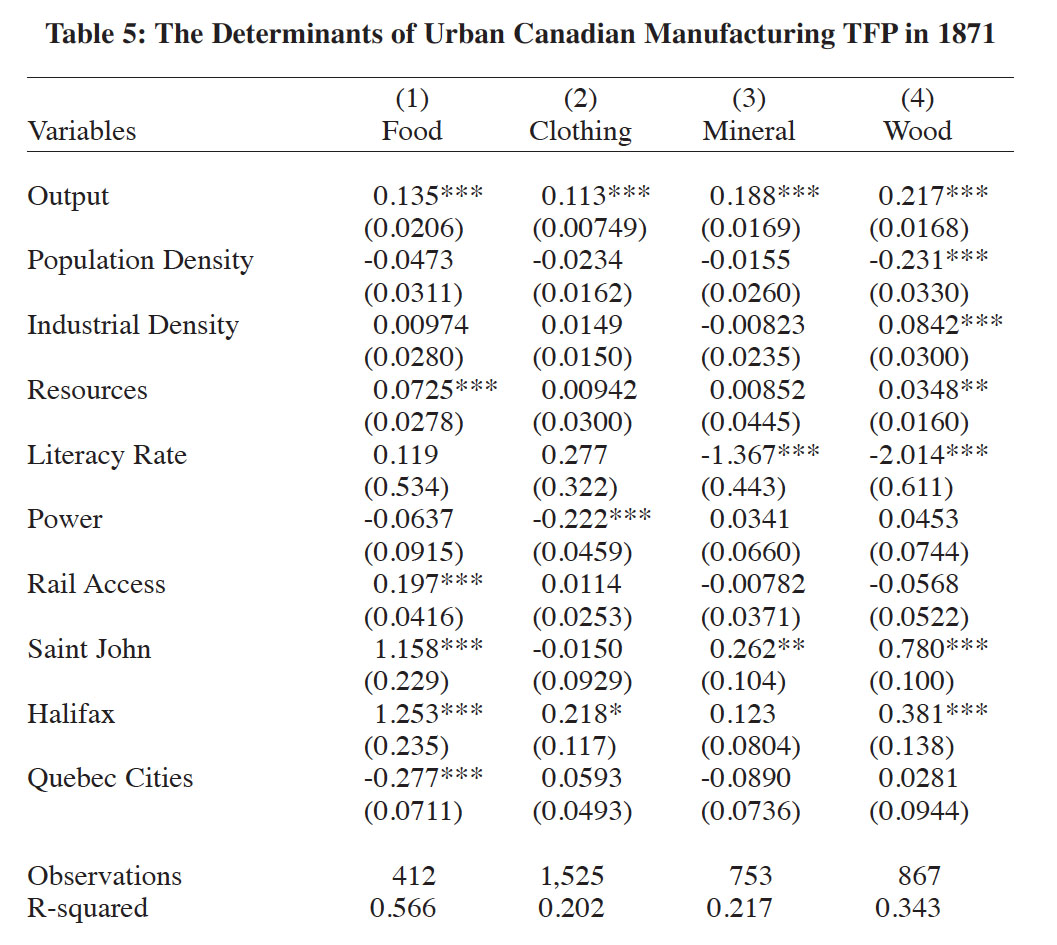
35 Regression equation (2) is estimated by least squares regression using the sub- sample of firms satisfying my preferred population density threshold (persons/mile2 > 1000). The results are provided in Table 5.48 The results indicate that internal economies of scale were present in the Canadian manufacturing sector in 1871. In each of the four sectors the coefficient estimates for the natural logarithm of establishment output is positive and statistically significant at the 1 per cent level. This positive correlation between establishment size and productivity in the Canadian manufacturing sector in 1871 is consistent with the earlier research of Inwood and Keay.49 In three of the four sectors, the coefficients for the natural logarithm of population density and the natural logarithm of industrial density are not statistically significant at the 10 per cent level. This suggests that in the food, clothing, and mineral sectors, external economies of scale were not present in Canada’s urban centres in 1871. Wood manufacturing differs from the other three sectors in that the coefficients on both measures of external scale effects are statistically significant at the 1 per cent level. The coefficient on the natural logarithm of population density is negative, and is positive for the natural logarithm of industrial density. Holding constant the other determinants of TFP, the most productive wood manufacturers were located in sparsely populated sub-districts that featured dense agglomerations of industry. The productivity advantages associated with residing in an industrial cluster may have resulted from knowledge spillovers, and lower search and transaction costs for production inputs that were common across many different manufacturing industries.
 Display large image of Table 5
*** p < 0.01, ** p < 0.05, * p < 0.1
Industry indicator variables and constant are not shown
36 The coefficients for the resource variables are positive and statistically significant in the food and wood sectors at the 1 per cent and 5 per cent levels respectively. If we assume that input markets were not integrated, then the positive correlation may be explained as the result of the resource availability enabling growth and higher productivity levels through increasing returns to scale at the firm level. If, on the other hand, we assume that input markets were integrated, then the positive correlation may reflect a productivity advantage associated with higher quality inputs being available in districts with an abundance of natural resources. It is surprising that the coefficient estimate for the literacy variable is found to be negative and statistically significant at the 1 per cent level in both the mineral and wood sectors. The tradespeople in these sectors (blacksmiths, carpenters, etc.) would have required a highly specialized skill set. A possible explanation for the negative correlation is that the skilled labourers in these sectors may have entered into apprenticeship at a young age at the expense of acquiring basic literacy skills. The negative and statistically significant coefficient on the power variable in the clothing sector is another puzzling result. It may simply be the case that in the clothing sector emerging technologies using inanimate sources of power were slow to overtake traditional methods that relied exclusively on hand power. This logic is consistent with Inwood and Keay, who find that proto-industrial manufacturing establishments achieved efficiencies through making technological choices that were well-suited to their environment.50 The rail access variable is found to be positive and statistically significant at the 1 per cent level in the food sector. This suggests that in at least one sub-sector of manufacturing, having greater access to distant markets through railroad transportation improved productivity.
37 The coefficient estimates for the provincial variables provide further evidence that Saint John and Halifax had a productivity advantage in some sub-sectors of manufacturing over central Canadian urban centres. After controlling for the other determinants of productivity, the results suggest that there were institutions or other factors that increased productivity in the Maritime cities. Saint John enjoyed a productivity advantage in mineral product manufacturing, with the coefficient in that sector being positive and statistically significant at the 5 per cent level. The Maritime cities had a clear productivity advantage in the food and wood sectors, as the coefficients on the Saint John and Halifax variables are positive and statistically significant at the 1 per cent level. The region’s productivity advantage in these sectors may partly be explained by the external orientation and openness of the region to trade opportunities. For example, McCann notes that Halifax was a major importer of West Indian rum, sugar, and molasses.51 In New Brunswick, Acheson comments on the importance of export markets for the shipbuilding industry in the province during the 19th century.52 The region’s ability to leverage its strategic location in trade may have provided economies of scale that were unavailable in other parts of the Canada.
38 There is an extensive body of research that attempts to link the sub-par economic performance of the Maritime Provinces during the 20th century to the initial conditions in the region during the 19th century. Inwood categorizes theorists into two camps on this issue: structuralists versus those who draw upon the staples thesis in their line of reasoning.53 Structuralists argue that the poor economic performance of the Maritime Provinces during the 20th century is ultimately rooted in the loss of political control that occurred as a result of the region’s decision to join Confederation in 1867.54 Proponents of this perspective argue that Canadian public policy has always favoured the development of an industrial heartland in Ontario and Quebec, and that this arose out of political and not economic factors.
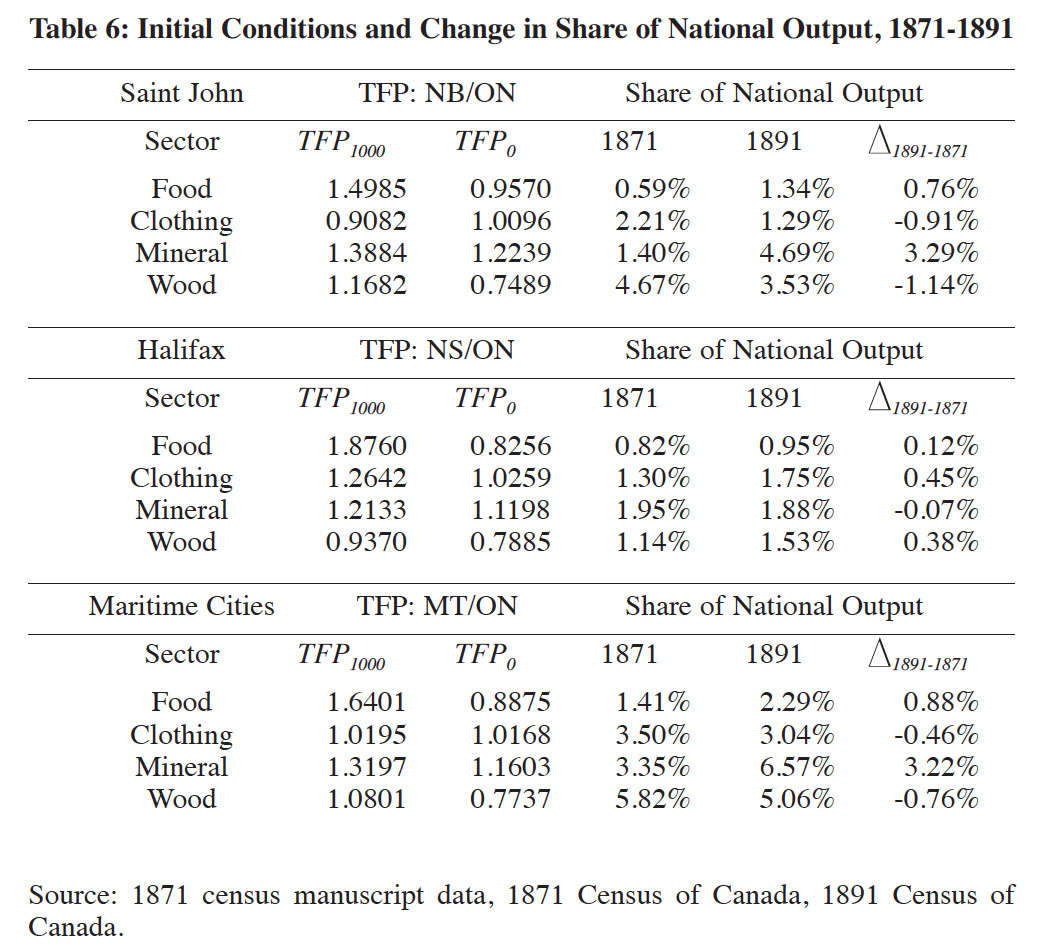
39 It is likely that many factors contributed to the decline of the Maritime manufacturing sector in the late 19th and early 20th centuries. I demonstrate below, in Table 6, that this outcome may be partially explained by the relative productivity of the region’s manufacturers in 1871. The top two tiers of the second column of Table 6 (TFP1000 ) present the initial TFP level in each respective city relative to the average TFP level in Ontario (evaluated at the preferred population density threshold: persons/mile2 > 1000). These values are taken directly from Table 2. In the bottom tier of the second column I have also included a TFP measure of the two cities combined, evaluated as the mean TFP level in the Maritime cities relative to the mean level of TFP in Ontario. The top two tiers of the third column are also taken directly from Table 2, and are the provincial TFP ratios for each respective province calculated from the complete sample (evaluated at the population density threshold: persons/mile2 > 0). The third column is presented to contrast the initial productivity level in the province as whole with the productivity level in the two urban centres. The bottom tier of the second column again provides a TFP measure for the Maritime region combined, evaluated as the mean TFP level in the Maritime region relative that of Ontario (evaluated at the population density threshold:persons/mile2 > 0). The top two tiers of the fourth column calculate each city’s share of national output in each sector, and the bottom tier calculates this value for the two cities combined. The fifth column makes the same calculation as the fourth but uses the 1891 Census of Canada as its source of data. The final column is the difference of the fifth from the fourth column, and thus calculates the percentage point change in each location’s share of national output in each sector. The output measure that is used in the final three columns is the gross value of production, with no inter-regional or inter-temporal price adjustments.55
40 On the strength of high productivity, Saint John’s and Halifax’s share of national output in the food sector increased by 0.76 and 0.12 percentage points respectively between 1871 and 1891. Low productivity in Saint John’s clothing sector resulted in a reduction in its share of national output of 0.91 percentage points. Nova Scotia had considerably higher productivity in the clothing sector as compared with New Brunswick and gained 0.45 percentage points. McCann notes that the growth of Halifax clothing industries during this era was achieved by acquiring inexpensive cloth and labour in local markets.56 Some of the gain in Nova Scotia’s clothing sector output may also have been business that was lost by New Brunswick clothing manufacturers. However, overall the Maritime cities saw a 0.46 percentage point reduction in their share of national output in the clothing sector. Saint John manufacturing enjoyed its greatest gain in the mineral sector, with an impressive 3.29 percentage point increase in its share of national output. Babcock notes that the number of foundries and machine shops in Saint John doubled during the 1880s. He notes further that the growth of these industries was driven primarily by demand from the rapidly expanding North American railway industry.57 Saint John’s gain in the mineral sector may have come at the expense of Nova Scotia manufacturers, who suffered a small reduction of 0.07 percentage points in their share of national output. Once again, one can explain and rationalize this result by the higher initial productivity levels in Saint John relative to Halifax.
 Display large image of Table 6
41 The wood sector presents as an interesting case. The wood sector was very important to both Saint John and Halifax in 1871. In the two cities combined, gross production in the wood sector accounted for 46 per cent of the aggregated manufacturing output of the four sectors. Saint John was clearly the regional leader in the wood sector, with a share of 4.67 per cent of national output and high initial productivity. How then can we explain the 1.14 percentage point drop in the city’s share of national output? The decline of the shipbuilding industry in the late 19th century was undoubtedly an important factor contributing to this outcome.58 However, the wood manufacturers’ inability to rebound from this loss may be explained by the sector’s overall productivity at the provincial level. For the province as a whole, the initial productivity in the New Brunswick wood sector was dismal (25 per cent lower than in Ontario). Despite strong potential in Saint John, it is plausible that a lack of depth in New Brunswick’s wood manufacturing sector beyond Saint John’s city limits failed to support the growth that might have otherwise occurred. The regression results for the wood sector in Table 5 provide additional evidence to support this theory. TFP is often used as a proxy for competitiveness. Adopting this interpretation of TFP, Table 5 suggests that most competitive wood manufacturers were located in sparsely populated sub-districts featuring dense agglomerations of industry, holding constant the other determinants of TFP. However, as I have illustrated, outside of Saint John there was a low level of industrial agglomeration in New Brunswick, and the productivity of rural wood manufacturers was poor. Some of Saint John’s lost wood manufacturing production may have been picked up by Halifax producers, who increased their share of national output by 0.38 percentage points. Overall, however, the 0.76 percentage point drop in the Maritime cities’ share of national wood manufacturing output represented the largest decline across all four sectors. Given that the wood sector was the largest and most important sector, this was a particularly unfortunate result for the Maritime cities.
42 Why might productivity at the regional level have affected the growth of urban manufacturing in the late 19th century? As illustrated in Figures 1 and 2, the industrial landscape in Ontario and Quebec featured dense clusters of manufacturing establishments that extended from the urban centres into the countryside. The industrial centres in the Maritimes, by contrast, were surrounded by vast territories that were sparsely populated by manufacturing establishments, which also had low productivity. Acheson has commented on the disjointed and uneven process of industrialization in the urban and rural regions of the Maritimes. He notes: “The Maritimes had never been a single integrated organic unit; it was, in fact, not a ‘region’ at all, but a number of British communities clustered on the Atlantic fringe.”59 During the late 19th century, the thicker and better-integrated markets of Central Canada no doubt rewarded the manufacturing sector in this region at the expense of the manufacturers in the Maritimes.
43 The stylized facts in Table 6 provided additional evidence that initial productivity at the regional level may help to explain the path of growth that occurred in the Maritime cities. For example, the sector with the greatest gain in its share of national output was not the food sector, despite the fact that this was the sector with the highest initial productivity in both Saint John and Halifax. As with the wood sector, the strong growth potential in the highly productive Maritime cities may have been offset by lower overall productivity in the food sector at the provincial level. The mineral sector provides further evidence that a combination of high productivity at both the urban and provincial level was necessary to achieve growth. The initial productivity ratios at both the urban and provincial levels in New Brunswick and Nova Scotia were well above 1, a strength that translated into the region’s greatest single sector gain in share of national output. Relative to Central Canada, the Maritimes had an abundance of coal and iron in its hinterland. Establishing rural- urban linkages was therefore crucial to the success of the mineral manufacturing sector. The rural regions were important on account of the supporting role that this population provided for the industrial development that occurred in the urban centres. As previously discussed, the regression results in Table 5 indicate that productivity in the wood manufacturing sector was positively correlated with industrial density. This provides evidence of the importance of regional agglomeration effects for productivity in this sector. While the regression results provide no evidence of similar effects in the other three sectors in 1871, the correlation between regional productivity and sector specific growth in the city centres suggests that regional agglomeration effects may have emerged as important determinants of growth during the late 19th century.
44 The evidence presented here indicates that Saint John and Halifax had the productive capacity to compete with Central Canadian manufacturing firms in 1871. There were also a number of secondary towns in each province that featured high productivity and rapid development. In comparison to Central Canada, however, the Maritime manufacturing landscape was disproportionately rural and fragmented. Ontario and Quebec featured large industrial centres supported by an extensive network of densely populated satellite municipalities, each with a well-established industrial sector. During the rapid expansion of the Canadian manufacturing sector in the late 19th century, growth in the Maritime region lagged the rest of Canada. The results of this analysis suggest that the higher proportion and lower productivity of rural manufacturers in the Maritimes may have been an important contributing factor to this outcome.