Land, Income and Regional Inequality:
New Estimates of Provincial Incomes and Growth in Canada, 1871-1891
Kris InwoodUniversity of Guelph
Jim Irwin
Central Michigan University
1 THROUGHOUT THE LATER 20TH CENTURY people living at or near Canada’s east coast have experienced lower wages, incomes and wealth than Canadians living in the centre and west of the country.1 The historical origin and long-term nature of the inter-regional patterns are of some interest. If regional inequality originated in the early 20th or in the 19th century, then the analysis of causation must focus on influences that predate or coincide with the first appearance of inequality and on the structures that have contributed to its persistence. On the other hand, if the long-term record reveals significant fluctuations in regional inequality from decade to decade then attention must focus on the nature and causes of short-term fluctuations. All lines of investigation rely on a clear understanding of the timing of the origin of inequality and the nature of the long-term pattern.
2 The census enumeration undertaken in the spring of 1871 provides the earliest systematic evidence of social patterns on a comparable basis in all parts of Canada, as it then existed.2 This information allows us to estimate income inequality among the former British colonies that joined in the political union of 1867. A first attempt to construct regional incomes in 1871 is reported elsewhere.3 This paper provides a significant revision and extension of the earlier estimate. It summarizes our new evidence and assesses the extent to which it changes our view of early inequality. Details of the estimation are reported in Appendix A. It also considers the implications of this evidence for an understanding of agriculture, an important source of income for families in all parts of Canada.
3 An important body of literature argues that Maritime agriculture expanded during the later 19th century by drawing more and more land into production, but that the land was of diminishing quality which in turn caused a decline in agricultural income per acre and per family.4 The importance of farm families in the regional labour market further implies that their experience may have influenced the experience of non-farm families and contributed to the early emergence of regional disparities. The recent and very useful study by Marilyn Gerriets appears to lend support to this perspective. Gerriets follows other writers in taking the proportion of "good" land used by farmers as an indicator of agricultural "overdevelopment".5 This indicator or utilization ratio is based on a late-20th-century inventory of the total amount of good land available for agriculture.
4 The significance of this debate arises from the importance of agriculture and related puzzles surrounding the emergence of regional disparities. Maritime farmers during the late 19th century did bring into production a growing expanse of land. If the new land was inferior, then income in the region may have grown overall, but it might have done so at the expense of declining productivity and ultimately a decline in the incomes of ordinary people. It is important to assess the persuasiveness of this argument. Our contribution to the debate is the construction of indicators of income earned at select benchmark years, from which we infer in a very approximate way the broad outlines of economic change. We combine our income estimate with the indicators of land utilization developed by Gerriets in order to assess, empirically, the "overdevelopment and decline" interpretation of Maritime agriculture.
5 Both the concept and the technique of measuring national income are well known. Products and services generated by workers are valued at the prices individuals are prepared to pay, after allowing for the value of any raw materials and other inputs used in the production process. Of course, the estimate of "value added" in an activity is only as reliable as the information about prices and quantities on which it is based. And the total of value added in all activities is no more comprehensive than the activities for which information is available. Even with near-perfect information the method provides no more than an approximate indication of income generated by the people of a community or a region or a country.6 Nevertheless, the conventional income estimate provides a useful summary indicator in many situations, as is evident from the continued use of income data in everyday discourse and in scholarly discussion of economic activity.7
6 O.J. Firestone summarizes the development of Canadian income estimates in the first half of the 20th century and extends the evidence back to 1870 (and in less detail to 1850).8 Firestone’s method is to use 19th-century census reports in order to construct income as closely as possible to measures used by the Dominion Bureau of Statistics and later Statistics Canada.9 Alan Green follows the Firestone technique in order to provide provincial detail at select benchmarks between 1890 and 1956, while Marvin McInnis provides a parallel view at decennial intervals 1910-60.10 The most important innovation in recent years has been M.C. Urquhart’s estimate of national income annually from the 1870 census to the Dominion Bureau of Statistics estimates which begin in 1926.11 Kris Inwood and Jim Irwin provide a provincial decomposition of the Urquhart evidence for the main commodity-producing sectors (agriculture, mining, forestry, fishing, manufacturing but not services) in 1870.12
7 The Inwood-Irwin evidence of regional commodity incomes is incomplete insofar as it neglects the service sector and describes income in only one year. Further, the provincial decomposition of Urquhart’s national income is undertaken in a way that does not allow for provincial variation in the prices of commodities originating in the primary sector. The publication in 1993 of the details of Urquhart’s methodology revealed another limitation. Urquhart’s estimate of income from much of agriculture and part of forestry is not based on the evidence of the census. Instead, Urquhart and his co-authors assume that the production of several important commodities was constant on a per capita basis between 1870 and 1904, apart from annual fluctuations derived from net exports.13 The resulting estimate of national income is not consistent with census reports of commodity production.
8 The evidence reported below is based on a modification of the method used by Urquhart (and implicitly in the earlier paper of Inwood and Irwin). We follow the Urquhart method wherever it seems appropriate, and introduce improvements wherever existing evidence had not been used fully by Urquhart or new evidence has become available. An example of new evidence becoming available is the recompilation of industrial census manuscripts for 1871 that shows industrial activity was more extensive than had been indicated by contemporary tabulations of the Census Bureau.14 An example of previously available evidence being used on a different basis is our reliance on the census evidence for agricultural and forest products in place of a presumed per capita production.
9 We report evidence that describes the four founding Canadian provinces in both 1871 and 1891. The latter benchmark may be compared with that of Alan Green’s pre-Urquhart estimate. Following Green’s work our new data include income for the service sector as well as commodity production. To the extent possible we value primary sector commodities using prices that are particular to each province. We do not, however, adjust for different costs of standard consumption items in order to obtain "real" income per capita.15 Neither do we take account of provincial variation in the proportion of population that was working. Details of the estimation are summarized in Appendix A. The flexible computational capacity of modern hardware and software makes it possible to revise further as new evidence or superior methodology becomes available. Nevertheless, we regard these new estimates in their current form as a considerable improvement upon previously available evidence of income generated in different kinds of activity in different parts of the country.
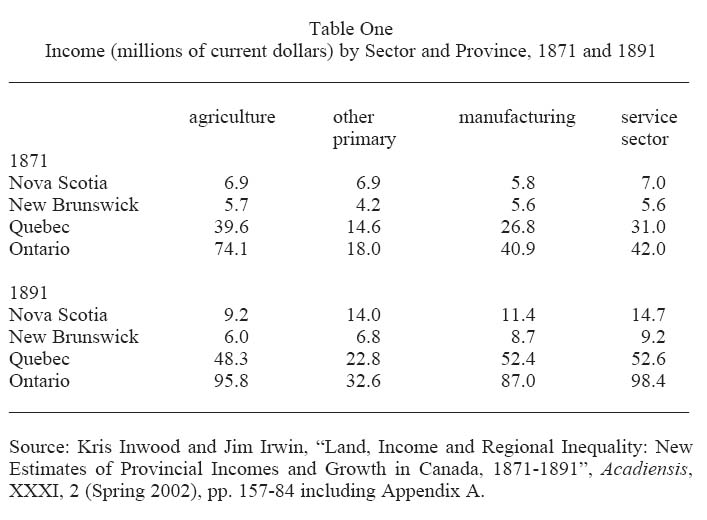
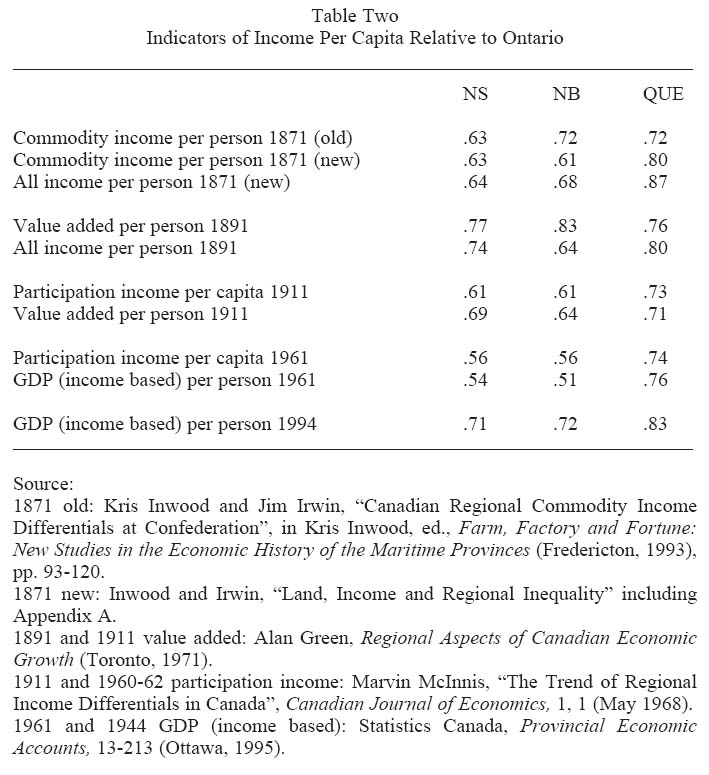
10 The new estimates of income by sector and province in 1871 and 1891 are reported in Table One. These data provide the basis for various indicators of provincial inequality, which in Table Two are reported along with those of previous studies. We express income in each province relative to that of the closest high-income province, Ontario. Other ways of expressing inequality are available, but this method is easy to comprehend and relatively informative. Perhaps the most significant point to emerge from the evidence of Table Two is that all estimates agree on the existence of substantial regional inequality in both 1871 and 1891. On all measures, in both years, the eastern provinces had significantly lower income per person than did Ontario.
11 Parallel measures in subsequent years suggest a similar pattern. In the same Table Two we report a selection of indicators of regional disparity at different dates during the 20th century. These indicators differ somewhat in their construction and in the sources on which they are based, but the extent of similarity is remarkable. Some fluctuation from decade to decade is discernible, but the more important point seems to be that the overall structure of inequality in eastern Canada changed little during the last 130 years. Maritime incomes may have fallen further behind Ontario and national levels during the first half of the century, and then experienced a catching-up of sorts during the 1970s and 1980s. The catching-up or convergence, however, depends largely on the presence of inter-provincial transfers, as various observers have pointed out.16 The decline in inequality is much more limited if transfers are excluded.
Table One : Income (millions of current dollars) by Sector and Province, 1871 and 1891
Display large image of Table 1
12 Although our new estimates do not alter in a substantial way the broad outlines of early regional inequality conveyed by Green (for 1891) and our earlier work (for 1871), some implications of the new data are noteworthy. Inclusion of the service sector for 1871 improves the relative position of New Brunswick and Quebec although not that of Nova Scotia. In both 1871 and 1891 the combined effect of shifting to local prices and census evidence of production is to improve the position of Quebec and diminish that of New Brunswick relative to Ontario. The relative position of Nova Scotia is largely unaffected by the change of estimation. Indeed, both old and new estimates indicate a significant tendency for the incomes of Nova Scotians to converge toward those of Ontario during the 1870s and 1880s, even though a substantial gap remained at the end of the 20-year period.
13 Independent evidence about regional wage levels confirms, in broad outline, the pattern of inequality suggested by the income estimates. In Appendix B we describe comparative wage evidence for the Maritimes and Central Canada during the 1870s and 1880s. For reasons given in the appendix it would be unrealistic to expect a precise and unambiguous comparison of nominal wages in different regions. Nevertheless, the wage evidence does appear to be roughly consistent with that of the income estimates. A variety of sources summarized in Appendix B indicates that Ontario wages during the 1870s and 1880s tended to be somewhat higher than those in Maritime cities. The evidence of wages, therefore, reinforces the picture provided by our income estimates. It seems clear that already in the immediate post-Confederation era wages and incomes were somewhat lower in New Brunswick and Nova Scotia than in Ontario.
Table Two : Indicators of Income Per Capita Relative to Ontario
Display large image of Table 2
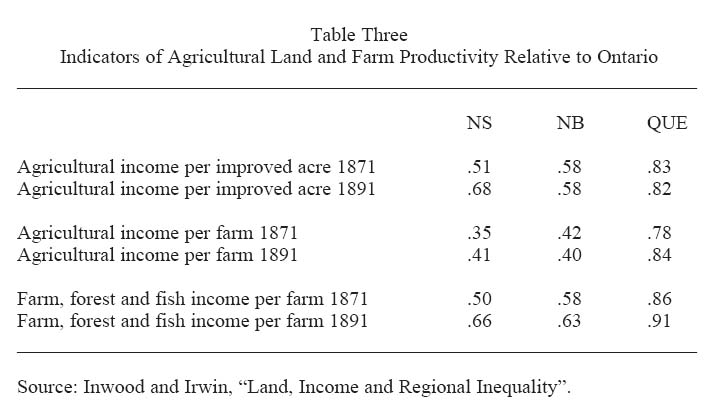
14 The income data provide the basis for a comparison of various measures of agricultural intensity including income per farm and per acre of improved land, reported in Table Three. We do not include income per worker because there is considerable uncertainty about the size of the agricultural labour force. There is imprecision in any measure of work based on 19th-century sources, but Canadian agriculture presents a particularly difficult challenge.17 One challenge is to know the contribution of various family members to the enterprise of the family farm. Another complication is that many people, especially in rural areas, worked part of the year in agriculture and also in forestry and fishing.18 There is no easy solution to the problem of how to report the incomes of farm-based families, but arguably the combined total of agricultural, forest and fishery income is preferable to agriculture alone. Consequently we provide this measure as well.
15 The evidence summarized in Table Three confirms other indications that agricultural income per farm and per acre were much lower in New Brunswick and Nova Scotia, and to a lesser extent in Quebec, than in Ontario. Not surprisingly, given the importance of pluralistic family strategies, especially in the eastern provinces, the provincial differentials were smaller for agricultural income augmented by fishing and forestry. There is some evidence of diminishing inequality during the 1870s and 1880s. In Nova Scotia agricultural income per acre and both measures of income per farm converged significantly toward Ontario levels, although the former did not reach the latter. Two of the indicators for Quebec and one New Brunswick indicator also registered some degree of catching-up, admittedly in a less dramatic fashion than for Nova Scotia. We conclude that income per acre and per farm family remained substantially lower in the eastern provinces, in spite of changes that reduced the severity of inequality (especially for New Scotia).
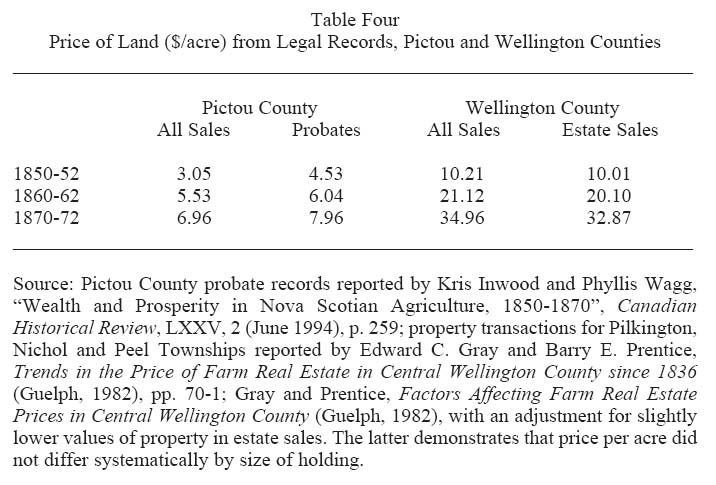
16 The evidence of income per acre directs attention at the land. Various local studies and a number of excellent regional summaries describe the Maritime landscape.19 A useful complement to the geographical detail is evidence of the price of land. Table Four conveys information about the mid-century price of land in two counties, one in Ontario and the other in Nova Scotia. Both sets of price information are taken from legal records; the former is based on transaction instruments and the latter on probated wills. Arguably each source is the most appropriate source of land prices for the relevant jurisdiction.20 The data were collected independently even though the methodologies appear to be roughly consistent with each other.21
Table Three : Indicators of Agricultural Land and Farm Productivity Relative to Ontario
Display large image of Table 3
17 The comparison indicates that farm land was more expensive in Wellington County, Ontario than in Pictou County, Nova Scotia. The gap widened during the 1850s and 1860s. By 1871 the land in Wellington County was roughly five times the price of land in Pictou County. A second and very different source suggests an inter-regional differential of comparable size at the end of the century. The Canadian census began to report an estimated value for farm land with its 1901 enumeration. This source indicates an average value for farmland in Ontario roughly five times higher that of Nova Scotia and New Brunswick (Table Five). The gap appears to have diminished somewhat although it remained substantial ten years later. Similarities in the evidence of the two sources, legal records and the census, reinforces confidence in the estimates. Land valuation is always uncertain because of imprecision in the valuation techniques, variation in the operation of land markets and heterogeneity in the land itself. Nevertheless, it is clear in a general way that ordinary farm land was considerably more expensive in Ontario than in the Maritimes during the mid and late 19th century.22
Table Four : Price of Land ($/acre) from Legal Records, Pictou and Wellington Counties
Display large image of Table 4
18 This information helps to reconcile relatively low incomes with the willing participation of so many families in Maritime agriculture. Farming was and still is a capital-intensive business that can be undertaken only if an individual or family purchases or decides not to sell the land, livestock and buildings. This is true for inherited land as much as purchased land because many inheritors were in the position of offering compensation to other family members who did not receive use of the family farm. For many resource-poor immigrants to North America, and their descendents, owning a farm in Ontario or the American Midwest was not an easy option, but the acquisition of Maritime farm land was more likely to be within reach. Implicit in this point is a related consideration that the option of selling up and moving elsewhere was less attractive because the farmer could take away a relatively small sum with which to finance migration and establish a new business and home elsewhere.
19 To recognize the role of land prices is not to deny the broad complexity of additional factors that influenced the decision to farm. Self-employment and direct control over one’s means of survival was understandably attractive, as was attachment to a particular land and community. Indeed, the network of reciprocal support in a local community was of critical importance for some families. Contributions from family members living elsewhere probably helped some to remain on their farms, as did the opportunities for complementary part-time work in forestry, fishing, industrial crafts and even mining. These and other factors, including the price of land, contributed to the decision of whether or not to farm, and if so where.
Table Five : Average Value ($/acre) of Farm Land by Province

Display large image of Table 5
20 Although there has been little discussion of comparative land values, historians have been under no illusion about the nature of Maritime agricultural land. S.A. Saunders notes that Maritime farmers "have laboured under heavy handicaps, and, of these handicaps, soil fertility is one which causes most concern".23 A second concern according to Saunders was the impediment to mechanization arising from the small size of farms, which arose in large part from the distribution of the best soil in small and scattered deposits. A few years later he writes "Only a small part of the land of the Maritime Provinces is arable . . . the topography of the country even in the better agricultural areas militates against extensive farming".24 A.W. Currie agrees that "much of the soil of Nova Scotia and New Brunswick is infertile, yields are low and costs are high".25 Richard Caves and Richard Holton observe that "a limiting factor of greater significance, however, was simply the shortage of good farm land".26 Harris and Warkentin assert that "most of Nova Scotia, New Brunswick and Newfoundland, however, do not lend themselves to farming – either because of thin soil cover over bedrock or because surface materials are sandy and gravelly . . . severe natural limitations".27 Robin Crickmer claims that "even the better soils of the Maritimes are second rate compared to the more fertile soils of southern Ontario".28 William Marr and Don Paterson simply observe that the Atlantic region is not as "well endowed for cereal growing as central Canada".29
21 Of course, soil fertility was not the only factor shaping the nature and prosperity of farming. Wynn describes the imaginative responses of farmers to their environment and a systematic development of improved practices.30 Various authors emphasize the diversity of Maritime soils and the flexibility of farmers that permitted their continued expansion into the closing decades of the 19th century.31 Indeed, the expansion proceeded in spite of obstacles originating outside of agriculture. J.H. Paterson recognizes the limitations of soil and climate but argues the overriding problem for Maritime farmers was that of markets.32 W.T. Easterbrook and Hugh Aitken echo themes that figure in a good deal of the literature: the inadequacy of roads, access to markets and capital, the alternative attractions of shipping and lumber and competition from farmers in other regions.33 Significantly, they do not emphasize the biophysical constraints. Neither does Anthony Winson who uses a political economy framework to argue for the importance of a wide range of influences originating outside of agriculture.34
22 Clearly, each contributor to this debate must strike a balance between identifying the positive and negative features of the Maritime biophysical environment, and between the effect of biophysical as opposed to other influences.35 Increasingly, however, the balance of opinion appears to be shifting toward views that highlight the limiting characteristics of the biophysical environment. A recent series of scholarly publications emphasize the limited supply of land useful for agriculture. Continued expansion of agriculture after 1860, according to these scholars, was possible only because marginal land was brought into production. The consequence, it is argued, was declining productivity and the loss of ability to generate wealth in agricultural pursuits.
23 Gwyn, Osberg and Siddiq claim that agriculture was "in decline" during the 1850s and 1860s, that land cleared by farmers would not support them and that by 1871 Nova Scotia already had a "a surplus of poor farmers on marginal land".36 Gwyn similarly argues that the farm incomes and wages were falling because agriculture expanded onto "hopelessly inadequate backlands". These "dismal" and "inferior" lands with "no resale value" created "severe limitations for agriculture" and "did little but beggar the families who tried to extract a living".37 These scholars suggest that the over-extension of Maritime agriculture into marginal lands provides an example of declining agricultural incomes as theorized in the classical economic framework of Malthus or Ricardo.38 The importance of agriculture as an influence on all aspects of society and economy leads to the possibility that the overdevelopment of agriculture contributed in a causal sense to the emergence of regional poverty.39
24 Much of the evidence invoked to support this rather gloomy perspective has been challenged elsewhere.40 The evidence on both sides relates primarily to the period 1851-71. As yet, however, there has been little discussion of agriculture in the post-Confederation era. Neither has there been a critical examination of evidence regarding land capability taken from the Canada Land Inventory (CLI). Some scholars invoke the CLI data to support the pessimistic interpretation of Maritime agriculture. This is possible because families in the 19th century farmed on land that later came to be regarded as inappropriate by the federal government employees who devised the CLI.41 Of course, the withdrawal of land from agricultural use during the first half of the 20th century occurred in all parts of rural Canada, as Balcolm observed during the 1920s.42 Nevertheless, farm abandonment in the Maritimes is cited in support of the "overexpansion and decline" argument.
25 The contribution of Gerriets in this issue reinforces the idea of a Maritime agricultural overexpansion. For her, as for Gwyn, Osberg and Siddiq, the CLI assessment of land in classes one, two and three defines the practical limit of successful agriculture in the 19th century. Like the previous authors, Gerriets observes that the Maritime agricultural expansion gradually brought into use land of lower and lower quality, and that such a process led to declining incomes unless people were prepared to emigrate. Farmers in Nova Scotia may provide an especially good example of this process because only they were "forced" to use land rated by CLI as class four. The Gerriets’s interpretation is useful because it is more cautious and nuanced than earlier contributions. Nevertheless, the revival of CLI evidence and the logic of "overdevelopment" invite further consideration which is made possible by Gerriets’s assembly of CLI data.
26 The CLI describes the biophysical environment and assesses its capability for various purposes including agriculture.43 The CLI emerged during the 1970s as an extension of several decades of painstaking local soil surveys by provincial governments.44 Unlike the earlier soil surveys, which were local and descriptive in nature, the CLI was intended for use as a macro-level public planning tool in the context of late-20th-century production capacities.45
27 The CLI is both more ambitious and less precise than the soil surveys on which it is based. For example, the CLI sometimes is taken to represent all biophysical aspects of agricultural capability, not just the soil. Of course, other factors such as precipitation or sun or temperature may offset to some extent the limitations of poor soil quality. And yet, there is no indication how the other biophysical characteristics are measured, much less integrated with soil quality into a single assessment of land capability. The methodological weakness is tacitly recognized in an admission that local recordings of climate data and their assembly into a climate classification system is a first approximation in need of further research.46 It is difficult to escape the conclusion that precision is lost in the shift from local descriptions of soil quality to a single macro-level indicator that somehow combines all characteristics of soil, climate and water resources.
28 Another uncertainty arises because the CLI claims to identify agricultural capability in a general way for a wide range of crops. Particular soils, however, are better suited for some crops than for others, as was recognized in the original soil surveys.47 In contrast, the CLI purports to represent the general suitability of land for all agricultural purposes. Clearly, a single scale describing the potential for all agricultural commodities must rely on some notion of the relative importance of different products in order to aggregate them into a single classification system. Crop prices are one possible source of information, but they cannot be used since the CLI assessment is independent of market circumstance. The originators of the CLI may have had a methodology for the identification of relative importance but, if so, it remains unreported. Without more information, it is difficult to assess its appropriateness for historical research.
29 It is also unclear how to interpret the "national" dimension of the index. The originators of the CLI provide an explicit warning that "Caution should be used in comparing land classes from province to province as each province was classified independently".48 In other words, class one in Ontario is not the same as class one in Nova Scotia. And yet, apparently, the provincial systems were standardized in some manner. This may be inferred from the CLI reclassification downward of land previously identified as class one in the provincial soil surveys.49 This creates some uncertainty since, on the one hand, the reliability of any inter-provincial comparison depends on the way in which the provincial systems were combined. On the other hand, however, we have no information about this process. Lack of information on this point undermines confidence in the use of CLI for comparative purposes.
30 Even the users of the CLI recognize a need for caution in its application to 19th-century agricultural practice.50 Land capability has changed during the last century and a half because of climate changes, land deterioration (through erosion or depletion), land improvement (through drainage, irrigation, replenishment and other investments) and region-specific changes in production potential resulting from new crop varieties during the 20th century and the spread of mechanization. The continuous evolution of new seed varieties, fertilizers, equipment and other aspects of agricultural practice is largely irrelevant over a year or two, but the cumulative effect of these processes over several decades has the potential to create substantial change in agricultural capacity in one location relative to others.
31 It is also worth noting that the kinds of products demanded from agriculture have changed greatly. By the 1960s agriculture was much less concerned with animal feed because the use of animals for transportation and draft purposes (both on and off farms) had diminished greatly in the previous century. Land regarded today as poor quality (CLI classes five and six) because it is only suited for pasture or hay would have been a valued part of any 19th-century farm. Again, the CLI considers land left in forest as inappropriate for agricultural use (class seven). And, yet, the woodlot was an essential to every farm family in the 19th century. For these and other reasons the CLI focus on field crops would look rather narrow to most 19th-century farmers.51
32 Although the precision of the land inventory for historical purposes is uncertain, there is no reason to doubt the underlying message, that the amount of really good land is limited in every part of Canada and especially so in New Brunswick and Nova Scotia. It is the use of the land inventory at a more detailed level that is suspect. Nevertheless, some scholars claim that the more detailed information provides a useful research tool. In the next section we review the uses of the CLI for historical research.
33 Some scholars have made good use of the earlier and arguably more reliable soil surveys, but there has been little use of the CLI by historians.52 Most historians who have used it draw inferences from the simple fact that 19th-century farmers worked land that would be considered unsuitable by the late-20th-century CLI.53 Only two studies by Michael Troughton and Gerriets have examined the CLI itself in a more extensive way. These two studies come to opposite conclusions about the value of CLI information for historical research.
34 Troughton examines the correlation at a county level between Maritime land identified as CLI class two and three and acreage in use by farmers in 1891 and at subsequent benchmarks.54 This statistical exercise reveals only a weak correlation between CLI and farm practice. Troughton also notes several significant deviations from the regional pattern, to the extent a pattern is discernible. In 1891, for example, farm acreage was inexplicably large in Halifax and Lunenburg Counties, in Cape Breton and in parts of southern New Brunswick, while the opposite was true of northern New Brunswick. These exceptions and the generally low level of correlation undermine confidence in the constraint allegedly posed by the CLI estimate of good farm land.55 Implicit in this observation is the possibility that CLI is simply not useful for historical analysis.
35 Gerriets, however, argues for renewed confidence in the source. She finds evidence at a disaggregate level of a "normal" relationship between agricultural activity in Canada 1871 and natural resources as defined by CLI a century later.56 Admittedly, farmers in some parts of the country appear to have "overdeveloped" their land in the sense of using more good land than was normal. Some farmers even used land that would be considered unsuitable for agriculture, as defined by the CLI. Gerriets provides a variety of explanations for these apparent anomalies and re-affirms confidence in the CLI and in the "normal" relationship between the modern assessment of land use capability and 19th-century agriculture.
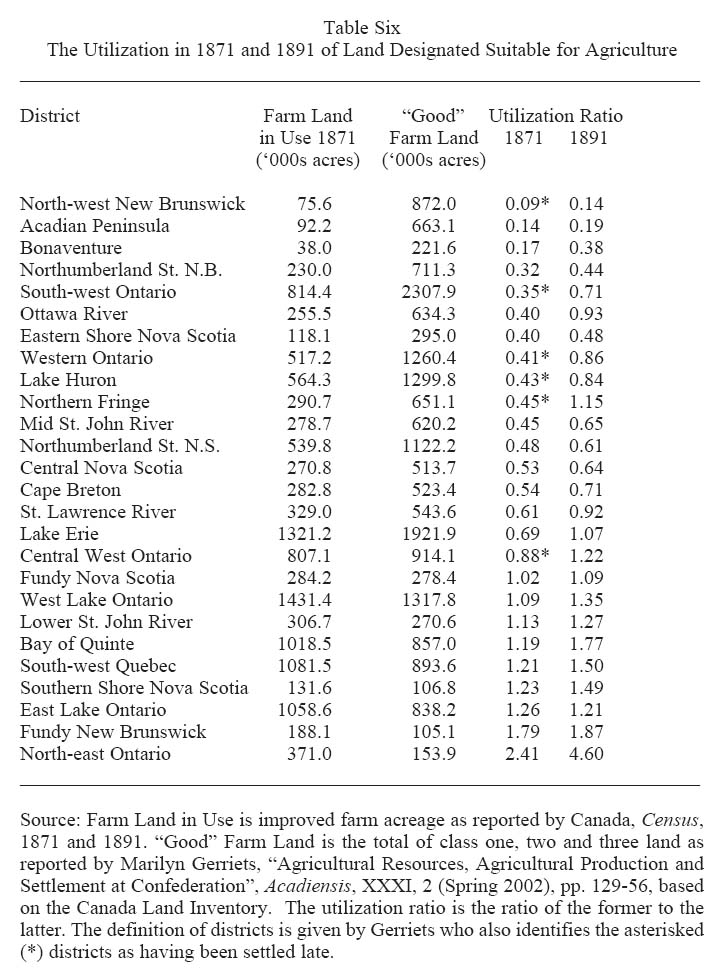
36 Some perspective on this claim is available from the Gerriets compilation of CLI data, reported in Table Six. The information included in the table is the amount of land for purportedly suitable for agriculture (CLI classes one, two and three), along with the amount used in 1871 (improved farm acreage) and the utilization ratio (the improved share of all suitable land) for both 1871 and 1891 in each district identified by Gerriets. The size of these districts varies considerably and somewhat inexplicably.57 Several of her districts had more than one million acres of improved agricultural land, while others had less than 100,000 acres. At first glance, the relationship between the modern assessment of land capability and land used by 19th-century farmers does not appear to be a close one. Even if we leave aside the regions that were settled late, the land in use by 1871 varied between 0.14 and 2.41 of the available "good" land. There is no obvious regional pattern to the diversity of utilization ratios. All parts of the country had districts in which farmers used less than half of their apparently "good" land. Similarly, districts in which farmers used more land than would be considered appropriate (a utilization ratio exceeding 1.0) are found in every region.
Table Six : The Utilization in 1871 and 1891 of Land Designated Suitable for Agriculture
Display large image of Table 6
37 Comparison of evidence for the two years indicates that during the 1870s and 1880s farmers everywhere brought more land into production, even in regions that previously had used all the "good" land. The range of utilization ratios remained very diverse, ranging from 0.14 in north-western New Brunswick to 4.60 in north-eastern Ontario. The standard deviation of the utilization ratios increased from 0.61 in 1871 to 0.98 in 1891. The utilization ratio in the latter year exceeded 1.0 in one-half of all districts.
38 The frequency with which utilization ratios exceed unity undermines confidence in the CLI assessment of the physical limits of agriculture. The diversity of ratios, in turn, undermines confidence in the existence of a "normal" relationship between the CLI estimate of land availability and farming practice. It remains possible, however, that a more systematic and statistical analysis would confirm the relationship of declining marginal productivity.58 Gerriets predicts that the movement of farming onto poorer and poorer soils, as evidenced by an increase in the utilization ratio, had the effect of reducing income per acre and income per farm and discouraging the further improvement of land and the entry of new farmers. In essence, this is the same Malthusian or Ricardian mechanism identified by Gwyn, Osberg and Siddiq. The great advantage of the Gerriets study, however, is that it provides the evidence needed to assess the empirical validity of these ideas.
39 In the following discussion we combine the Gerriets evidence of "good" land (classes one, two and three) and our own estimate of income earned in various sectors. A series of ordinary least-squares regressions explores the relationship between utilization ratio and various indicators of agricultural progress and intensity. We use the districts defined by Gerriets and a dichotomous variable for late settlement to reflect her contention that the utilization ratio has different implications in districts that were settled late.
40 The results of the statistical exercise are reported in Appendix C. The Malthusian hypothesis, if correct, should cause the change and income variables to be lower when utilization ratio is higher. There may be some exceptions, but if the data are useful and the hypothesis is correct, we would expect to see a systematic inverse relationship between the utilization ratio and the agricultural indicators. As is indicated in the appendix, however, we do not observe these results. No significant relationship is observed between the utilization ratio and any indicator of change (number of acres, number of farms, amount of farm income, income per acre, income per farm). Neither is there a significant relationship to income per acre in 1871 or 1891.59
41 Nevertheless, the analysis does provide evidence of two systematic relationships. One is the distinctiveness of the late-settled districts, as Gerriets had suggested. Specifically, the late-settled districts had higher incomes and faster extensive growth during the 1870s and 1880s. By extensive growth we mean change in the number of acres and of farms and in the total flow of agricultural income. The late-settled areas, however, did not experience faster intensive growth (total income per capita and agricultural income per farm and per acre). A second strong relationship involves farm income. A higher utilization ratio was strongly associated with higher income per farm and higher income per capita. In other words, using up the "good" land, even if it meant bringing low-quality land into production, appears to have increased average farm income and income per capita in a district.
42 The results do not confirm that using up the stock of "good" land, as indicated by a higher utilization ratio, had an adverse effect on agricultural progress and farm income.60 Having more of the available good land in production, or exceeding that limit by a wider margin, was not associated with a slower growth in farms, acreage, farm income, income per farm or income per acre in late-19th-century Canada. Neither did it lead to lower income per acre. On the contrary, bringing more of the available good land into production is strongly and significantly associated with higher agricultural income per farm and higher total income per capita. This result is more obviously consistent with the Boserupian notion of productivity growth being induced by population pressures than the Malthusian and Ricardian idea of declining marginal productivity.61 It is possible of course that both kinds of pressure were at work, but if so the former predominated in the post-Confederation era.
43 Our methodology relies on a utilization ratio based on the CLI in order to assess the concept of "overdevelopment" and related hypotheses about Canadian agriculture. The statistical analysis is relatively simple, and leads to the relatively simple conclusion that the data do not lend support to the conceptualization. Consequently, we are faced with two choices. If we accept the utilization ratio as a reliable indicator of the tendency of farmers to rely on lower and lower quality land, then we must reject "overdevelopment and decline" as an acceptable characterization of late-19th-century Canadian agriculture. There may have been some tendency for agriculture to expand into more marginal land, with consequent implications for productivity and income but, if so, offsetting factors had the effect of obscuring them.
44 On the other hand, if we retain confidence in the interpretative power and relevance of the diminishing returns logic, then we must suspect the quality of the data. Either the districts as developed by Gerriets are inappropriate, or the late-20th-century identification of land capability should not be extended back to the 19th century. The choice, therefore, is relatively straightforward. We can accept the CLI and accompanying indicators of the utilization of good land, or we can accept the declining marginal income interpretation of Canadian agriculture, but we cannot accept both. Of course, it also would be possible to reject both.
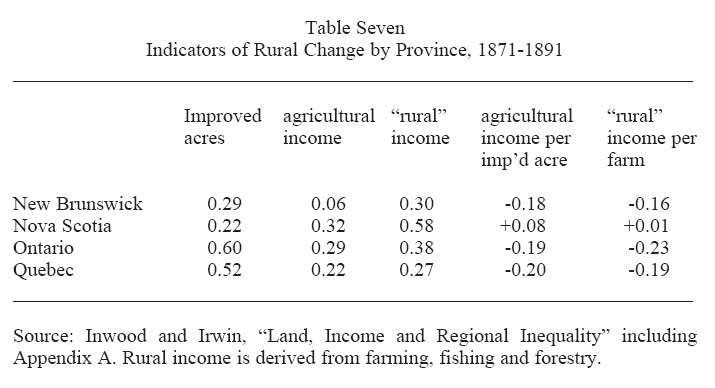
45 A useful perspective on this dilemna may be taken from the indicators of rural change in various parts of Canada reported in Table Seven. The pessimistic view of Maritime agriculture may find some support in the figures for farm acreage, which expanded more slowly in New Brunswick and Nova Scotia than in Central Canada. Of course, a slower rate of expansion in the Maritime region might also reflect its earlier beginning of settlement. The evidence of income growth, moreover, presents a more positive image, for Nova Scotia at any rate. Agricultural income expanded most quickly in Nova Scotia in spite of experiencing the smallest acreage expansion. New Brunswick income, on the other hand, grew very little. Nevertheless, the broader concept of rural income, including agriculture, fishing and forestry, registers growth for New Brunswick comparable to that of Quebec, and not much less than Ontario. On balance, this evidence provides little support for the extreme pessimistic view of Maritime agriculture.
46 The final two columns in Table Seven are of particular relevance to the arguments surrounding quality of land and its diminishing marginal productivity. Agricultural income per improved acre increased but productivity changed little in New Brunswick, Quebec and Ontario under plausible assumptions about the movement of farm prices. Farm incomes may increase or decrease because of changes in productivity and/or commodity prices. In order to identify productivity change we must remove the effect of price change. McInnis suggests that Canada experienced a roughly 15 per cent decline in farm prices during this period.62 A price decline of this magnitude implies a small productivity decline in most of eastern Canada. A slightly stronger price change implies that productivity per acre remained roughly constant.
47 Nova Scotia remains something of an exception to this pattern insofar as productivity increased considerably, in an absolute sense and relative to other provinces during the 1870s and 1880s. Roughly the same might be said about the growth of "rural" income per farm. Ironically, the only province experiencing a strong increase in income per acre and per farm, Nova Scotia, is the province criticized most commonly for the use of marginal land and diminishing farm income. Evidence for the 1850s and 1860s is of a somewhat different character but leads to qualitatively similar conclusions, suggesting that Confederation did not create a discontinuity in this aspect of regional development.63
Table Seven : Indicators of Rural Change by Province, 1871-1891
Display large image of Table 7
48 It is not possible in this study to explain or analyze in any detail the sources of rural productivity and income growth during the 1870s and 1880s. When the analysis is undertaken, however, the impact of activity originating in other sectors is likely to loom large. Canadian economic historians tend to be comfortable with the idea of agriculture as an engine of growth that drives the rest of the economy.64 It is equally important to recognize, however, that mining, manufacturing and service sector activity contributed to the rural and agricultural experience. The reciprocal nature of relationships between agriculture and the rest of the economy are particularly relevant to an understanding of the later 19th century, by which point the Canadian and American economies were already well-advanced in their process of industrial revolution.65 With this in mind, and recalling the sectoral growth patterns identified above, one likely source of Nova Scotia exceptionalism is industrialization. It has long been recognized that Nova Scotia gained a great deal from the growth in this period of mining, manufacturing and rail transportation.66 The "spin-off" effects on other activities including agriculture have been less visible, but they may go some way toward explaining the robust post-Confederation expansion of agricultural income and productivity in spite of the limitations of location and natural resources.
KRIS INWOOD and JIM IRWIN
Appendix A The Estimation of Regional Income
49 We estimate income in a manner that follows similar studies of income generated elsewhere in North America during the 19th century. For most of the commodity-producing sectors we rely on a census report of production as a measure of the overall volume of activity. We value the production at appropriate prices (which differ regionally wherever possible) to obtain the maximum possible income earned in the activity. The income is then reduced by the cost of various inputs (for example, feed for livestock, seed for replanting, off-farm purchases and so on).
50 The quality of the income estimate depends crucially on the information on which it is based. We are fortunate that the 1871 and 1891 Canadian enumerations of primary production were relatively detailed and comparable in their organization and methodology. In both years the census enumeration included production for consumption within the home. We take most of the information used in our estimation from the reports of these two censuses. Important exceptions are the reports of fish landed taken from annual reports of the Department of Fisheries and Marine and minerals/metals in 1891 taken from reports of the Geological Survey of Canada. Evidence taken from the enumeration of industrial raw materials is used for a few wood and mineral products.
51 All census information of interest was reported at the level of the individual census district (and in some cases the subdistrict). District boundaries changed slightly from 1871 to 1891, but it has not been difficult to recast the 1871 information on 1891 boundaries. Our basic unit of observation, therefore, is the 1891 census district. From this basis we aggregate information in order to obtain a profile of the provinces (and the super-districts used by Gerriets).
52 Following are the primary commodities about which production information is available in 1871 and 1891. Additional detail is available for 1891 because of improvements to the enumeration but the following suffice to indicate the scope of the estimation. The source in all cases is the census, directly or indirectly, with the exceptions noted above. More precise information on the estimating procedure and on prices and expenses is available from the authors. Clearly, we have not captured all commodity production from which income was earned, but additional or more precise evidence about one or more commodities is unlikely to alter in a significant way the overall pattern of regional differences.Crops: apples, barley, beans, buckwheat, clover, corn, flax fibre, flax seed, grass-seed other, grapes, hay, hops, market gardening, orchard fruit other (several varieties 1891), oats, peas, potatoes, roots other, rye, sorghum, tobacco, turnips, wheat fall, wheat spring.
Livestock and miscellaneous farm: beeswax, butter, cattle sold/slaughtered, cattle inventory change, cheese, cows/other cattle sold/slaughtered, cows/other cattle inventory change, eggs, honey, horses sold, horses inventory change, maple sugar, milk, oxen, poultry (several varieties 1891), sheep sold/slaughtered, sheep inventory change, swine sold/slaughtered, wool.
Wood: firewood, logs pine, logs other, lathwood, masts and spars, poles, posts, staves, tanning bark, ties, timber birch and maple, timber elm, timber hickory, timber oak, timber red pine, timber tamarac, timber walnut (two kinds), timber white pine, timber other.
Minerals: albertite, antinomy, arsenic, asbestos, barytes, bluestone, clay, coal, copper, feldspar, gold, graphite, grindstones, gypsum, iron, kaolin, lead, lime (industrial flux and kilns), manganese, marble, mica, mineral water, nickel, ochres, peat, petroleum, phosphate, plumbago, precious stones, pyrites, quartz, salt, sand, silver, slate, soapstone, stone, sulphates, terracotta, whiting, zinc, other.
Fish: bass, clams, cod, cod oil, cod tongues, eels, flounder, frost fish, gaspereaux/alewives, guano, haddock, hake, hake sounds, halibut, herring, lobsters, mackerel, maskinonge, oysters, perch, pickerel, pike, pollock, porpoise skins, roes, salmon (four kinds), sardines, scallops, sea otter, sealskins, shad, smelt, squid, sturgeon, trout, whitefish, winnish, other fish (including "bait fish" and "manure fish"), other oils.
53 The "manufacturing sector" included a very wide variety of production and corresponding opportunities to earn income. Fortunately, the Canadian census enumeration of manufacturing or industrial production was extensive. We are able to rely on census reports of the value of production and raw materials in 1871 and 1891. The latter is taken from published census reports, while the former is calculated directly from the census manuscript information. See Kris Inwood, "The Census Representation of Canadian Industry, 1871-91", Histoire sociale/Social History, 28, 56 (novembre/November 1995), pp. 347-74.
54 Service sector income is based on a classification of all workers as either service or non-service. The number of workers is known from the published summary of people reporting occupations (with a substitution of "employees" from the industrial enumeration for the manufacturing occupations). Income per worker in the non-service activities (manufacturing and primary production) is assigned to service-sector workers on the assumption that per worker incomes were equal on average in the two broad sectors within each of the regions identified in Kris Inwood and Jim Irwin, "Canadian Regional Commodity Incomes: Differentials at Confederation" in Kris Inwood, ed., Farm, Factory and Fortune: New Studies in the Economic History of the Maritime Provinces (Fredericton, 1993), pp. 93-120.
55 The service sector is clearly the least satisfactory aspect of income estimation, for our estimates and indeed for all investigations of service activity and income. Because no independent evidence of service output or consumption is available, most estimates of service income even today rely at some point on an assumed per worker income or productivity. Our method for doing so reflects a plausible assumption about the workings of regional labour markets and allows for the possibility of regional variation in service income per worker.
Appendix B Regional Wage Comparisons 1870-1884
56 The reporting of wages in most historical and many contemporary sources is subject to considerable imprecision. The wage received by an individual typically varies with age, education, experience, skill and other factors idiosyncratic to the worker, the employer or their relationship. Undocumented variation in such characteristics can lead to apparently inexplicable changes or differences in reported wages. Further uncertainty arises from the nature of the work. Most job designations, of necessity, simplify the description of work in a way that conceals variation in the precise nature of the task and in the basis for remuneration. Complication also arises from the local volatility of wages. Both the demand and supply for a particular skill within an individual community will vary randomly, seasonally, over the business cycle and because of long term trends and trend changes. As a practical matter, volatility of this sort make it difficult to obtain and to know that we have obtained a "typical" or representative wage.
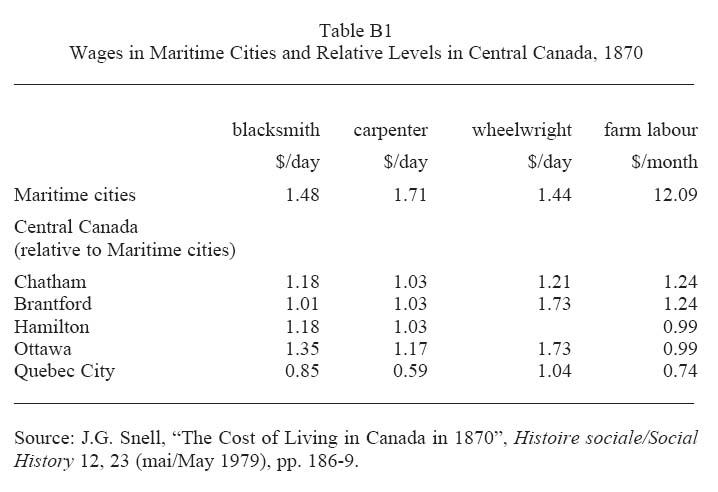
57 These concerns do not imply that wage evidence is unreliable, but it does recommend caution in the use of what is clearly a complex source. We examine a series of reports by American observers of wages in different parts of Canada during the 1870s and 1880s. J.N. Larned, editor of the Buffalo Morning Express, reported in 1870 to the Unites States House of Representatives about wages in Fredericton and Saint John. Five years later Edward Young, head of the United States Bureau of Statistics, reported on wages in Fredericton, Saint John, Windsor, Nova Scotia, Charlottetown and Pictou County. In 1885 the United States Bureau of Foreign Commerce collected information from its Canadian consuls in order to report wage levels in Saint John, Halifax and Charlottetown. In each case information was provided about a number of Central Canadian locations as well.
58 We use this information in the appendix tables to report an average wage for Maritime cities during each of three years (1870, 1873, 1884) in each of four kinds of work. The average is obtained by weighting each of the available locations by its population. We then report the wage for various locations in Quebec and Ontario relative to the Maritime average. For example, in the upper left corner of Table B1, we see that blacksmiths in 1873 earned $1.48/day in Maritime cities and that the rate in Chatham, Ontario was 18 per cent higher than the Maritime urban average.
59 The changing set of locations in the Maritime benchmark and uncertainty about the precise basis for reporting in the various sources reduces confidence in any intertemporal comparison. For example, we should not infer that blacksmithing wages increased from $1.48 to $1.71 to $1.77 in 1884, while carpenters experienced a decline from $1.71 to $1.64 to $1.60. It is equally possible that changes in the composition of the benchmark are responsible (for example if the relative wages of blacksmiths and carpenters varied by location). Nevertheless, if we restrict our focus to cross-Canada comparisons in a single year, and proceed cautiously, this evidence may yield some insight into the relation between Maritime and Central Canadian wages.
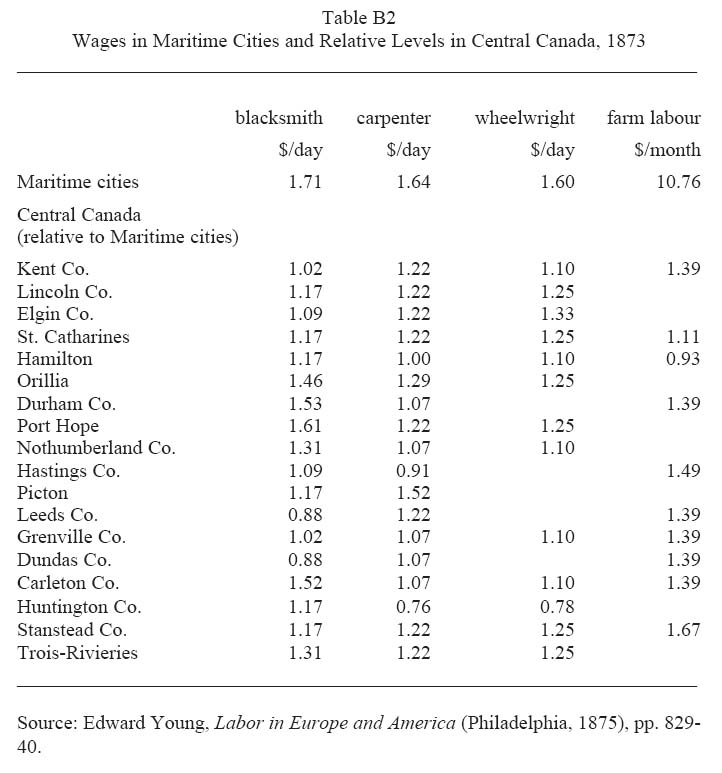
60 The data in Tables B1, B2 and B3 confirm the volatility and/or imprecision of wage evidence. Individual communities in Ontario apparently differed a great deal amongst each other. During 1870, according to Larned, they enjoyed wages between 0.99 and 1.73 times the benchmark for Maritime cities, depending on the community and type of work. Five years later Young reported a range in Ontario between 0.88 and 1.61 times, while the 1884 range was from 0.80 to 2.09. As anticipated, we have no basis for knowing if the variation reflects temporary fluctuations, minor errors, imprecision or a comparison that is misconceived in some more fundamental way. We do know, however, that Ontario wages typically exceeded those in Quebec and the Maritimes in most comparisons. Thirteen of the 15 comparisons in 1870 indicate a higher wage in Ontario, as do 45 of the 49 comparisons in 1873 and 30 of the 46 in 1884. In most of these comparisons the Ontario wage exceeded the Maritime benchmark by at least 10 per cent, often more.
61 It would seem risky to assign a precise value for the Maritime-Ontario wage differential. Equally however, it is clear that Ontario wages were higher, although probably by a smaller margin than that of the income estimates reported above. It is not surprising to see a smaller differential in work-specific urban wages than in the income estimate for at least four reasons: (i) Urban wages do not reflect adequately the more extreme wage contrast experienced by workers in smaller communities, especially in the Maritimes. (ii) Much of the income to families throughout Canada came not in the form of a wage, but as a return to capital and "management" in farming or other small business. Again, the regional differential in this income probably was more extreme, in part because capital/labour values were low in the Maritimes and because capital and management income typically was realized as a residual after other expenses were covered. (iii) Yet another reason that land incomes across Canada might vary more than labour incomes is that workers were able to escape the worst effects of downward pressure on their earnings through emigration. The owners of land, by contrast, could not shift their resource to a higher-paying environment. A greater inequality in returns to land and hence of any measure that combines income from all sources is unsurprising because of the greater fixity of land than of labour. (iv) Any differential arising from a different composition of work in the various regions would be reflected in the income but not the work-specific wage data.
62 These considerations and the various sources of imprecision in wage evidence suggest a broad consistency in the evidence of higher nominal incomes and wages in Ontario than in the Maritime provinces. We have not commented directly on the Quebec data, in part because if read literally, they suggest a spatial pattern of considerable complexity within the province. Nevertheless, it is clear that Ontario wages tended to exceed those in Quebec as well.
Table B1 : Wages in Maritime Cities and Relative Levels in Central Canada, 1870
Display large image of Table 8
Table B2 : Wages in Maritime Cities and Relative Levels in Central Canada, 1873
Display large image of Table 9
Table B3 : Wages in Maritime Cities and Relative Levels in Central Canada, 1884
Source: United States, Bureau of Foreign Commerce, Labour in Foreign Countries, vol. 1 (Washington, D.C., 1885), pp. 1-115.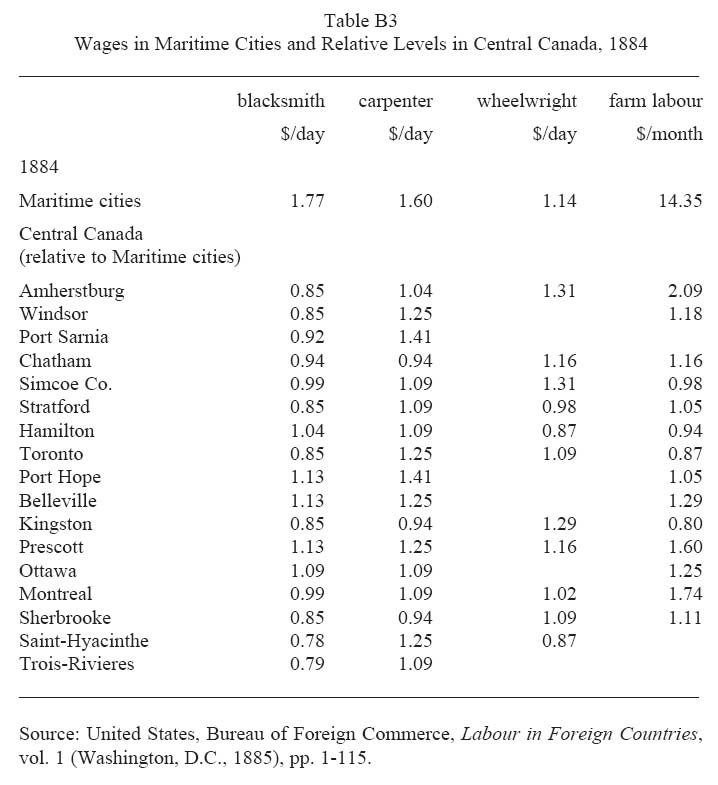
Appendix C : Analysis of the Impact of the Utilization Ratio and Late Settlement
Source: This table reports the results of regression analysis discussed in the text of the paper. Each line or row reports a different regression with a different dependent variable. For example, the first row reports analysis of the change in number of acres, the second row reports analysis of the change in number of farms and so on. The two columns report co-efficients estimated for each of the two explanatory variables – utilization ratio and late settlement indicator. For example, a negative (positive) coefficient in the first column of the first row indicates an inverse (positive) relationship between the utilization ratio and acreage change. The Malthusian hypothesis would be confirmed by the finding of a significant negative relationship. Asterisks identify the level of statistical significance (if any). For example, in the bottom panel of the table, a higher utilization ratio is associated with higher income per capita in both years and with the growth of income per capita. The effect of utilization ratio on income level is strong but the effect on income change is not statistically significant from zero.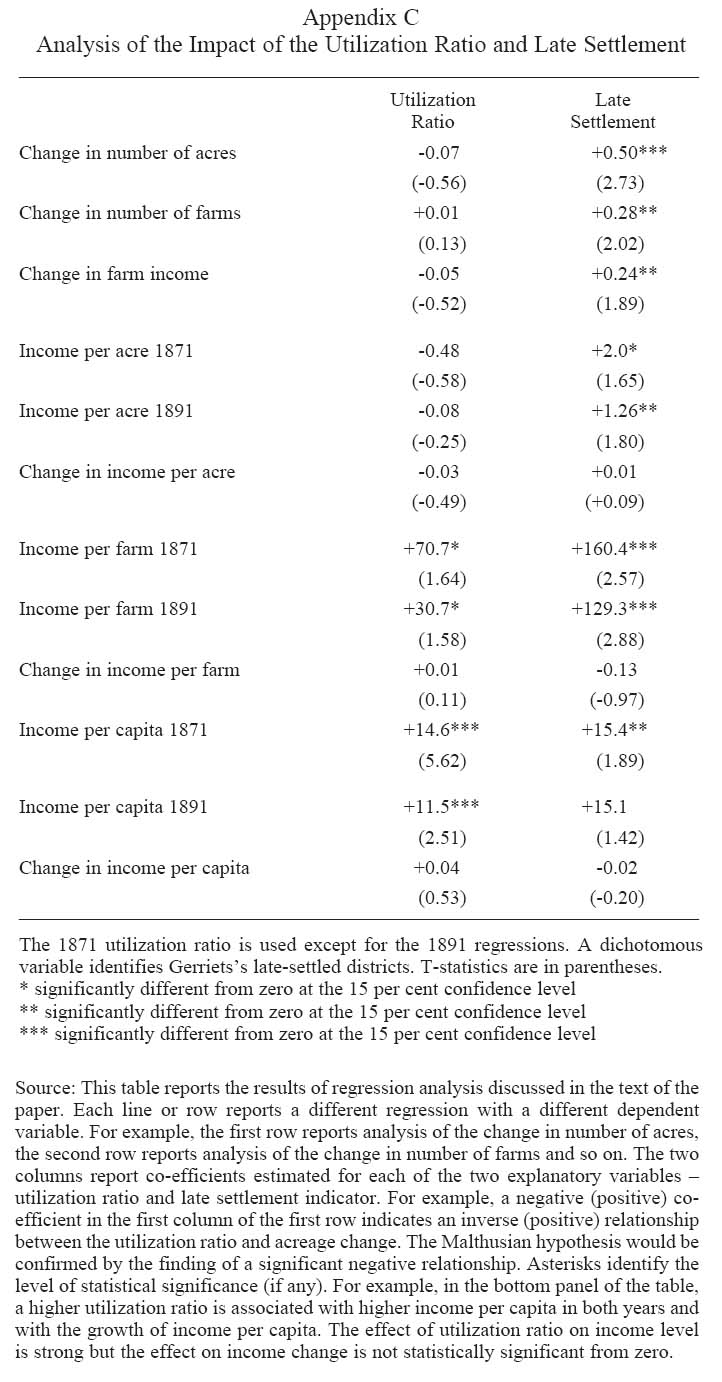
Notes