Agricultural Resources, Agricultural Production and Settlement at Confederation
Marilyn GerrietsSt. Francis Xavier University
1 IN EASTERN CANADA THE AGRICULTURAL LANDS were largely settled by the time of Confederation, although on many farms much soil still lay under forest.1 Most families gained a livelihood by farming, but in the earliest days of creating a farm from the wilderness many also worked for wages, perhaps on others’ lands, perhaps in lumber camps or the fishery. Once sufficient acreage was cleared, the land supplied a large portion of a family’s needs; meat, milk, butter, vegetables and cloth were all produced on the farm.2 Other farm products required local processing before they were useful; wheat needed to be ground to flour and oats to meal, logs provided better housing when sawn into boards, hides were tanned to leather and manufactured into harnesses or shoes by skilled artisans, wool was carded and home spun cloth was fulled, and for some the enjoyment of rye and barley was much increased by distillation or brewing. As a result, agricultural communities always enjoyed a degree of diversification, since farming families’ willingness to exchange farm produce for processed goods gave artisans a livelihood.
2 Even with local manufacturing, neither the farms nor the cluster of activities in farming communities could meet all the needs and wants of settlers. Sugar, tea, coffee, fine cloth, quality shoes and boots added greatly to settlers’ comforts, while tools, nails and other iron goods helped farmers become more efficient in their trade.3 To secure these imported commodities, external markets for some local produce had to be found. Established families with sufficient good land were able to provide for their basic needs and to produce goods for sale on local or export markets; less fortunate families, however, continued to rely on wage labour to purchase both local and imported goods.
3 This study is motivated by the belief that the ability to produce agricultural goods was an important stimulant to the formation of a vibrant domestic economy. Agriculture was only a part of the economies of the provinces of Canada in 1871, but it was the most important single sector. Where a large number of people secured a livelihood in agriculture, a sound foundation had been established for a rich domestic market. An understanding of the relationship between resources and agricultural development is essential to appreciating the patterns of economic development in the different regions of Canada.
4 The dominance of the staples thesis diverted the attention of Canadian economic historians away from the vibrant domestic economy with its rich network of exchanges which existed in the confederated provinces. According to Harold Innis, Canada’s economic history was the story of a series of staple exports, and agriculture’s contribution to economic development depended on the production of products for export.4 In this view, dynamic forces which set the pace of economic development appeared to originate outside the domestic economy. The staples thesis began to lose favour when Marvin McInnis and Douglas McCalla observed that Ontario’s settlement and development preceded wheat exports. They described vigorous domestic markets where most people were farmers and wheat was only the most important of many agricultural products.5 Movement away from the staples thesis has taken a somewhat different path in study of the Maritimes’ economy. There, rejection of the staples interpretation of the evolution of the region’s economy began with the description of the region’s successful industrialization following the post-Confederation construction of railroads and the introduction of protective tariffs. Reinterpretation of the role of agriculture eventually followed these inquiries. The characterizations of Maritime agriculture as subsistence production by farmers who were either culturally unsuited to the task or who were easily distracted by lumbering and fishing have been dismissed.6 Historians of the Maritimes have recognized that most families lived on farms and that the economic and social life of the Maritimes cannot be understood without a thorough understanding of farming and rural communities.7 Overall descriptions of the nature of agriculture provided important initial contributions,8 while studies of individual communities have shown the great diversity of agriculture within the Maritimes.9 Some communities and some farmers prospered by meeting the needs of their own tables and by supplying surpluses to the market; others struggled to survive, supplementing incomes derived from farming with work on more prosperous farms or in diverse non-agricultural activities.10
5 Changes in the interpretation of the role of agriculture in economic development requires reinterpretation of the role of agricultural resources in shaping that development. Within the staples thesis, resource endowment played a crucial role in determining whether a region was able to produce an agricultural staple.11 While staples theorists gave some recognition to the impact of endowments with agricultural resources, these comments have not stimulated work on the relationship between the ability to produce for the domestic market and economic development. The weak development of the Maritimes has generally been attributed to the unfortunate nature of its staples. Studies of agricultural development in the Maritimes written outside the staples tradition have sometimes acknowledged the role of agricultural resources and at other times dismissed it.12 Even very poor land can be forced to yield a few crops and some forage for animals, but may not be sufficiently productive to attract settlers. Only a systematic study can help us understand how good the land needed to be before settlers found it provided sufficient reward for their labours. This study presents a survey of the relationship of the extent of settlement to agricultural resources in Ontario, the Maritimes and a small portion of Quebec.13 Comparison of the extent of agricultural development in 1870 to the quality of soils available establishes the normal relationship between resources and agricultural activity. Once the norm is established, deviations from the norm can be identified and explanations for the deviations can be sought.
6 Data on agricultural resources for this study are taken from the Canada Land Inventory, a systematic survey of soils and climates which resulted in a classification of Canada’s resources according to their potential for agriculture.14 Soil surveys were conducted over many years, but the inventory used in this study was completed in the early 1970s. These surveys measured the characteristics of soils such as soil structure, drainage, stoniness and depth to bedrock. Information about climate and topography was also very important in determining the suitability of the land to various uses. Descriptions of soils are available to help determine if a district was well suited to a specific crop with unique requirements, such as tobacco or blueberries. However, an overall measure of the suitability of land to agriculture was required, and a general classification system was devised. The system was intended to provide an assessment of the potential of resources. Contemporary social, economic or cultural factors were not introduced into assessment criteria. As a result, the current use of the land, the size of farms, the location of the land in relationship to roads or markets and the skills or cultural traits of the current owners did not influence the classification of the land. If improvements to the land could be made by an individual owner – for example, clearing the land – the land was classified as if the improvements had been made. If the improvements were beyond the capability of an individual – for example, some forms of drainage – the land was classified according to its unimproved state.15 The surveys assumed that soils were well managed and that mechanized farming systems were used.
7 The classification system grouped lands into seven classes according to their capability for agriculture. Cultivation of arable crops was deemed possible on the first four classes of land, although with increasing difficulty as the quality of the land declines, while classes five and six could support only perennial forage crops.16 Class seven soils have no capability for agriculture. Two additional categories refer to soils that were not classified. First, class eight soils were not mapped because of urban development, inclusion in provincial parks or other factors which made them unavailable for agriculture.17 Second, the potential of organic soils was not determined, and they were left unclassified.
8 A great advantage of this survey for historical research is that the categorization of soils depended on their ability to support production of a wide range of crops. While 19th-century farmers produced surpluses for sale on the market, they also grew a variety of crops for their own table.18 Differences in land and climate had a strong influence on the particular crops produced in surplus for the market in each region. However, specialized production of a narrow range of crops was not feasible in the 19th century. Lack of mechanization meant that a variety of crops had to be grown to spread labour requirements throughout the seasons. High costs of transportation and difficulties preserving foods made the purchase of foodstuffs far less attractive than production of a wide range of crops for household consumption. While the ability to produce a marketable crop such as tobacco or small fruits was attractive, the land also had to be capable of producing a wide range of foodstuffs in order to be useful to settlers.
9 Nonetheless, care must be taken when using this modern classification system to determine the suitability of agricultural resources to 19th-century agriculture. One concern is that land quality may have changed over time through urbanization and permanent degradation due to poor farming practices. Although less extensive than today, urbanization was locally important in the 1960s and 1970s so that, for example, 45 per cent of the land area of the 1976 census district of metropolitan Toronto was not classified because it had been urbanized.19 However, only 0.5 per cent of Ontario’s land was designated class eight because of urban development, so that while adjustments must be made in local areas, overall the problem is small.20 The failure to classify organic soils was more important; 9 per cent of Ontario’s soils and 8 per cent of New Brunswick’s were organic. Past misuse of the land may have caused erosion and salinity resulting in permanent reduction in the land’s agricultural potential, but very little land was downgraded due to these factors.21 The classification according to potential soil fertility reduces concern about depletion of soil fertility due to poor crop rotation.
10 Climate change might also have altered the reliability of the 20th-century survey for 19th-century conditions. Some climate change had occurred by the 1970s. Temperatures rose during the last years of the previous century until 1940, then cooled slightly from those peaks; in the late 1970s, the current warming trend began. Even in Ontario, aridity and excessive heat were rarely limiting factors for agriculture; thus, the warming trend up to the date of the soil classification likely improved farming conditions in both regions. The Great Lakes Basin and the St. Lawrence Lowlands warmed more than Atlantic Canada (0.7 versus 0.4 degrees centigrade) between 1895 and 1991. However, the former region warmed considerably more than the latter in the 1980s, so that in the 1960s and 1970s the difference in trend was less than 0.3 degrees centigrade.22 It seems unlikely that the relative ranking of land would have been substantially altered by these changes in temperature. Most of the other factors which limited land’s agricultural potential are largely immutable. Shallowness to bedrock, stoniness of soils, hilly topography, moisture-holding capacity due to soil structures (based on loam, sand or clay) are characteristics which do not change greatly with time. Perhaps in some areas, changes in river courses or shifts in the water table have altered vulnerability to flooding or changed other causes of excess water, but these changes are unlikely to have altered significant land areas.
11 A more troubling concern about the use of the modern survey for historical work stems from changes in agricultural technology rather than from changes in the land and climate. Agriculture was not mechanized in the 19th century, and difficulties created by conditions such as hilliness may have been less a problem in the past than in the present. Other problems which are relatively easy to correct today may have presented serious obstacles to farming in the past. For example, today’s farmers have access to better technology and cheaper capital which together have greatly eased the difficulty of improving drainage. Much poorly drained land in southwest Ontario received a class two ranking, although 19th-century farmers found these soils difficult to improve sufficiently for agriculture. Substantial acreage was only brought into production after community-wide drainage projects were facilitated by legislation enacted in 1869 and 1873. Even by the criteria of the Canada Land Inventory, these lands would have received a lower ranking in 1870 than in 1970, since the improvements were beyond the capacity of individual farmers.23 Quite possibly other changes in the technology of farming and land improvement have altered the relative productivity of different types of land. At the same time, flat land was always preferred to hilly land; rich, deep soils to shallow, stony soils; warm long summers with good rainfall to short cool summers or to excessive aridity. Ideally, historians would have access to an objective assessment of the agricultural potential of lands appropriate to conditions of the 19th century. Without such an ideal, historians have made use of the imperfect tool of land quality surveys designed for contemporary conditions. Systematic comparison of agricultural development to agricultural resources as defined by this tool should be instructive. While the tool must be used with care, it should help in understanding the pattern of agricultural development in Canada at the time of Confederation.
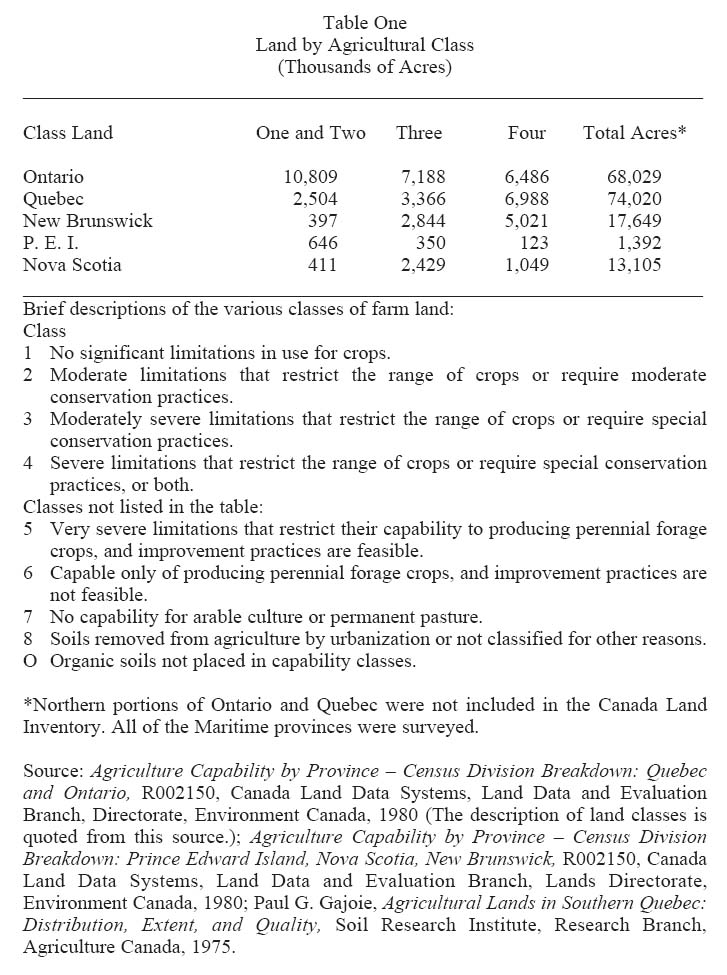
12 The results of the Canada Land Inventory indicate that good agricultural land is very unevenly distributed. Due to the limitations imposed by the late springs and cool wet summers of the Maritimes, the region has no class one farmland. In contrast, Ontario possesses more than five million acres of class one land, more than 97 per cent of those lands in eastern Canada. Table One shows that the uneven distribution of land extends to other classes as well. Ontario has more than three times as much class one through three land as any of the other provinces. While Prince Edward Island has a very good proportion of its lands in class two, the total amount of good land available is naturally but a small fraction of the land in Ontario. New Brunswick is remarkable for the large proportion of land which is class four and is very marginal for agriculture. The absolute number of acres of good land in each province matters, because the total number of settlers who could establish themselves as farmers was limited by the number of acres of land suited to agriculture. The Maritimes were at a disadvantage not just because a small proportion of its land area was suited for agriculture, but also because the absolute quantity of good quality land was so limited.24
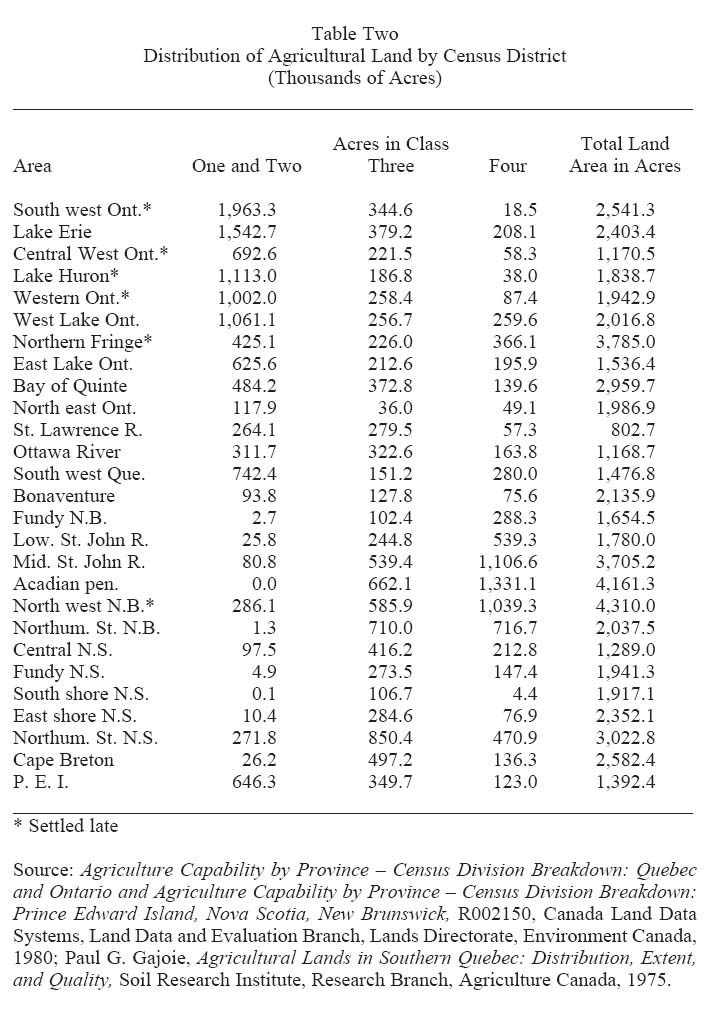
13 Table Two presents the distribution of the four top classes of agricultural land among groups of census districts in the regions. Perhaps most noteworthy is the very large concentration of excellent farmland in Ontario west of Lake Simcoe and south of Georgian Bay.25 This part of the province has 7.4 million acres of class one and two lands, 62 per cent of the class one and two lands in all of the districts included in this study. The eastern half of Ontario is less well-endowed, although the region still has large pockets of class one and two lands. Prince Edward Island has very good farmland, possessing 646,000 acres of class two lands or 46 per cent of its land area. The remainder of the Maritimes contains 900,000 acres of class two lands, but they are scattered in pockets in northwestern New Brunswick, along the St. John River, in central Nova Scotia, along the Northumberland Strait in Nova Scotia and in Bonaventure, Quebec.26 Finally, the south and east shores of Nova Scotia, the coast of the Bay of Fundy and the counties along the Northumberland Strait of New Brunswick contained only small amounts of the best farmland, so that very few farmers in these areas had access to soils better than class three.
Table One : Land by Agricultural Class (Thousands of Acres)
Display large image of Table 1
Table Two : Distribution of Agricultural Land by Census District (Thousands of Acres)
Display large image of Table 2
14 These endowments of agricultural land had a strong impact on the numbers of people who settled in each district and on the extent of agricultural development. However, the timing of settlement was determined largely by access to markets, proximity to earlier settlement and political circumstances. Settlement in North America followed a distinct pattern.27 Typically a district experienced a long period in which it was too isolated to attract settlers, followed by a relatively brief period of rapid population growth. Once a district was filled up by this rapid growth, a lengthy period of net emigration began in which the natural increase in population joined new immigrants in peopling districts formerly too remote to attract settlers. Most rural districts in Ontario reported their peak populations in the censuses of 1871 or 1881, although many peaked earlier and a few counties grew until the early 20th century.28 Urbanization reduced net out-migration, but for Canada as a whole to have eliminated the net emigration experienced from the 1860s to the 1890s would have required extraordinary rates of urbanization. Instead, Canada experienced net emigration until a new frontier opened in the west.29
15 The observed pattern of migration seems to reflect sensible behaviour which can be modelled in the following way. People migrated when they expected to receive a higher income in the area of new settlement than they could secure at home. A particular district attracted migrants only if it offered the possibility of earning an income comparable to the income available in other districts open for settlement.30 Closeness to markets and proximity to previous settlement increased the income earned from a given quality of land by providing higher prices for output. The presence of neighbours enriched life and reduced the risks of settlement, so that satisfactory land in the most accessible districts was preferred to land in more remote districts.31 As a result, good land in remote districts was often unclaimed while settlement proceeded in more conveniently located districts. Once the good land in a district had been taken up, new farms yielded a lower income than land in other districts, either because the added farms were smaller or because they were on poorer quality soil. Many of the children of the first settlers were forced to emigrate or to accept a lower income as the price of remaining near to kin. In districts with excellent access to markets, high prices for farm produce tended to offset declining farm size or soil quality, so that more intensive settlement was possible without seriously reducing incomes. As a result, settlement was more likely to have been extended onto poorer lands in those longest settled districts which were closest to markets. Districts where the descendants of the settlers were particularly reluctant to emigrate would also have developed more poor land.
16 Low land prices could not induce settlement on lands too poor to provide an adequate income. The price of poor land was low because it yielded less income for a given amount of effort.32 Even if the land were free, a family would refuse to settle on it if it yielded less income than could be earned working for wages, after allowing for differences in the risks and conditions of work in the alternate occupations.33 Families able to pay a high price for land exchanged financial assets for productive real estate which yielded a good income. Families with more limited financial assets were too poor to secure such valuable properties, and had to content themselves with the lower income produced by poorer land. The payments to purchase land were merely transfers of assets between buyers and sellers. The implications of this model of migration are that families ceased to enter a district when additional farming families would earn lower incomes than they could obtain elsewhere, so that migration often ceased when much poor land was unsettled. In districts where most of the land was good, declining farm size limited settlement.
17 The productive capacity of the land and market conditions were not the sole determinants of the timing or the extent of settlement. Political circumstances drove out the Acadians and attracted the Loyalists, while military considerations and the suitability of harbours directed the establishment of many urban centres.34 In addition, other types of primary production such as fishery, forestry and mining attracted significant numbers of settlers. This study does not intend to diminish the importance of these other influences by focussing on agriculture. Nonetheless, since settlers were dependent on local agricultural production, districts with rich agricultural resources were likely to support far more settlers than those without, whatever the initial reason for settlement. Agriculture resulted in a much denser population per square mile than any other form of primary production. For example, mining established concentrated urban centres, but mining towns did not necessarily create a higher population density than that stemming from a substantial district of good farmland. In 1871, Pictou County, Nova Scotia, with a seaport, coal mines and timber production as well as farming, had 29 people per square mile. Wellington County, Ontario, by comparison, without the seaport and coal mines, but with excellent farmland, had 50 people per square mile.35
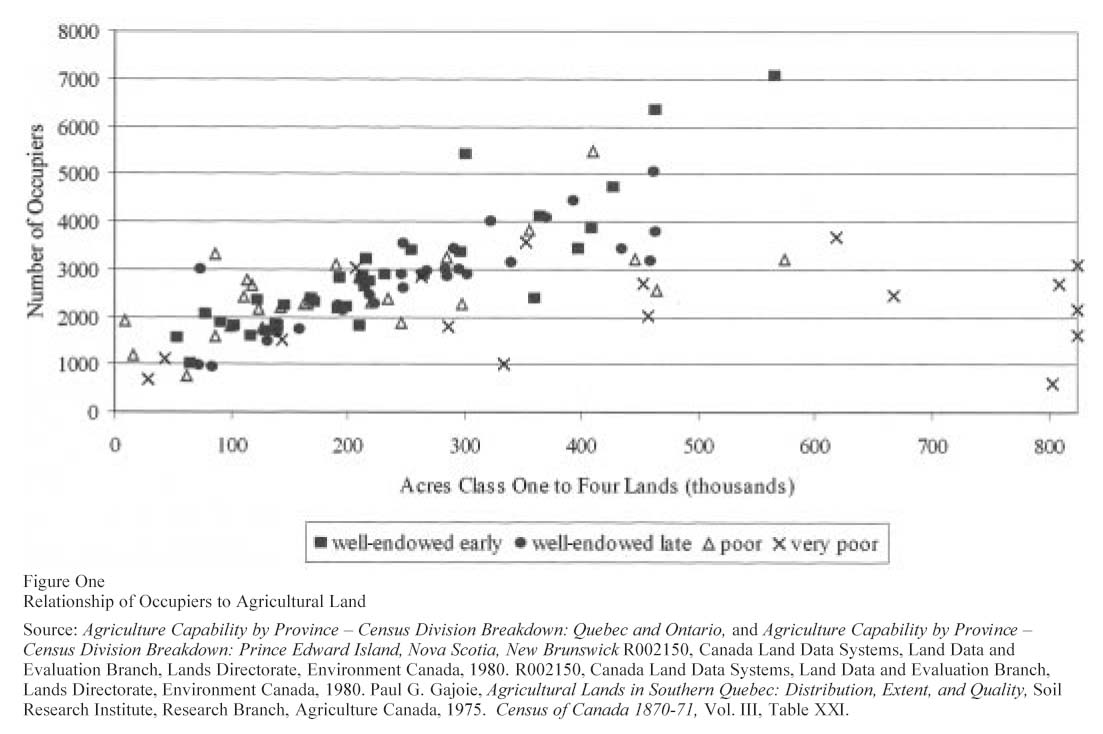
18 Although other factors also influenced settlement, the productive capacity of the land had a very strong impact on the number of settlers and on the extent and nature of agricultural development. The tendency of good farmland to attract settlers is illustrated in Figure One.36 In well-endowed districts (solid symbols) where much of the agricultural land was class one and two, additional acres of land attracted additional farming families, so that the number of occupiers increased in proportion to the acres of agricultural land.37 In sharp contrast, in very poorly endowed districts (Xs), where much of the land was class four, additional acres of land failed to draw more settlers, and the number of occupiers did not rise with the acres of land. In poorly endowed districts (open triangles), where class three lands predominated, the number of occupiers increased with agricultural acres, but the relationship was looser than for well-endowed districts.
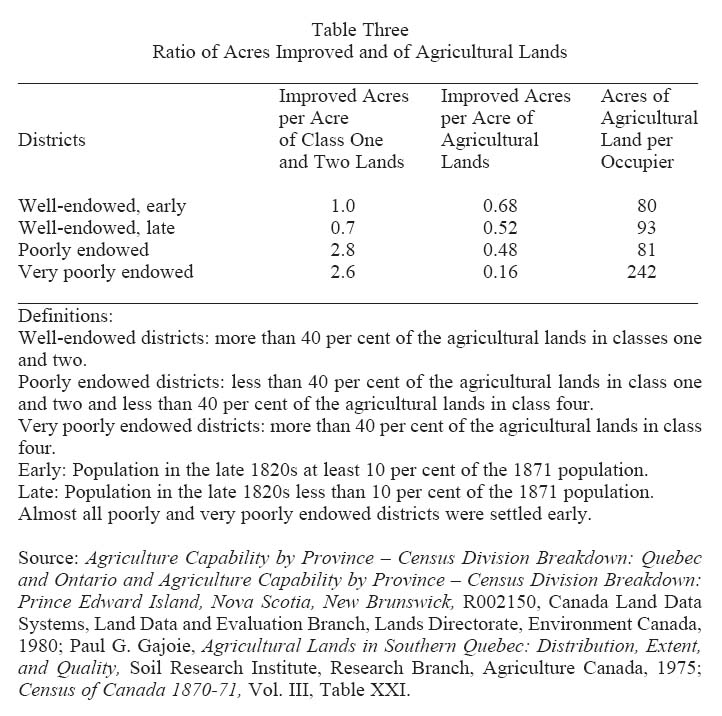
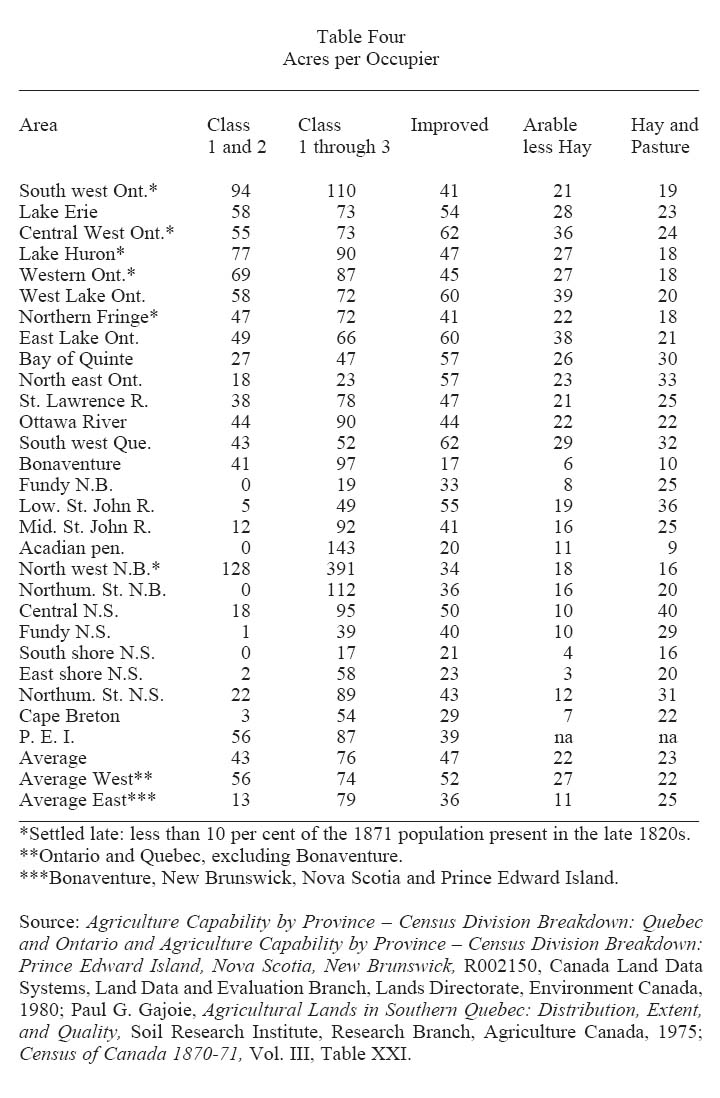
19 Not only the number of settlers, but also the amount of land they improved varied with the quality of land.38 Except where settlement was late, so that clearing was incomplete, the number of acres improved usually equalled or exceeded the acres of class one and two lands (Table Three).39 Because farmers owned so few acres of excellent land in the poorly and very poorly endowed districts, the ratio of acres improved to acres of class one and two lands was highest there. In contrast, the proportion of class one through four lands improved was much lower in the less well-endowed than in the well-endowed districts. Only exceptionally did the number of acres improved exceed the acres of class one through three lands (Table Four).
Figure One : Relationship of Occupiers to Agricultural Land
Display large image of Figure 1
Table Three : Ratio of Acres Improved and of Agricultural Lands
Display large image of Table 3
20 While the pattern of agricultural development in response to resources is clear, some areas deviated from that pattern. Table Four shows that in much of eastern Ontario, farming families settled on and improved poorer land than in most of Canada. To a lesser extent, the same pattern of overdevelopment is found in southwest Quebec. The figures for areas represent averages that obscure the precise location of overdeveloped districts, so that deviations are best discussed at the district level. The most overdeveloped districts were Addington, Lanark South and Lanark North in the area called "North Eastern Ontario" and Peterborough North in the "Northern Fringe". In these places, lands worse than class three were not only improved for pasture or hay, but were pressed into arable. In other districts in Ontario, acres improved, but not acres in arable, exceeded acres of class one to three lands. These were Frontenac, Prince Edward, Hastings North and Lennox along the Bay of Quinte, Durham East along East Lake Ontario, Leeds South, Leeds North Grenville, Brockville and Grenville along the St. Lawrence and portions of southwest Quebec near the Richelieu River and Huntingdon.40 In nine of these 14 districts, class one and two lands were more than 40 per cent of agricultural lands. In six of these nine well-endowed districts, the number of acres improved exceeded the available acres of agricultural land, so that farmers were necessarily using class five lands. The juxtaposition of pockets of very good land and quite poor soils may have led farmers in these districts to clear land of a quality usually left idle. Farmers in the seven less-well-endowed districts also cleared more land than farmers in comparably endowed districts elsewhere, although the acres improved exceeded acres of agricultural land only in Leeds South. The very early start to settlement in most of these areas and the stimulus of markets in the lumber camps of the Ottawa Valley, and in Kingston, Montreal and the United States may explain the excessive development.41 In the Maritimes, improved acres exceeded the acres of class one to three lands in Saint John and King’s counties in New Brunswick and Annapolis, Shelburne and Queen’s counties in Nova Scotia. Farmers were forced to use lands worse than class four only in the Nova Scotia counties. The early date of settlement and the ability to combine farming and fishing may have encouraged farmers to push agriculture onto poorer lands.
Table Four : Acres per Occupier
Display large image of Table 4
21 Another group of districts stand out because they were underdeveloped. The quality of class one and two land was sufficiently high that farmers normally attempted to bring all of it into agricultural production. In 1870, farmers in many late-settled districts had not yet cleared all the class one and two lands. In most cases, late settlement resulted from the inland location; settlers moved to districts with better market access and with more neighbours before they moved to remote districts. The sheer quantity of land to develop may also have led to a failure to clear all good land; in half the underdeveloped districts, class one and two lands were more than 80 per cent of all the agricultural lands. Farmers in these more remote districts simply had not yet had time to clear all the good land.
22 The farmers who settled along Lake Erie also had left class one and two land unimproved. Lake Erie provided good access to markets only after the completion of the Erie Canal in 1825. Distance from markets may have contributed to slow development even in some of the southwestern districts such as Essex and Middlesex East where political factors induced early settlement. The proportion of good land improved increased sharply from the southwest to eastern Lake Erie, possibly reflecting the influence of access to markets. However, it is likely that the Canada Land Inventory misrepresents the value of the land to 19th-century farmers in these districts. Most of the land classified as class two in southwestern Ontario was poorly drained. Community, as well as individual, drainage projects were required before the land could be brought into production.42 Problems with drainage may also explain the shift from overdevelopment to underdevelopment in districts such as Russell in eastern Ontario. Large portions of the agricultural lands were downgraded due to poor drainage in that part of Ontario as well. However, the correlation between poor development and poor drainage is far from perfect. A larger proportion of the good land was poorly drained in extremely overdeveloped Addington County than in Russell County. The problem warrants further investigation.
23 A few other districts also failed to improve all of their best lands. More than half the land in the New Brunswick counties of Victoria and Restigouche was class four, but each of these districts had substantial pockets of class two lands. The acres improved were only one-third of the good lands in Victoria County and one-sixth of the good lands in Restigouche. As Béatrice Craig has shown, market access and the uncertainty of the location of the Maine border slowed settlement and resulted in this failure to develop good lands.43 While Restigouche had access to the sea, its class two lands were located well inland, and were as remote from markets as were the good soils in land-locked Victoria County. The underdevelopment of a neighbouring district, Bonaventure, is not so easily explained. Almost one-third of its agricultural land was class two, and much of that land was located along the coast. Settlement began relatively early, but by 1870 farmers had only cleared 17 acres each, far less than the good land available. Rosemary Ommer correctly observed the low level of development and argued that it resulted from the influence of the Robin’s Company, but a more detailed study would be welcome.44 Another anomalous area is Prince Edward Island which improved fewer acres than the vast majority of similarly endowed districts where settlement began early. The proportion of all agricultural lands improved resembled that of neighbouring poorly endowed districts of Nova Scotia. Even the number of occupiers was fewer than in most well-endowed, long-settled districts. Arguments that the land tenure system slowed agricultural development may be correct.45 Finally, although improved acres greatly exceeded acres of class two lands, Hants, Cumberland and Colchester counties in Nova Scotia had developed somewhat less agriculturally than their resources seem to justify. A considerably larger share of the lands of Cumberland and Colchester were class two than in Pictou County, and Hants County had more good land than Antigonish County. Yet the ratio of occupiers and improved acres to agricultural land, and of improved acres to class one and two lands, was much lower in these counties than in their easterly neighbours.
24 While deviations from the normal pattern are numerous, the general patterns of development are clear. Class one and two lands appear to have been highly attractive to settlers. In most districts where sufficient time had passed from initial settlement, the number of improved acres exceeded the acres of class one and two lands. Class three lands were of value to settlers, although the proportion of the agricultural lands cleared were substantially smaller where those lands were predominately class three than where those lands were predominately class one and two. Class four land was of very little value to settlers. Additional acres of class four land failed to attract settlers, and most of the agricultural land in the very poorly endowed districts was not improved for cultivation. Some of the deviations from these patterns seem to be explained by differences in access to markets and by the timing of settlement. Other deviations are not easily explained; identifying the patterns of typical development is helpful in identifying districts that developed atypically and warrant further study.
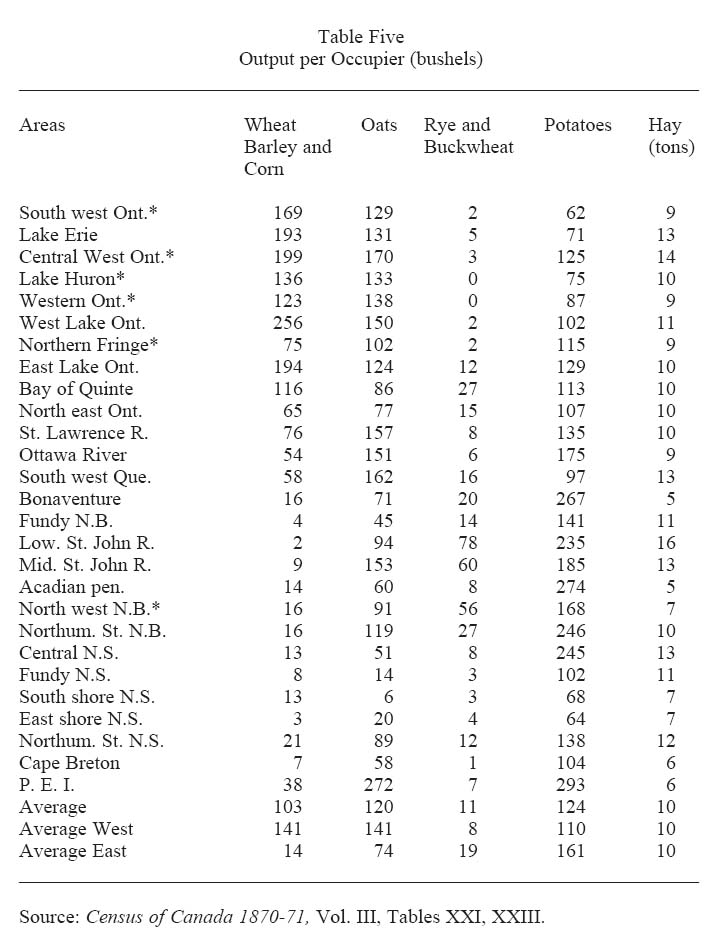
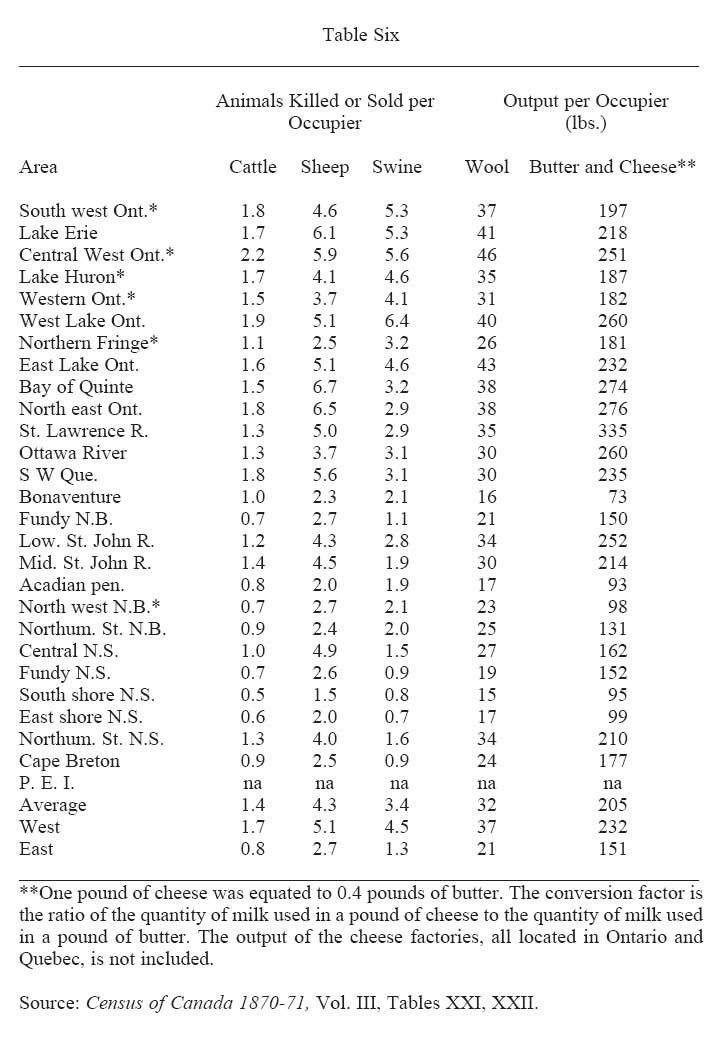
25 The nature of agricultural production also responded to differences in agricultural resources. The number of acres in arable only very rarely exceeded the number of acres of class one through three lands, and usually did not exceed the acres of class one and two lands (Table Four).46 Output of wheat, corn, barley and oats per occupier was much higher in well-endowed areas, while buckwheat and rye, crops suited to poorer soils, were generally important in areas where the acres in arable exceeded the acres of good soil (Table Five).47 Potato production is well suited to the climate of the Maritimes and the good soils in Prince Edward Island and parts of the St. John River Valley are well adapted to that crop, so that its production was well maintained in the Maritimes. Poor soil is better able to support pasture and hay than arable crops, so hay production and acres in hay and pasture did not decline with soil quality. Nonetheless, while farmers in the Maritimes had as much hay and as many acres in pasture as farmers with more good land, the output of meat, wool, butter and cheese was lower (Table Six).48
26 Some examples illustrate the patterns of land use. Farming families living in the early settled census districts along the western end of Lake Ontario had access, on average, to 58 acres of class one and two lands per farm. They improved 60 acres of land per family and planted 39 acres in arable crops, putting 20 acres into hay and pasture. The area had large outputs of grain; wheat output alone averaged 141 bushels per occupier. Table Six shows that production of animal products was also substantial. In contrast, families in the Northumberland Strait area of Nova Scotia had access to 22 acres of class two lands per farm and had improved 43 acres per family, so that these farmers were forced to conduct more agriculture on class three lands than their counterparts in Ontario. They responded by placing only 12 acres in arable crops, fewer acres than the available class two lands. Oats and potatoes, tolerant of acid soils and cool temperatures, and buckwheat, well suited to poor soils, were the most important crops. Hay and pasture tolerated poorer quality land and benefited from the damper climate of the region, and each farm used 31 acres for these uses. Although farms in the Northumberland Strait area devoted 11 more acres to the support of livestock, the number of animals on these farms (except for sheep) and the output of animal products (including wool) tended to be lower than in the west Lake Ontario area (Table Five). Apparently, pasture on class three land was unable to support as many animals as pasture on class one or two lands. In Cape Breton, farmers had far less good land than their mainland neighbours, on average only three acres of class two lands per farm. Families averaged 29 improved acres and restricted the arable to seven acres. Oats and potatoes were the most important crops. Twenty-two acres were in pasture and hay. With fewer acres in production, average output of all products was lower than along the Northumberland Strait. A somewhat different pattern appears in Sunbury, Carleton and York Counties along the middle Saint John River. Farmers on average had 12 acres of class two lands. They improved 41 acres, placing 16 acres in arable, so that they were forced to plant at least one-quarter of the arable crops on lands poorer than class two. In addition to oats and potatoes, these farmers produced substantial quantities of buckwheat. With four more acres in arable than along the Northumberland Strait in Nova Scotia, the output of most crops was higher than in that area. However, production of animal products was quite similar to that part of Nova Scotia.
Table Five : Output per Occupier (bushels)
Display large image of Table 5
Table Six
Display large image of Table 6
27 In the atypical areas where very poor land was developed for agriculture, the types of farming were adjusted to the quality of the agricultural resources. Either the acres in arable tended to be substantially fewer than in neighbouring areas, or farmers grew more rye or buckwheat – crops suited to poor soils – than in neighbouring areas.49 Lanark North and South in northeast Ontario and Leeds North Grenville near the Bay of Quinte were exceptions in placing substantial acreages on poor land without resorting to the production of buckwheat or rye.
28 Some exceptional areas in the Maritimes merit discussion. Table Four reemphasizes the extent to which good land was underutilized in Prince Edward Island, Bonaventure and northwestern New Brunswick. The acres of class one and two lands per occupier exceeded the acres improved by 17 acres in Prince Edward Island, 24 acres in Bonaventure and 94 acres in northwest New Brunswick. The composition of agricultural output in these areas also deviated from the norm. Island farmers improved only 39 acres per farm, scarcely above the average of 36 acres in the Maritimes and well below the average of 57 acres in Central Canada. Nonetheless, they produced more oats and potatoes than in any of the other areas included in this study. Presumably these farmers tended to specialize in those crops. However, in Bonaventure and northwest New Brunswick, crop production resembled less well-endowed districts in spite of the abundance of good land. Although potato output per occupier in Bonaventure was second only to Prince Edward Island, farmers in that area planted only six acres in arable crops, and buckwheat production was substantial. In northwest New Brunswick, more than half the improved acres were in arable crops, but as with the counties along the Saint John River, buckwheat production was quite important. Agricultural activity in this area failed to reflect the quality of the land available. In northwest New Brunswick, location may have encouraged farmers to use well-located poor lands instead of remote good lands. The pattern in Bonaventure is more difficult to understand.
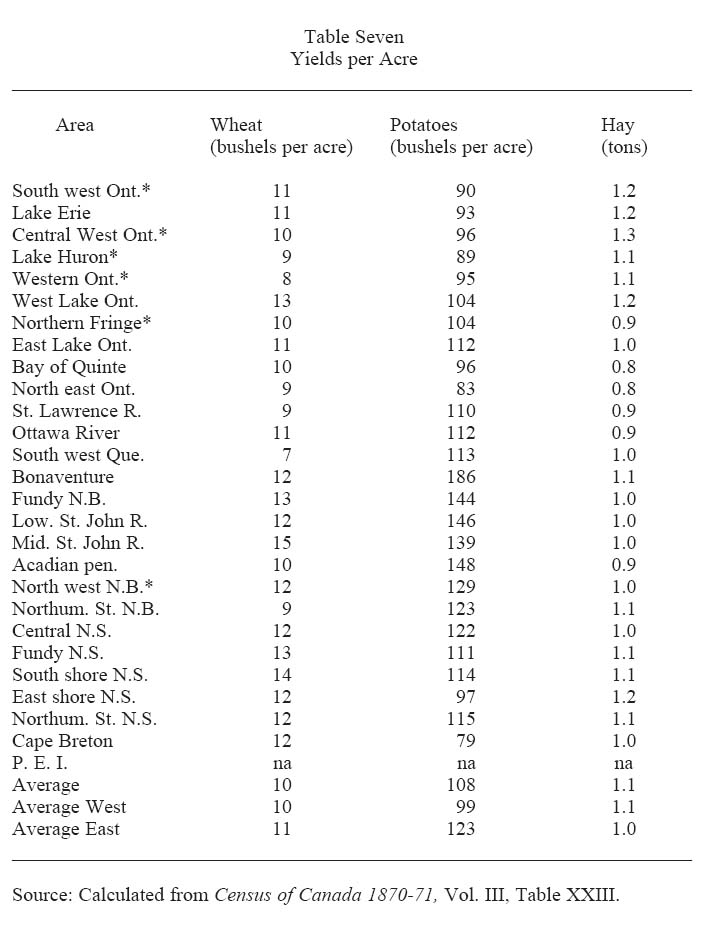
29 The tendency to have less agricultural development rather than less productive agriculture is indicated by information on yields. Unfortunately, information on yields for one year is not very reliable. The census gives the acres planted in wheat, potatoes and hay, so that yields of these crops can be calculated and are shown in Table Seven. In the 1870 crop year, Maritime farmers enjoyed yields of these crops comparable to or slightly better than yields in Ontario. However, information on yields from a single year must be used with great caution, because agricultural output varies so greatly from year to year. In this census year, yields seem to have been unusually low, particularly in Ontario. Marvin McInnis reported Ontario wheat yields of 17 bushels per acre in 1861. The census of 1881 indicates wheat yields of 14 bushels in Ontario, 12 in New Brunswick and 13 in Nova Scotia.50 Speculating about the implications of the yields for each area is tempting. But the data are not reliable enough to permit the assumption that the overdevelopment of areas such as northeast Ontario caused the low yields found there in 1870. Still, the observation that yields varied far less than the number of acres planted in the crops seems safe enough. This observation provides added support for the argument that Maritime farmers competently adapted their practices to their circumstances.
30 The results of this study help to explain the apparent contradiction between studies showing that the Maritimes was a poor place for agriculture and studies demonstrating that many farms had quite good levels of production. Maritimers put their energies into clearing and ploughing only the limited quantities of productive lands which yielded sufficient returns for their labours. Rather than growing crops such as wheat, barley or corn which were poorly suited to the region, they raised potatoes and oats and put land into pasture and hay production, uses of the land better suited to a cool wet climate and poor soils. In areas with the least good farmland, such as southeastern Nova Scotia, improved acres per farm were less than half the national average and 80 per cent of the improved acres were in pasture or hay. In a better-endowed area such as the Northumberland Strait of Nova Scotia, improved acres per farm were about 90 per cent of the national average, although acres in arable were only 55 per cent of the average. In general, Maritime farmers responded to the limited quantity and quality of agricultural resources by farming less, improving fewer acres where soils were poor and planting fewer of those acres in more demanding arable crops.
31 While planting fewer acres and raising less-demanding crops was an intelligent response to limited resources, the result was that the output per occupier of almost every agricultural product, including animal products, was substantially lower in the Maritimes than in the western part of the country. The only exceptions were potatoes, buckwheat and hay. The implication is that farm families in the Maritimes on average earned substantially less from agriculture than their counterparts in Ontario.51 However, restricting agricultural activity freed labour and capital for other uses. Off-farm earnings likely did more to improve incomes than attempting to nurture additional crops in thin stony soils; thus occupational pluralism was a sensible response to poor agricultural resources.52
Table Seven : Yields per Acre
Display large image of Table 7
32 The differences between the agricultural resources of the Maritimes and those of Ontario, particularly the western portion of Ontario, created very different domestic economies. The large proportion of Ontario’s land area that was well suited to farming and the high quality of that land attracted more farm families than the poorer agricultural land of the Maritimes. The result contributed greatly to denser population per square mile (Table Eight). Even if income per capita had been the same in both regions, Ontario would have had a higher income per square mile.53 Local saw mills, grist mills, tanneries, carding and fulling mills, harness shops, shoe factories, woolen factories and foundries drew on substantially larger local markets than were available in the Maritimes. Ontario’s shops and mills could achieve more cost-reducing economies of scale, without incurring transportation costs, than the shops and mills of the Maritimes.54 The occupational pluralism of the Maritimes encouraged its own pattern of diversification; fishing, forestry, shipping, shipbuilding and mining complemented and supported agriculture by providing markets for farm products and employment for settlers.55 These economic activities tended to be export oriented, and trade per capita was substantially higher in the Maritimes than in Ontario.56 However, this diversification did not attract as large a population as Ontario’s good land did and failed to raise population density sufficiently to create local markets comparable to those in Ontario.
33 At Confederation, the foundations for economic development in the two regions differed greatly. That the economic policies adopted in Ottawa harmed the economy of the Maritimes is a theme in the literature which deals with the economic development of the Maritimes. Because of the differences in the structures of the economies of the Maritimes and Central Canada at Confederation, policies which assisted the development of one region were likely to be ill suited to the other.
Table Eight
Source: Population density is calculated from the fifth column of Table Two and Census of Canada 1870-71, Vol. III. The shares of land in classes one and two are calculated from Table Two.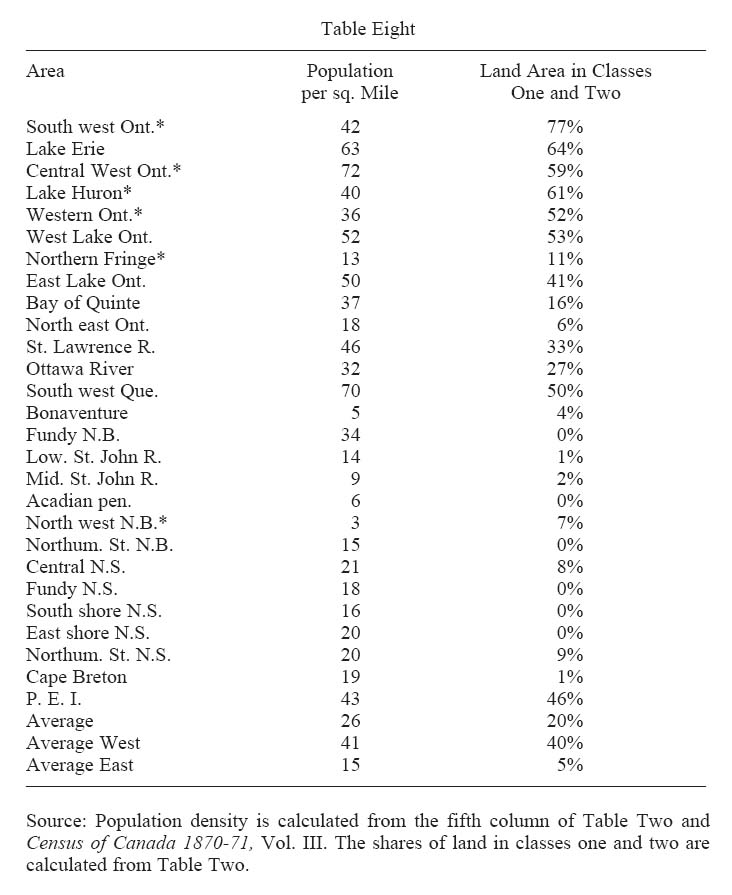
Appendix One : The Definition of Districts
34 Most often, the districts are geographically identical with the districts of the 1871 Canadian census with the addition of Prince Edward Island. The purely urban districts – London, Hamilton, Toronto, Kingston and Ottawa – were excluded. Parts of York East and York West were also excluded because of high levels of urbanization at the time of the modern land surveys. The northern districts from 83 to 90 were also excluded since they were beyond the fringe of agricultural settlement in 1871.
35 For the purposes of this study, individual census districts have been grouped into geographical areas (e.g., South West Ontario). Because data from the Canada Land Inventory was correlated with modern census boundaries, some townships had to be removed from their 1870 census districts to corresponding modern census districts. The following list indicates the geographic area and the corresponding district names included within each. The asterisk denotes areas and/or districts that were settled late.
South West Ontario*: Essex , Kent*, Bothwell*, Lambton*, Elgin W, Middlesex W*, Middlesex N*
Lake Erie: Elgin E, Middlesex E, Oxford S, Oxford N*, Brant N and S, Haldimand and Norfolk, Lincoln and Monck, Niagara and Wellington
Central West Ontario*: Wentworth N and S; Perth S; Waterloo S and N*; Wellington S*; Wellington C*
Lake Huron*: Huron S*; Huron N*; Bruce S*; Bruce N*
Western Ontario*: Perth N*; Wellington N*; Grey S*; Grey N*
West Lake Ontario: Halton; Peel (and Caledon, Albion); Cardwell (Mono Adjala only); Simcoe S*; York (and York W. and Markham); Ontario S; Ontario N* (and Cartwright)
Northern Fringe*: Simcoe N*; Victoria N*; Peterborough N*; Renfrew S*; Renfrew N*
East Lake Ontario: Durham W (less Cartwright); Durham E; Victoria S*; Northumberland W; Northumberland E; Peterborough W*; Peterborough E*
Bay of Quinte: Prince Edward; Hastings W; Hastings E; Hastings N*; Lennox; Frontenac; Leeds S; Grenville and Brockville; Leeds and Grenville N
North East Ontario: Addington*; Lanark S; Lanark N
St. Lawrence River: Dundas; Stormont and Cornwall; Glengarry
Ottawa River: Prescott; Russell; Carleton
South West Quebec: Beauharnois, Chateauguay, Huntingdon E and W; Laprairie, Napierville, St. Jean, Chambly, Verchères; Richelieu, St. Hyacinthe, Rouville
Bonaventure: Bonaventure
Fundy New Brunswick: Saint John; Charlotte; Albert
Lower St. John River: King’s; Queen’s
Middle St. John River: Sunbury; York; Carleton
North West New Brunswick*: Victoria*; Restigouche
Acadian Peninsula: Gloucester; Northumberland
Northumberland Strait New Brunswick: Kent; Westmorland
Central Nova Scotia: Hants; Kings
Fundy Nova Scotia: Annapolis; Digby; Yarmouth
South Shore Nova Scotia: Shelburne; Queens; Lunenburg
East Shore Nova Scotia: Halifax (W and E); Guysborough
Northumberland Strait Nova Scotia: Cumberland; Colchester; Pictou; Antigonish
Cape Breton: Inverness; Victoria; Cape Breton; Richmond
Prince Edward Island: Kings; Queens; Prince
Notes